z
RESEARCH ARTICLE
BIOPHYSICAL ASSESSMENT OF WATER QUALITY AT MPHOSONG-BOLAHLA CATCHMENT
Mphonyane H. Ntlele, Makoala V. Marake, Sebolelo F. Molete, Francis T. Mugabe, Botle E.
Mapeshoane, Tumelo Nkheloane , Joseph Patrick Mensah
1and Tebello A. Sekhobe
1
Department of Soil Science and Resource Conservation, National University of Lesotho, P. O Roma 180, Maseru,
Lesotho, Zimbabwe Open University, P. O. Box MP 1119 Mount Pleasant, Harare, Zimbabwe
ARTICLEINFO ABSTRACT
Water quality monitoring is the integrated activity for evaluating the physical, chemical and biological characteristics of water in relation to human health, ecological conditions and designated water uses. However for the purpose of this study, the assessment focused on Temperature, total phosphorus, Total Nitrogen, pH, total dissolved solids, turbidity, Electrical conductivity and base cation (Mg and Ca) concentrations. These being some of the parameter that are measured in water and sewage company in Lesotho to indicate the water quality in our resources, therefore the same thing applied to our study since we were supposed to determine the water quality in Bolahla Mphosong catchment. Water quality and quantity indices were measured from 22 selected water resources. Some water quantity indices were measured right in the field using physical measurements or chemical methods based on a field toolkit while others were measured in the laboratory. The water quality parameters that were measured were, water temperature, pH, EC, TDS, Turbidity, ions (Mg, Ca, , nitrates, phosphates) and chemical oxygen demand while the water quantity parameters included, water flow, water point depth and water flow rate. The water testing kit was used to measure the water quality parameters like temperature, pH, EC and TDS in the selected water resources per sub catchment and other parameter were analyzed in the laboratory. The water testing kit was used to measure water quality while for water quantity, measuring tape, measuring stick and the wading rod were used and the float method and current meter method for flow velocity. Most water resources in terms of water quality seemed to be within the recommended drinking water standards except for the stagnant water in dams and wells however the water quantity (depth, width and flow) seemed to have decreased in the study area.
Copyright©2019,Mphonyane Ntlele al.This is an open access article distributed under the Creative Commons Attribution License, which permits unrestricted use, distribution, and reproduction in any medium, provided the original work is properly cited.
INTRODUCTION
The detrimental effects of water pollution on the environment and human health have been reported in many studies worldwide (van der Hoven et al., 2017;Azam et al., 2018;Seifi
et al., 2019). In recent assessments in South Africa (Van der
Hoven et al., 2017), physicochemical parameters from most of the land uses did not meet the South African drinking water quality guidelines. The foregoing are in fact corroborating earlier studies (Pokras and Kneeland, 2009; Savci, 2012; Qiu
et al., 2015) on the state of water quality in different parts of
the world. However, despite this abundance of knowledge,
the world’s water resources continue to face extreme
challenges with respect to quantity and quality mostly due to the explosion of global population and the insatiable demand for natural resources (Lee and Schwab, 2005; Okello et al., 2015) compounded by climate change pressures and stressors. The quality of water resources is influenced by land use within
catchments (Ding et al., 2015; Yang et al., 2016). For instance, the water resources underlying and /or downstream of cropping
lands have high possibility of having higher phosphate and nitrates concentration due to fertilizers applied in the fields through erosion and /or leaching. Deferent land uses have been found to exert varying degrees of nutrient loading pressure on aquatic environments in different parts of the world (van der Hoven et al., 2017) compounded by pressures
like the country’s growing population, rapid industrialization
and waste discharge in water resources. Pollutants that enter into surface water sources could be either chemicals (Zheng et
al., 2011) or microbial (Hampson et al., 2010) in nature. The
latter includes bacteria, viruses, and parasites (Abraham, 2011) and is known to constitute the greatest threat to human health associated with water quality because they are causal agents of many waterborne diseases (Schreiber et al., 2015; UNEP GEMS/Water Programme, 2008). Africa as a whole has been reported to be arid despite its high annual rainfall, due to the higher temperatures experienced by the continent (Pimentel et
al., 2013). In addition to the water shortages due to increased
demand for food production (intensive irrigational agriculture), there is also an ever-increasing deterioration of water quality
ISSN: 0975-833X
International Journal of Current Research Vol. 11, Issue, 09, pp.7073-7083, September, 2019
DOI: https://doi.org/10.24941/ijcr.36319.09.2019
INTERNATIONAL JOURNAL OFCURRENTRESEARCH
Article History:
Received 15thJune, 2019 Received in revised form 12thJuly, 2019
Accepted 16thAugust, 2019 Published online 30stSeptember, 2019
Citation: Mphonyane H. Ntlele, Makoala V. Marake, Sebolelo F. Molete, Francis T. Mugabe, Botle E. Mapeshoane, Tumelo Nkheloane , Joseph Patrick Mensah1 and Tebello A. Sekhobe, 2019.“Biophysical Assessment of water quality at Mphosong-Bolahla catchment”, International Journal of Current Research, 11, (09), 7073-7083.
Availableonlineathttp://www.journalcra.com
Key Words:
Land degradation, Water Quality, LADA Local Tools and Methods, Biophysical Assessment.
z
RESEARCH ARTICLE
BIOPHYSICAL ASSESSMENT OF WATER QUALITY AT MPHOSONG-BOLAHLA CATCHMENT
Mphonyane H. Ntlele, Makoala V. Marake, Sebolelo F. Molete, Francis T. Mugabe, Botle E.
Mapeshoane, Tumelo Nkheloane , Joseph Patrick Mensah
1and Tebello A. Sekhobe
1
Department of Soil Science and Resource Conservation, National University of Lesotho, P. O Roma 180, Maseru,
Lesotho, Zimbabwe Open University, P. O. Box MP 1119 Mount Pleasant, Harare, Zimbabwe
ARTICLEINFO ABSTRACT
Water quality monitoring is the integrated activity for evaluating the physical, chemical and biological characteristics of water in relation to human health, ecological conditions and designated water uses. However for the purpose of this study, the assessment focused on Temperature, total phosphorus, Total Nitrogen, pH, total dissolved solids, turbidity, Electrical conductivity and base cation (Mg and Ca) concentrations. These being some of the parameter that are measured in water and sewage company in Lesotho to indicate the water quality in our resources, therefore the same thing applied to our study since we were supposed to determine the water quality in Bolahla Mphosong catchment. Water quality and quantity indices were measured from 22 selected water resources. Some water quantity indices were measured right in the field using physical measurements or chemical methods based on a field toolkit while others were measured in the laboratory. The water quality parameters that were measured were, water temperature, pH, EC, TDS, Turbidity, ions (Mg, Ca, , nitrates, phosphates) and chemical oxygen demand while the water quantity parameters included, water flow, water point depth and water flow rate. The water testing kit was used to measure the water quality parameters like temperature, pH, EC and TDS in the selected water resources per sub catchment and other parameter were analyzed in the laboratory. The water testing kit was used to measure water quality while for water quantity, measuring tape, measuring stick and the wading rod were used and the float method and current meter method for flow velocity. Most water resources in terms of water quality seemed to be within the recommended drinking water standards except for the stagnant water in dams and wells however the water quantity (depth, width and flow) seemed to have decreased in the study area.
Copyright©2019,Mphonyane Ntlele al.This is an open access article distributed under the Creative Commons Attribution License, which permits unrestricted use, distribution, and reproduction in any medium, provided the original work is properly cited.
INTRODUCTION
The detrimental effects of water pollution on the environment and human health have been reported in many studies worldwide (van der Hoven et al., 2017;Azam et al., 2018;Seifi
et al., 2019). In recent assessments in South Africa (Van der
Hoven et al., 2017), physicochemical parameters from most of the land uses did not meet the South African drinking water quality guidelines. The foregoing are in fact corroborating earlier studies (Pokras and Kneeland, 2009; Savci, 2012; Qiu
et al., 2015) on the state of water quality in different parts of
the world. However, despite this abundance of knowledge,
the world’s water resources continue to face extreme
challenges with respect to quantity and quality mostly due to the explosion of global population and the insatiable demand for natural resources (Lee and Schwab, 2005; Okello et al., 2015) compounded by climate change pressures and stressors. The quality of water resources is influenced by land use within
catchments (Ding et al., 2015; Yang et al., 2016). For instance, the water resources underlying and /or downstream of cropping
lands have high possibility of having higher phosphate and nitrates concentration due to fertilizers applied in the fields through erosion and /or leaching. Deferent land uses have been found to exert varying degrees of nutrient loading pressure on aquatic environments in different parts of the world (van der Hoven et al., 2017) compounded by pressures
like the country’s growing population, rapid industrialization
and waste discharge in water resources. Pollutants that enter into surface water sources could be either chemicals (Zheng et
al., 2011) or microbial (Hampson et al., 2010) in nature. The
latter includes bacteria, viruses, and parasites (Abraham, 2011) and is known to constitute the greatest threat to human health associated with water quality because they are causal agents of many waterborne diseases (Schreiber et al., 2015; UNEP GEMS/Water Programme, 2008). Africa as a whole has been reported to be arid despite its high annual rainfall, due to the higher temperatures experienced by the continent (Pimentel et
al., 2013). In addition to the water shortages due to increased
demand for food production (intensive irrigational agriculture), there is also an ever-increasing deterioration of water quality
ISSN: 0975-833X
International Journal of Current Research Vol. 11, Issue, 09, pp.7073-7083, September, 2019
DOI: https://doi.org/10.24941/ijcr.36319.09.2019
INTERNATIONAL JOURNAL OFCURRENTRESEARCH
Article History:
Received 15thJune, 2019 Received in revised form 12thJuly, 2019
Accepted 16thAugust, 2019 Published online 30stSeptember, 2019
Citation: Mphonyane H. Ntlele, Makoala V. Marake, Sebolelo F. Molete, Francis T. Mugabe, Botle E. Mapeshoane, Tumelo Nkheloane , Joseph Patrick Mensah1 and Tebello A. Sekhobe, 2019.“Biophysical Assessment of water quality at Mphosong-Bolahla catchment”, International Journal of Current Research, 11, (09), 7073-7083.
Availableonlineathttp://www.journalcra.com
Key Words:
as a result of the waste discharged by these same processing industries into the water bodies (Pimentel et al., 2013). The detrimental impacts of industrial effluents into the streams from the industrial complexes in Maputsoe and Lesotho have been a source of concern for many years and some of the streams in the Thetsane industrial complex have been dubbed
the Blue Streams (‘Mabolou) by local communities
downstream. This constant pressure accompanied by a lack of proper environmental management of these resources ultimately results in a reduction in water availability for human needs as well as loss of biodiversity (Skogen et al., 2018). Ultimately, biodiversity loss threatens human well-being and possibly human existence (Cardinale et al., 2012; Naeem, Chazdon, Duffy, Prager, and Worm, 2016). However, water quality may also be burdened by heavy metals which originate from organic and inorganic fertilizers, pesticide applications and irrigation water (Johannsen et al., 2010). Arguably,
Lesotho’s supply of water resources exceeds national
requirements. However, due to climate change especially rainfall variability, this poses a threat to water resources (Nkheloane et al., 2014; LWP 2016). As a results, the water in Lesotho is in great demand in the lowlands and highlands primarily for domestic and stock-watering needs. In Lesotho approximately 85 percent of people live in the rural areas and rely on open water sources such reservoirs, springs and wells (MOHSW and WHO, 2002; Mofelehetsi, 2005; WHO and UNICEF 2006). Water from such sources seldom complies with WHO permissible standard limits for drinking water (Matsipa, 2008). It is thus necessary to check regularly for contaminants and other water safety parameters with the view to mitigating outbreak of water borne diseases (Gwimbi, 2011). Therefore, the purpose of the study was to assess the effect of water degradation in terms of both water quality and quantity.
MATERIALS AND METHODS
Location: The study was located in the Mphosong-Bolahla catchment from the confluence of Bolahla and Mphosong River to the northeastern escarpment (Figure 1) in the foothills of the Leribe district. The overall catchment was divided into three sub-catchments of Bolahla (18.0 ha), Senyokotho (10.4 ha) and Mphosong (14.2 ha) for a total area of approximately 42.6 ha in size.
Climate and Biophysical Characteristics of the Study Site: The Mphosong-Bolahla catchment is located in the foothills of the northern district of Lesotho between 1,840 m and 3,090 m above sea level. The lowest average minimum monthly temperature in Lesotho was recorded in July (-0.30C) and the highest in January (13.40C). The lowest temperature range (-1.09 to 14.830C) was recorded in June (BOS 2017). The amount of rainfall in Lesotho has been increasing throughout the years, where the highest increase was observed from 2009 (762 mm) to 2010 (865 mm) constituting 13.5 percent. However, since 2012, the district has experienced a sudden decrease of 35.0 percent of the average national annual rainfall (BOS, 2014) leading to minimum annual rainfall of 516 mm while the maximum rainfall was 785 mm in 2012. Farmers in the area mainly practice subsistence mixed farming of livestock ( cattle, horses, sheep and goats) and field crops (maize, beans, wheat and sorghum) with a variety of vegetables and fruit trees (mainly peaches) in the fields and backyard gardens of the homesteads. Leribe is a prime agricultural land with high production except in drought years
e.g. 2015/16 cropping season when farmers experienced high crop failures and most of their lands fallow due to drought (BOS 2017). For instance in the 2016/2017 growing season, the planted area of maize was 33, 629 ha and beans in an area of 5,790 ha far higher than other districts. Some cottage industries of dried fruits are practiced by women in study area and a bakery at Ha Senyokotho village. The geomorphologic character of the landscape is characterized by dendritic drainage pattern with three main streams draining the whole catchment and converging into the Mphosong River. Thus the natural water resources like wells springs and wetlands are distributed within the catchment.
Biophysical Indicators of Specific Water Resources: A detailed assessment was conducted during a transect walk by a team of assessors and a key informants in every village. In particular, key water resources (wetlands, rivers and streams, dams and wells) (Figure 2) identified during the reconnaissance walk conducted prior to the transect walk were assessed in the study area. GPS was used to log the coordinates of all sampling points along the transects. Both the qualitative and quantitative measurements of water quality and quantity in each water resource were evaluated at each sampling point. First, the type of water source was identified, coordinates of that water resource were recorded using the GPS and the land use system was defined. Therefore, qualitative measurements were obtained from the visual observation of water resources by the local informants and the assessment team. The following assessments were made: assessment of water levels, water depth, and potential loss of water by soil evaporation and runoff, colour of water, pollution around the water source e.g. signs of animal faeces and salinity measurements.
Water quality assessment: Quantitative assessment was obtained from the additional measurements of water quality and quantity to verify results of visual assessment. Water quantity variables were water point width, water point depth and water flow. While water quality variables included temperature, Electrical conductivity, TDS pH, Total P, total N and turbidity.For every selected water source, the water testing kit was used to measure water quality parameters by inserting the kit directly in the source to take the readings (Figure 3). The parameters like pH, Temperature, Total Dissolved solids (TDS) and Electrical Conductivity (EC) were measured in-situ using a mini water testing kit (HI 98 129 model). Since the test kit could not measure all the parameters in the field, water samples were taken for further analysis in the Water and Sewage Company (WASCO) laboratory in Maseru for measurement of turbidity, calcium and magnesium hardness, total phosphates, nitrates and chemical oxygen demand. Turbidity was determined using the Nephelometric method, Nitrates by Hach method 8039: Cadmium reduction method, Ca and Mg hardness by EDTA titration method, phosphate by Hach method 8048: ascorbic acid method and COD by potassium dichromate: Digestion absorbance method. Water quality determination was assessed based on the SA drinking water standards which is a benchmark for water treatment in Lesotho.
RESULTS AND DISCUSSION
Water Quality Analysis
Figure 1.Map of Bolahla-Mphosong catchment
Figure 2. Water sampling points along a transect line across the Mphosong-Bolahla sub-catchments
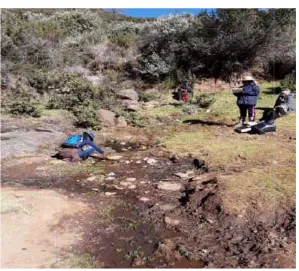
[image:3.595.72.513.471.770.2]Figure 3. Measuring water quality in the Bolahla River
Figure 4. Water temperature in different water resources
Figure 5. Hot natural spring at Ha Botšo in the Mphosong River
[image:4.595.156.455.520.791.2]7076 Mphonyane Ntlele al. Biophysical Assessment of water quality at Mphosong-Bolahla catchment
Figure 3. Measuring water quality in the Bolahla River
Figure 4. Water temperature in different water resources
Figure 5. Hot natural spring at Ha Botšo in the Mphosong River
7076 Mphonyane Ntlele al. Biophysical Assessment of water quality at Mphosong-Bolahla catchment
Figure 3. Measuring water quality in the Bolahla River
Figure 4. Water temperature in different water resources
Figure 5. Hot natural spring at Ha Botšo in the Mphosong River
Figure 7. EC in various water resources
Figure 8. TDS in water resources by water source and sub-catchment
Figure 9. Plot of TDS as a function of EC in the study area
Figure 10. Water turbidity in various resources
Figure. 11. The relationship between temperature and turbidity
Figure 12.Ca Concentrations in water resources
Figure. 13. Mg concentration in water resources
Figure 14.Phosphates in water resources
Figure 15. Nitrates concentration in water resources
Figure 16.COD concentration in water resources
Table 1. Comparative Summary of Water quality Measurements in the Study area with SA drinking Water Standards (1996)
Water quality Measurements SA drinking water standard Temperature(0C) 6 -16 <20 ( WASCO)
pH 10.67-11.53 6.5-8.5
Electrical conductivity (mS/m) 0.10-0.25 0-70 Total dissolved solids (mg/l) 0.04-0.13 0-450 Turbidity (NTU) 0.66-2.46 < 5
Phosphate (mg/l) 2.31-3.92 0.01 ( WHO,2011) Nitrates (mg/l) 3.62-7.84 0-6
Chemical Oxygen Demand (mg/l) 1.44-17.11 <75 (WASCO)
calcium 44.03-74.28 0-32
magnesium 3.53-7.36 0-30
7077 International Journal of Current Research, Vol. 11, Issue, 09, pp.7073-7083, September, 2019
Figure 7. EC in various water resources
Figure 8. TDS in water resources by water source and sub-catchment
Figure 9. Plot of TDS as a function of EC in the study area
Figure 10. Water turbidity in various resources
Figure. 11. The relationship between temperature and turbidity
Figure 12.Ca Concentrations in water resources
Figure. 13. Mg concentration in water resources
Figure 14.Phosphates in water resources
Figure 15. Nitrates concentration in water resources
Figure 16.COD concentration in water resources
Table 1. Comparative Summary of Water quality Measurements in the Study area with SA drinking Water Standards (1996)
Water quality Measurements SA drinking water standard Temperature(0C) 6 -16 <20 ( WASCO)
pH 10.67-11.53 6.5-8.5
Electrical conductivity (mS/m) 0.10-0.25 0-70 Total dissolved solids (mg/l) 0.04-0.13 0-450 Turbidity (NTU) 0.66-2.46 < 5
Phosphate (mg/l) 2.31-3.92 0.01 ( WHO,2011) Nitrates (mg/l) 3.62-7.84 0-6
Chemical Oxygen Demand (mg/l) 1.44-17.11 <75 (WASCO)
calcium 44.03-74.28 0-32
magnesium 3.53-7.36 0-30
The average temperature was lowest in the rivers /streams (9.9oC) followed by dams, wetlands and wells (15.47). The measurements were taken during the month of June when it was winter in Lesotho hence the low temperature ranges. A Hot spring was discovered with the help of key informants in
the upper reaches of the Mphosong River at Ha Botšo (Figure
5). The water in the spring remained hot throughout the day with an average temperature of 23.6oC during the winter months. The water temperature in all water resources except the hot spring was found to be below 200C which is according to WASCO Lesotho, is the prescribed temperature for water consumption. However, Van der Hoven et al. (2017) found that the mean water temperatures measured during the entire study ranged between 8.3 °C and 9.5 °C in winter and between 11.4 °C and 15.1 °C in spring (2017). The reading were lower than the results in our study area in as much as the studies were both done in winter except for the hot spring (230C). Van der Hoven et al., (2017) averred that values were all below the 25 °C recommended limit of the South African domestic water quality and were also lower than those recorded in a study conducted in a rural South African community (Igbinosa and Okoh, 2009). These results shows that the winter climate is beginning to be vigorous in time in most countries including Lesotho with its rapid climate change. The temperature of every aquatic environment is an important physical parameter that directly or indirectly influences other water parameters such as dissolved oxygen (DO) (ARMCANZ and ANZECC, 2000). Drastic reductions in the concentration of DO in water as a result of high-temperature increase may lead to the death of fishes (Kumar and Puri, 2012) while temperature drop below 5 °C may result in the eggs of some water-breeding insects from hatching (ARMCANZ and ANZECC, 2000). The difference in temperature might be due to the location of the study areas, climatic variation and the seasonal variations.
Żelazny et al., (2018) found that Water temperature fluctuations in mountain areas depend not only on the type of analyzed system (stream, spring or lake), but also on the altitudinal zonation and hydrogeological conditions (Zelazny et
al., 2018). Since temperature influences the growth and
survival of microorganisms in the aquatic environment (Van der Hoven et al., 2017), the living organisms that live in the water might be psychrophilic. Aquatic temperature influences the growth of bacteria because temperature is known to affect chemical and microbiological processes (Zlatanovic et al., 2017) and more profound in stagnant waters (Prest et al., 2013), however, most microorganisms grow best at temperatures between 20-40oC while above 40oC the abundance of microorganisms decreases.
Water pH Levels: Generally the average pH in the water bodies in the watershed was in the high alkaline range (Figure 6). The pH ranged between 10.67 and 11.53. the highest value was obtained in Mphosong especially in dams and low in Bolahla in the wetlands. This is possibly reflecting the levels of calcium in the basalt rocks rather than any pollution factors because if the Mphosong stream can be used as a benchmark, there are no villages in the greater catchment area of the stream. In addition the soils of Lesotho are generally acidic in the croplands. Mphosong seemed to have its water resources with high pH, this might be due to the type of rock in the area, limestone, as it weathers it causes high pH in waters. The increase in pH becomes unconducive to acidophiles and again the increase in pH value is accompanied by a flourishing of
photosynthetic organisms (El-Zeiny, 2015). According to South African water standards (1996), the water with the pH >
11 tastes soapy and have the severe health effects due to deprotonated species within the water system. International water pH standards (NIS 2007; WHO 2011) have threshold pH levels for good water quality in range of 6.5-8.5. , Therefore, the pH in the study area is way above this threshold range of the regulatory limits for water quality. This therefore, imply that the water quality in the study area is not good for drinking water. Trace metals also play a great role in water pollution, and these metal concentration are related to pH value of the water. At different pH values, the complex-forming agent or chelating agents shows different coordination behavior toward different metal ions (Verma et al., 2018). Hence, the amount of precipitation of different metal ions is different at different pH values. Narin et al., (2000) observed that the optimum pH range for the efficient recovery of some elements like Co, Ni, and Pb is 4.0–8.0 By decreasing the pH, the precipitation of these elements decreased, the higher the pH in water the higher the possibility of trace elements in water thus causing poor water quality both for domestic purposes and agricultural activities.
Electrical Conductivity: The electrical conductivity in the catchment area was lowest in Bolahla subcatchment (0.15 ms/m) and highest in Senyokotho sub catchment (0.17 mS/m). Figure 7 shows a plot of EC measurement by sub-catchment. The highest levels were observed in wells in the Mphosong sub-catchment and dams at Ha Senyokotho and the lowest value was obtained in mphosong especially in the rivers. Selebatso (2018) found that salinity of the water was high in the ponds compared to the outlets while assessing quality of water at wildfile. This was probably due to accumulation of salts because of evaporation of water, and in some cases, poor filtration due cemented bases of some waterholes. Therefore, the electrical conductivity of the water in the study area was found to be in the range 0-70 mS/m. The threshold limits for drinking water according South African and WHO standards (1996) is 0-70 mS/m hence the EC in the water bodies of the study are is below the critical limits and can be declared to be free from severe health effects. The EC levels in the study area are compliant with the regulatory limits for water quality according to NIS (2007) is 100 mS/m or otherwise 25 mS/m (WHO 2011).
Elevated TDS may not necessarily mean a health hazard but water taste deteriorated with increasing TDS and water with high TDS is less preferred by both humans and wildlife (Selebatso et al., 2018). Furthermore, very high concentration of salts in water will not be helpful for quenching thirst (Sengupta, 2013). Both availability and quality of water have effects on population dynamics (Selebatso et al., 2018). Poor water quality has been observed to reduce reproductive rates and survival rates of animal populations, resulting in potential population declines (Pokras and Kneeland, 2009).
Water Turbidity: The water turbidity was overall highest in the wetlands (2.46 NTU) followed by rivers (0.92 NTU), wells (0.78 NTU) and lowest in dams (0.66 NTU). The highest turbidity was measured in the Bolahla sub-catchment with 4.74 NTU while the lowest was observed in the Mphosong sub-catchment wells (Figure 10). Turbidity describes the amount of light scattered or blocked by suspended particles in a water sample. Therefore, the concentration of turbidity was found to be low in Mphosong sub catchment (Figure 10). The critical threshold value for turbidity is ≤ 5 NTU and this is the
recommended limit for turbidity. The results therefore indicated that the water was clear and fit to drink since the water with high turbidity is not fit to drink simply because, the particles in turbid waters can carry disease-causing pathogens or toxic pollutants (Alaska D.E.C, 2013). Thus turbidity is hazardous because high turbidity in drinking water can shield bacteria or other organisms so that chlorine treatment at water treatment plants cannot disinfect the water effectively. Since turbidity has a positive correlation with temperature ( Salari et
al., 2018), the results on turbidity in the study made sense
because mostly the water resources had low temperatures
except for the hot spring at Ha Botšo in the Mphosong sub
catchment which had high turbidity ( 4.91NTU) because of its high temperatures. The relationship between the temperature and turbidity had a low correlation (R2 = 0.30) in the study area (Figure 11). This therefore means that there was no significant relationship between temperature and turbidity in the study area. These results are consistent with Suzuki et al, (2018) who also observed that the individual effect of turbid water was smaller than the effect of high temperature but the combination of turbid water and high temperature had additive and/or synergistic effects on the biomarkers in S. marmorata. Besides the high temperature, the wetlands in the first sub catchment had 4.74 NTU of turbidity, it seemed to be high in that area due to the location of the wetland, it was found within the settlement. Salari et al. (2018), stated that the suspended solids increase by the discharge of wastes either from the domestic sewage, industrial or agricultural effluents (Salari et al., 2018). Therefore the observed turbidity levels in the
wetlands might be due to some agricultural effluents from kraals and pig sties in the villages.
Base cations
Calcium hardness (Ca): The mean Calcium content in the Mphosong-Bolahla watershed (Figure 12) varies within a narrow range from 44.03 – 44.92 mg l-1 in the streams, dams and wetlands with an observed outlier in the wells measured at 74.28 mg l-1. The wells had higher values while the lowest concentration was recorded in dams. The highest Ca+2loading (56.99 mg l-1) was recorded in Senyokotho sub-catchment and the lowest (49.94 mg l-1) in the Mphosong sub-catchment. Calcium is an alkaline earth metal and exists as a divalent cation and occurs naturally in varying concentrations in most
water bodies and, together with magnesium, is one of the main sources of water hardness property of alkaline water bodies. Soft waters contain low, while hard waters contain high concentrations of calcium. Calcium is an essential element for all living organisms and is an important constituent of the bony skeleton of mammals, which consists of phosphates of calcium (DWA, 1996). According to the SA drinking water standards the critical limits for Ca in the water is from 0-80 mg l-1 (DWA, 1996). The highest calcium concentrations within the study area were recorded in the wells (64.75-83.05 mg l-1) and with the exception of Mphosong well (83.04 mg l-1) all other sub-catchments recorded concentrations within the SA critical range. This variation is caused by the differences in the geology of the area. The area that are dominant with calcite, limestone and gypsum rocks tend to have high calcium concentrations in the water bodies which might have come by weathering of those rocks. In essence, the quality and quantity of chemical elements in surface water can be influenced by land relief, geochemical structure, land use, seasonal variations in weather conditions (precipitation-evaporation), plant cover and atmospheric deposition (Grochowska and Tandyrak 2009). However, Seasonal changes in the water flow rate and biological activity contribute to differences in the chemical composition of surface water (au GusTyn et al., 2012).Low concentrations were observed in the waters of streams, whose catchment areas are partly overgrown by forest (Potasznik et al 2015). The results in Bolahla Mphososng catchment are consistent with our findings since the lowest Ca concentration
was obtained in Ha Botšo. This is because the streams are
normally surrounded by the forests, therefore the forests have high humic acids influx which tend to decrease the calcium content in waters.
Magnesium (Mg): Magnesium concentrations in the watershed were generally low (3.53-7.36 mg l-1) with the lowest readings observed in the streams (3.53 mg l-1) while the highest concentration was recorded in the wells (7.36 mg l-1) (Figure 13). The lowest concentrations occurred in the Mphosong sub-catchment (2.36 ml l-1) and the highest at Ha Senyokotho sub-catchment (7.58 ml l-1). Magnesium in water bodies is normally from the industries dealing with chemical including magnesium oxide, but in the case of the study area there were no industries or factories that deals with chemical containing Mg hence the low concentrations. The high concentrations of magnesium relative to calcium (calcium to magnesium ratio > 1) are typically found in municipal and industrial wastewaters (Pescod, 1992; Kiziloglu et al., 2007) due to magnesium-containing chemicals, such as magnesium oxide used in the tannery industry The concentration were found to be far lower than that of calcium. However, changes in overall water quality as well as in the relative concentrations of magnesium and calcium may occur in water resources over a long period (Qadir et al., 2018). Kazi et al., (2009) found that, among the 16 elements determined in Manchar Lake water except Cu, Cr, Co and Mn, other elements (Na, K, Ca, Mg, Fe, Al, Ni, As, Se, Pb and Cd) have higher values as compared to the permissible level of these elements in drinking water (WHO,2004). Thus they did not comply with results from the study area, the reason might due to inflow of effluent
from industrial, domestic, agricultural and saline seeps into the lake and also resulting from people living in boats andfishing
as averred by Kazi et al. (2008), whereas in our study area there were no visible signs of effluents that would lead to high base cation concentration in water.
Anions
Phosphates: There are no prescribed P standards in either the South African standard or the WASCO. However according to WHO, (2011), the phosphate concentration that is prescribed was 0.01 mg/l. The phosphate concentrations in the catchment vary by type of water source and sub-catchment (Figure 14). The range (2.31 – 3.92 mg l-1) amongst water sources is generally higher than the WHO water drinking standards. The highest concentration was found in rivers and low in wells. The highest P concentrations were observed in the streams and lowest in the wells. The concentration of P were highest in the Senyokotho (3.24 mg l-1) although the lowest (2.87 mg l-1) observation recorded for the Mphosong sub-catchment was still significantly higher than the upper limit of the SA Standards for drinking water. Surface waters and groundwater become contaminated from both natural and anthropogenic. Sources of phosphates. Natural sources of phosphorus in both surface and groundwater include atmospheric deposition, natural decomposition of rocks and minerals, weathering of soluble inorganic materials, decaying biomass, runoff, and sedimentation. Anthropogenic sources include; fertilizers, wastewater and septic system effluent, animal wastes, detergents, industrial discharge, phosphate mining, drinking water treatment, forest fires, synthetic material development surface (Spraill et al., 1998; Sheila, 2005).The highest phosphate concentration was found in rivers across all sub-catchments (Figure 14). Naturally streams are below the cropland and villages, so the high phosphate in this case might be due to fertilizer runoff from the fields and or use of detergents from village and streams because the latter are also used for laundry. The lowest concentration was found at Ha Mahloane dam where the well was cemented so the leaching of non-source pollutants could not reach, only the effluents from runoff could be visible since the well was not covered. Naturally occurring levels of phosphates in surface and ground water bodies are not harmful to human health, animals or the environment, however, extremely high levels of phosphates can cause digestive problems (Sheila, 2005). This might be the case with the water of the study area because in all the water resources, phosphate was found to be higher than the recommended drinking water standards according to SA drinking water standards, 1995. The results in the study area indicate much better water quality that other studies ((Ayandiran et al., 2018) which report much higher P levels ((40.20 to 71.20 mg l-1).
Nitrates: The South African Standards for drinking water have no thresholds for nitrates. However, the Water and Sewage Company of Lesotho (WASCO) thresholds for nitrate in drinking water is categorized as a) Ideal - 0 – 6 mg l-1; b) Acceptable–6–7mg l-1; c) Maximum allowable - 10–20 mg l-1. Nitrates concentration in the study area range from 3.62 mg l-1 in the streams to 7.82 mg l-1 in the wells (Figure 15). The highest reading recorded in the Mphosong sub-catchment wells (12,84mg l-1). Nitrate is also a well-known contaminant of ground and surface waters and, along with phosphate, is often implicated in the eutrophication of lakes and coastal waters (Yang et al., 2018). High amounts of nitrate may be harmful to living species through metabolic and physiological disorders in animals and plants (Singh et al., 2018; Conlin et al 2018). Nitrate in drinking water is primarily a health concern in that it can be readily converted in the gastrointestinal tract to nitrite as a result of bacterial reduction. In the study area the
highest value was recorded at the well at Ha Rantšala which is
located within the settlement and below the croplands of the Mphosong sub-catchment. Other studies (Pulido-Bosch et al., 2000) observed that shallow wells which draw water from intensively cultivated superficial formations, yield waters with high nitrate levels. These results were in inconformity with the results in the study site because the well seemed to be drawing water from the fields above it, hence the higher concentration of nitrates. Other researchers (Soana et al., 2017) also stated that, in permeable soils, excess nitrate from agriculture is transported vertically and accumulates in aquifers. Therefore according to SA drinking water standards the range from 10-20 units has a possibility of methaemoglobinaemia that may occur in infants while the value from 0-6 has no health effects and 6-10 there is a rare methaemoglobinaemia that may occur. The water resources in the catchment fall within the acceptable (0-6 mg l-1) which falls within good drinking water quality standards and would not be expected to pose any health hazards except rare episodes of methaemoglobinaemia in the wetland of the Bolahla sub-catchment (Figure 15). The outlier in the data set occurred in the wells at Mphosong which have spiked the readings with concentrations of nitrate in the maximum allowable range (10-20 mg l-1) posing a high risk of methaemoglobinaemia.
Chemical Oxygen demand (COD): The measurement of COD in the project area (Figure 16) ranged from 1.44-17.11 mg l-1 with the lowest recording (1.44 mg l-1) observed in the wells while the highest was recorded in the streams (17.11 mg l-1). The variability amongst the sub-catchments was high with a minimum (2.08 mg l-1) recorded in the Bolahla sub-catchment and the maximum (13.5 mg l-1) observed at Mphosong sub-catchment. Chemical Oxygen Demand (COD) is a quick, inexpensive means to determine organics in water. The chemical oxygen demand was measured based on the effluents from the wastes, therefore according to the results found, all the water resources in the study were found to have the COD less than critical threshold of 75 mg l-1 set by the WASCO Laboratories as the national standard. The results indicate that the water in the project area was free from waste with the exception of measurements taken in the streams at Mphosong and wetlands at Hlokoa-le-monate in the Senyokotho sub-catchment respectively. In other studies (Ayandiran et al., 2018) the high (148-180.5 mg l-1) COD measurements were obtained. In comparison, the water bodies in the study area have high quality and clean water. The water quality parameters analyzed in the catchment are therefore summarized and compared with the SA drinking water standards (Table 1). Therefore, most water resources in study area were found to be within the range of water quality standards except for pH, phosphates and calcium concentrations which were above the prescribed water quality standards. Also, nitrates had high concentrations in some water resources, a bit higher the recommended rate. For other parameters like phosphate and COD, SA water drinking standards had no recommended rates, as such other water quality regulatory standards were used. For instance phosphate water standards got were compared with WHO, 2011, water quality standards while COD was compared with WASCO regulatory water quality limits in Lesotho.
Conclusion
pollution except for the water quantity which indicated that the quantity had decreased in the whole catchment. The water quality was mostly found to be of low quality in stagnant waters, for instance, most dams were the ones which were highly impacted. On the other hand, wetlands did not show such much pollution, this was indicated by low pH values in wetlands, low concentration of phosphates and nitrates among others. The reason might be that wetlands still functioned well, since one of its functions is to filter water, then it was able to clean its water except for lot of turbidity and high temperatures. This therefore led to low water quality in wetlands as well. Most rivers had low turbidity and low temperature but phosphates concentrations as well as COD seemed to be high. The reason behind the high concentration in rivers might be due to anthropogenic activities like washing near the rivers, this then caused lot of phosphates from the soaps used as well as fertilizer runoff from the fields. Wells also showed high concentration of EC, TDS, Mg and nitrates concentration were found to be high but wells had low turbidity and low phosphates. Dams and ponds showed high pH values and EC. These factors might be due to the sediments build up in the dams especially in Bolahla where the dam had silted out. Therefore, the sediments in the dams bring the pollution to the water whereas the high pH might be from the soaps used for washing clothes next to the ponds. However, the most water resources seemed to be lying between the recommended SA water drinking standards. Few of water resources that were above the prescribed standards did not have any severe health effects to the users. This was also explained by the community people that they had not encountered and health hazards due to water. PH values and Ca concentration did not meet the recommended limits in the whole catchments. They were above the SA water drinking standards. High concentrations might be due to the location of the study area, topography and the climate. The study area was full of limestone and igneous rocks which have high Ca content, hence during weathering of rocks Ca become high in water resources. However, phosphates concentration was meet in some of the resources while other resources especially river had lot of phosphate concentrations. Water quality in the study area was found to be low, in as much as the water in the area lied within SA water drinking standards. However, most of parameters did not show severe health effects. The improvement need to be done in the water resources like the conservation and water treatment since the land users especially at Ha Mahloane depended largely on the natural resources. The water quantity was also found to be low, the water level in most water resources was found to be below the normal as well the depth of water even the water discharge was found to be low. This information on water quantity was triangulated by the key informants, they were able to tell if the water quantity had decreased or not, therefore in our measurements they were able to indicate if they had decreased. Due to lack of baseline information, the key informants in the area who were knowledgeable of the area as well as the water status in the last 10 years which was our reference period became the good source. Thus the water in Bolahla-Mphosong catchment seemed to have degraded.
Recommendation
With the view that we need to conserve water for future generations the study concluded that priority one is catchment management and its implementation. Drastic measures are needed to conserve wetlands, there has to be trainings and
teachings on the important of water usage and management. Most importantly, the study area relied mostly to agriculture, ministry of Agriculture has to make sure that, they pay a visit to the area in order to teach the farmers how to conserve as well as how to improve their produce both for consumption and for commercial purposes because in essence the study side was the prolific producer hence why most farmers were more in to commercial. Therefore people have to be given information on how to commercialize agriculture since commercial agriculture may lead to rapid land degradation. Besides that they have to be taught how to protect biodiversity, by not cutting trees, reduce grass harvesting in the rangelands and anima harvesting especially in the waters, as biodiversity protect the whole ecosystem. When the ecosystem is improved then all the resources in the area as well water environments get conserved. There was also rainfall in the last two weeks prior to undertaking field work in the study area. Therefore, this might have caused anomalies in the water quantity and quality parameters for the season of instant when the study was undertaken thus the results might not be representative of a normal winter season hence this study needs to be replicated at least once every season of the year to normalize the data. I therefore recommend that the same study to be done throughout the year in different seasons in future.
REFERENCES
ARMCANZ and ANZECC, 2000 ARMCANZ, ANZECC Australian and New Zealand Guidelines for Fresh and Marine Water Quality. Volume 2. Aquatic Ecosystems—
Rationale and Background Information
Aslam, R. A., Shrestha, S., and Pandey, V. P. 2018. Groundwater vulnerability to climate change: a review of the assessment methodology. Science of the Total Environment, 612, 853-875
AuGuStyn l.J., kaniuczak Stanek-tarkOwSka j. 2012. Selected physicochemical and chemical properties of surface water of the Wisloka used as potable water. Inz. Ekolog. 26: 7-19. (In Polish)
Ayandiran, T. A., Fawole, O. O., and Dahunsi, S. O. 2018. Water quality assessment of Bitumen polluted Oluwa River, South-Western Nigeria. Water Resources and Industry, 19, 13-24
Azam, M. M. M., Alam, and Hafeez, M. H. 2018. Effect of tourism on environmental pollution: Further evidence from Malaysia, Singapore and Thailand. Journal of Cleaner Production, 190, 330-338
Cardinale, B. J., Duffy, J. E., Gonzalez, A., Hooper, D. U., Perrings, C., Venail, P., and Kinzig, A. P. (2012). Biodiversity loss and its impact on humanity. Nature, 486(7401), 59
Conlin, S. M., Tudor, M. S., Shim, J., Gosse, J. A., Neilson, A., and Hamlin, H. J. (2018). Elevated nitrate alters the metabolic activity of embryonic zebrafish. Environmental Pollution, 235, 180-185
Department of water affairs (DWA) 2012, proposed national water resource strategy 2; managing water for an equitable and sustainable future, SA
Department of Water Affairs and Forestry. (1996), South African Water Quality Guidelines
Ukrainian catchments using eco-hydrological modelling. Water, 9(3), 204.
Ding, J. Y., Jiang, L., Fu, Q., Liu, Peng, Q., and Kang, M. 2015. Impacts of land use on surface water quality in a subtropical River Basin: a case study of the Dongjiang River Basin, Southeastern China. Water, 7(8), 4427-4445 Edition, F. (2011). Guidelines for drinking-water
quality. WHO chronicle, 38(4), 104-8.
El-Zeiny A., 2015. Remote Sensing and GIS for Assessment and Mapping of the Environmental Degradation in the Coastal Region at Damietta-Egypt, Ph.D. Thesis. Damietta Faculty of Science, Damietta University, Egypt
Garda, C. H., Castleden, and Conrad, C. 2017. Monitoring, Restoration, and Source Water Protection: Canadian Community-Based Environmental Organizations’ Efforts
towards Improving Aquatic Ecosystem Health. Water, 9(3), 212.
Genç, O. M., Ardıçlıoğlu, and Ağıralioğlu, N. 2015.
Calculation of mean velocity and discharge using water surface velocity in small streams. Flow Measurement and Instrumentation, 41, 115-120
Genç, O. M., Ardıçlıoğlu, and Ağıralioğlu, N. 2015.
Calculation of mean velocity and discharge using water surface velocity in small streams. Flow Measurement and Instrumentation, 41, 115-120
Grochowska, J., and Tandyrak, R. 2009. The influence of the use of land on the content of calcium, magnesium, iron and manganese in water, exemplified in three lakes in the Olsztyn vicinity. Limnological Review, 9(1), 9-16.
Gwimbi P. 2011. The microbial quality of drinking water in Manonyane community: Maseru District (Lesotho)
Hadizadeh, F. M. S., Allahyari, C. A., Damalas, and Yazdani, M. R. 2018. Integrated management of agricultural water resources among paddy farmers in northern Iran. Agricultural Water Management, 200, 19-26
Hampson, D., Crowther, J., Bateman, I., Kay, D., Posen, P., Stapleton, C., and Tzanopoulos, J. 2010. Predicting microbial pollution concentrations in UK Rivers in response to land use change. Water research, 44(16), 4748-4759
Huang, Y. X., Chen, F., Li, J., Zhang, T., Lei, J., Li, and Wang, X. 2018. Velocity of water flow along saturated loess slopes under erosion effects. Journal of Hydrology, 561, 304-311
Igbinosa E.O. A.I., Okoh 2009. Impact of discharge wastewater effluents on the physico-chemical qualities of a receiving watershed in a typical rural community Int. J. Environ. Sci. Technol., 6 (2009), pp. 175-182, 10.1007/BF03327619
Johannsen, S. S., and Armitage, P. (2010, May). Agricultural practice and the effects of agricultural land-use on water quality. In Freshwater forum (Vol. 28).
Karatayev, M. Z., Kapsalyamova, L., Spankulova, Skakova, A., Movkebayeva, G., and Kongyrbay, A. 2017. Priorities and challenges for a sustainable management of water resources in Kazakhstan. Sustainability of Water Quality and Ecology, 9, 115-135
Kazi, T. G., Arain, M. B., Jamali, M. K., Jalbani, N., Afridi, H. I., Sarfraz, R. A., and Shah, A. Q. 2009. Assessment of water quality of polluted lake using multivariate statistical techniques: A case study. Ecotoxicology and environmental safety, 72(2), 301-309.
Kiziloglu, M. F., Turan, Sahin, U., Angin, I., Anapali, O., and Okuroglu, M. 2007. Effects of wastewater irrigation on soil
and cabbage‐plant (brassica olerecea var. capitate cv.
yalova‐1) chemical properties.Journal of plant nutrition and soil science, 170(1), 166-172
Kumar, M. A., Puri 2012. A review of permissible limits of drinking water, Indian J. Occup. Environ. Med., 16 (2012), pp. 40-44, 10.4103/0019-5278.99696
Lee, E. J., and Schwab, K. J. 2005. Deficiencies in drinking water distribution systems in developing countries. Journal of water and health, 3(2), 109-127
Lesotho Water Partnership (LWP). 2016. National Consultations on Water, Food Security and Nutrition, Lesotho.
Matsipa PH. 2008. A Highlight on Sufficiency Economy Concept in Lesotho. Lesotho Country Report. http://www.eto.ku.ac.th/s-e/ SEgroup2/Country Report/Lesotho.pdf
Mofelehetsi S. 2005. Lack of clean water still a major challenge for Lesotho. International Federation of Red Cross and Red Crescen Societies. http://www.ifrc.org/docs/news/05/ 05042701/ 1
MOHSW and WHO 2002. Lesotho - Health indicators - June 5, 2002. www.who.int/ disasters/repo/7773.doc
Naeem, S. R., Chazdon, J. E., Duffy, C., Prager, and Worm, B. 2016. Biodiversity and human well-being: an essential link for sustainable development. Proc. R. Soc. B, 283(1844), 20162091
Narin, İ., M., Soylak, L., Elçi, and Doğan, M. 2000.
Determination of trace metal ions by AAS in natural water samples after preconcentration of pyrocatechol violet complexes on an activated carbon column. Talanta, 52(6), 1041-1046.
Nazari, B., Liaghat, A., Akbari, M. R., and Keshavarz, M. 2018. Irrigation water management in Iran: Implications for water use efficiency improvement. Agricultural Water Management, 208, 7-18
Ngoma, D. H., and Wang, Y. 2018. Hhaynu micro hydropower scheme: mbulu–tanzania Comparative River Flow Velocity and Discharge Measurement Methods. Flow Measurement and Instrumentation.
NIS (Nigerian Industrial Standard), 2007. Nigerian standard or Drinking Water Quality, NIS 554, ICS 13.060.20, Approved by the Standard Organization of Nigeria (SON) Governing Council, pp. 14–18.
Nkheloane.T. A., Olalaye and Mating.R. 2014. Rainfall variability at decadal time scale and temperature trend in two district Agro ecological Zones of Lesotho, Lesotho Journal of agricultural sciences
Okello, C. B., Tomasello, N., Greggio, N., Wambiji, and Antonellini, M. 2015. Impact of population growth and climate change on the freshwater resources of Lamu Island, Kenya. Water, 7(3), 1264-1290
Panah, M., and Blanchette, F. 2018. Simulating flow over and through porous media with application to erosion of particulate deposits. Computers and Fluids, 166, 9-23 Pescod, M. B. (1992). Wastewater treatment and use in
agriculture
Pimentel, D. B., Berger, Filiberto, D., Newton, M., Wolfe, B., Karabinakis, E., and Nandagopal, S. 2004. Water resources: agricultural and environmental issues. BioScience, 54(10), 909-918
Pokras and Kneeland, 2009. Understanding Lead uptake and effects across species lines: a conservation medicine approach Policy 34: 44-57
Potasznik A. S., Szymczyk .2015. Magnesium and calcium concentrations in the surface water and bottom deposits of a river-lake system. J. Elem., 20(3)
Prest, E. I., Hammes, F., Kötzsch, S., Van Loosdrecht, M. C. M., and Vrouwenvelder, J. S. 2013. Monitoring microbiological changes in drinking water systems using a fast and reproducible flow cytometric method. Water research, 47(19), 7131-7142
Pulido-Bosch AS, Bensi LM, Vallejos JMAC, Pulido-Leboeuf P 2000. Nitrates as indicators of aquifer interconnection. Application to the Campo de Dalia (SE-Spain). Environ. Geol. 39(7)
Qadir, M., Schubert, S., Oster, J. D., Sposito, G., Minhas, P. S., Cheraghi, S. A., and Saqib, M. 2018. High-magnesium waters and soils: Emerging environmental and food security constraints. Science of the Total Environment, 642, 1108-1117
Rostom, N. G., Shalaby, A. A., Issa, Y. M., and Afifi, A. A. 2017. Evaluation of Mariut Lake water quality using Hyperspectral Remote Sensing and laboratory works. The Egyptian Journal of Remote Sensing and Space Science, 20, S39-S48.
Salari, M. E. S., Shahid, S. H., Afzali, M., Ehteshami, G. O., Conti, Derakhshan, Z., and Sheibani, S. N. 2018. Quality assessment and artificial neural networks modeling for characterization of chemical and physical parameters of potable water. Food and Chemical Toxicology, 118, 212-219
Savci, S. 2012. Investigation of effect of chemical fertilizers on environment. Apcbee Procedia, 1, 287-292.
Schreiber, C., A. Rechenburg, E. Rind, and Kistemann, T. 2015. The impact of land use on microbial surface water pollution. International journal of hygiene and environmental health, 218(2), 181-187.
Seifi, M., S. Niazi, G., Johnson, Nodehi, V., and Yunesian, M. 2019. Exposure to ambient air pollution and risk of childhood cancers: A population-based study in Tehran, Iran. Science of the Total Environment, 646, 105-110. Selebatso, M. G., Maude, and Fynn, R. W. 2018. Assessment
of quality of water provided for wildlife in the Central Kalahari Game Reserve, Botswana. Physics and Chemistry of the Earth, Parts A/B/C
Sengupta, P 2013. Potential health impacts of hard water Int. J. Prev. Med., 4 (8) (2013), pp. 866-875
Shamir, E., S. B., Megdal, C., Carrillo, C. L., Castro, H. I., Chang, Chief, K., ... and Prietto, J. 2015. Climate change and water resources management in the Upper Santa Cruz River, Arizona. Journal of Hydrology, 521, 18-33.
Sheila Murphy, 2005 USGS Water Quality Monitoring, available at http://www.water.usgs.gov/nawqa/circ-1136.html
Singh, P. Y. R., Beg, and Nishad, G. R. 2018. A review on spectroscopic methods for determination of nitrite and nitrate in environmental sampleshttps://doi.org/10.1016/ j.talanta.2018.08.028
Skogen, K. H., Helland, and Kaltenborn, B. 2018. Concern about climate change, biodiversity loss, habitat degradation and landscape change: Embedded in different packages of environmental concern? Journal for Nature Conservation. Soana, E. R., Balestrini, F., Vincenzi, M., Bartoli, and
Castaldelli, G. 2017. Mitigation of nitrogen pollution in
vegetated ditches fed by nitrate-rich spring waters. Agriculture, ecosystems and environment, 243, 74-82.
Spraill, T.B. D.A., Harned, P.M. Ruhl, J.L., Eimers, G.,McMahon, K.F.,Smith, D.R.,Galeone, Woodside, M.D. U.S. 1998 Geological Survey Circular 1157; online at URL:http://water.usgs.gov/pubs/circ.1157
Suzuki, J. M., Imamura, D., Nakano, R., Yamamoto, and Fujita, M. 2018. Effects of water turbidity and different temperatures on oxidative stress in caddisfly (Stenopsyche marmorata) larvae. Science of the Total Environment, 630, 1078-1085
UNEP – United Nations Environment Programme 2008. Environment Alert Bulletin: Coastal degradation leaves the Caribbean in troubled waters. www.grid.unep.ch/product/ publication/download/ew_c aribbean_runoffs.en.pdf (last access 18 May 2008).
Van der Hoven, C., E., Ubomba-Jaswa, Van der Merwe, B., Loubser, M., and Abia, A. L. K. 2017. The impact of various land uses on the microbial and physicochemical quality of surface water bodies in developing countries: prioritization of water resources management areas. Environmental Nanotechnology, Monitoring and Management, 8, 280-289 https://www.sciencedirect.com/ science/article/pii/S2215153217301472
Van Vliet MT, WH Franssen, JR Yearsley, F Ludwig, I Haddeland, DP Lettenmaier and Kabat P.2013. Global river discharge and water temperature under climate change. Global Environmental Change. 2013; 23:450–464. doi: 10.1016/j.gloenvcha.2012.11.002.
Verma, S., B.P. Mohanty, K.P. Singh, B.R. Behera and A. Kumar. 2018. Dependence of precipitation of trace elements on pH in standard water. Nuclear Instruments and Methods in Physics Research Section B: Beam Interactions with Materials and Atoms, 420, 18-22
WHO, Background document for the development of W.H.O. guideline for drinking water quality, 2011
World Health Organization and UNICEF 2006. Meeting the MDG drinking water and sanitation target: the urban and rural challenge of the decade. http://www.who.int/ water_sanitation_health/monitoring/ jmpfinal.pdf
Yang, H. G., Wang, L., Wang, and Zheng, B. 2016. Impact of land use changes on water quality in headwaters of the Three Gorges Reservoir. Environmental Science and Pollution Research, 23(12), 11448-11460
Yang, Z., J., Chen, H., Li, H., Jin, S., Gao, Z., Ji, and Bai, Y. 2018. Sources of nitrate in Xiangshan Bay (China), as identified using nitrogen and oxygen isotopes. Estuarine, Coastal and Shelf Science, 207, 109-118.
Żelazny, M. A., Rajwa-Kuligiewicz, Bojarczuk, and Pęksa, Ł.
2018. Water temperature fluctuation patterns in surface waters of the Tatra Mts., Poland. Journal of Hydrology. Zende, A. M. R. A., Patil, and Patil, V. M. 2018. Water
Security Assessment in Semi-arid Region using Geospatial Techniques. Materials Today: Proceedings, 5(1), 620-627.
Zlatanović, L. J. P., Van Der Hoek, and Vreeburg, J. H. G.
2017. An experimental study on the influence of water stagnation and temperature change on water quality in a full-scale domestic drinking water system. Water research, 123, 761-772
7083 International Journal of Current Research, Vol. 11, Issue, 09, pp.7073-7083, September, 2019