ISSN Online: 1945-3124 ISSN Print: 1945-3116
DOI: 10.4236/jsea.2019.127017 Jul. 31, 2019 278 Journal of Software Engineering and Applications
Parameter Prediction of Stretch-Blow Molding
Process of PET Using Neural Networks
Talal H. Alzanki
*, Mutaz M. Jafar
Electronic Engineering Department, College of Technological Studies, Public Authority for Applied Education and Training (PAAET), Shuwaikh, Kuwait
Abstract
This study presents a parameter selection strategy developed for the Stretch-Blow Molding (SBM) process to minimize the weight of preforms used. The method is based on a predictive model developed using Neural Networks. The temperature distribution model of the preform was predicted using a 3-layer NN model with supervised backpropagation learning. In addi-tion, the model was used to predict the uniform air pressure applied inside the preform, taking into account the relationship between the internal air pressure and the volume of the preform. Parameters were validated using in situ tests and measurements performed on several weights and lengths of a 0.330 Liter Polyethylene Terephthalate (PET) bottles. Tests showed that the model adequately predicts both the blowing kinematics, mainly zone temper-atures and blowing and stretching pressures along the walls of the bottle while maintaining the bottle strength and top load requirements. In the second step, the model was combined to automatically compute the lowest preform weight that can be used for a particular 330 ml bottle design provid-ing a uniform wall thickness distribution.
Keywords
Stretch-Blow Molding (SBM) Process, Polyethylene Terephthalate (PET) Bottles, Temperature Distribution Model, Uniform Wall Thickness Distribution
1. Introduction
The two-stage Stretch-Blow Molding (SBM) process is the most popular tech-nique used for the manufacturing of Polyethylene Terephthalate (PET) bottles [1]. This process involves feeding a structurally amorphous semi-product, called preforms, made by injection molding of PET resin granules into the How to cite this paper: Alzanki, T.H. and
Jafar, M.M. (2019) Parameter Prediction of Stretch-Blow Molding Process of PET Us-ing Neural Networks. Journal of Software Engineering and Applications, 12, 278-292. https://doi.org/10.4236/jsea.2019.127017
Received: June 2, 2019 Accepted: July 28, 2019 Published: July 31, 2019
Copyright © 2019 by author(s) and Scientific Research Publishing Inc. This work is licensed under the Creative Commons Attribution International License (CC BY 4.0).
http://creativecommons.org/licenses/by/4.0/
DOI: 10.4236/jsea.2019.127017 279 Journal of Software Engineering and Applications blow-molding machine. A pre-heating step using a set of infrared (IR) emitting lamps conditions the preforms to the appropriate temperature distribution along the walls. In the second stage, the preforms are stretched axially by a cylindrical rod and blown using two levels of air pressure. Then, the bottles are cooled down by a mold whose temperature is regulated using cooling channels. Most bottles blown in this matter require a minimum blow air pressure of 35 bar with 40 bar as a maximum. Compressed air takes up approximately 50% of bottle production energy cost and higher air pressure increases overall bottle cost. Re-cycling high-pressure air for pre-blow pressure is now widely used to reduce energy and cut overall costs.
optimi-DOI: 10.4236/jsea.2019.127017 280 Journal of Software Engineering and Applications zation of the preform design to produce PET bottles with uniform thickness dis-tribution using a blow molding simulation software. The bottle blown up using the new preform design had a better barrier property due to increased molecular orientation. Thibault et al.[13] developed a predictive preform geometry soft-ware and optimal operating conditions for the stretch blow molding process. The numerical approach combined a constrained gradient-based optimization algorithm together with finite difference technique for operating condition op-timization. Venkateswaran et al. [6] investigated the influence of nonuniform temperature distributions on preform sidewalls, in relation to their effects on functional properties of PET bottles. The study demonstrated that the optical anisotropy through the bottle wall thickness is minimal, when the inside surface is at a higher temperature than the outside surface.
Temperature is considered one of the most important variables in SBM. However, its measurement and predictions remain a delicate task, especially in the wall thickness direction. Temperature affects the orientation induced by biaxial stretching, affects mechanical, optical, and barrier properties of bottles. Heating simulation of multilayer preforms, authors took into account the rela-tionship between the scattering coefficient of PET and crystallization rate. Therefore, the simulation of the preform heating cannot be carried out ade-quately without an understanding of the radiative heat transfer properties. Another aspect is the blowing and stretching pressures that could very well determine the full bottle strength. The internal pressure and the enclosed vo-lume of the preform are fully coupled and applying the air pressure directly as a boundary condition could lead to unrealistic results [14] [15] [16]. These models are generally based on thermodynamic equations in order to automat-ically compute the air pressure inside the preform, instead of applying the pressure directly as boundary conditions. Only a few studies have been re-ported on this specific point, and the subject is still opened. The models pro-posed in literature simulate the deformation process, and generally lead to ac-curate predictions of bottle thickness distribution. However, even though ki-nematics of blowing may be the criteria to test the accuracy of results, a lack of heat transfer modeling is also apparent due to high non-linearity and the tem-perature distribution zones through the preform wall thickness. Moreover, heat transfer coefficients are generally estimated without reference to experi-mental measurements. Finally, only a few studies have proposed cost reduction modeling of preform weight, a key to successful operation, and the resulting heating and the blowing parameters.
DOI: 10.4236/jsea.2019.127017 281 Journal of Software Engineering and Applications internal temperature and air pressure and the enclosed parameters of the pre-form. In a second step, we propose an optimization strategy for SBM of the lowest possible weight that can be used for the preform providing a uniform thickness for the bottle. For that, we developed an iterative procedure allowing to automatically compute the best temperature and pressure distribution along the preform length. To validate our approach, numerical and experimental temperature and pressure profiles were compared. Results were validated by careful in situ tests and measurements performed on various weights preforms of 330 ml PET bottles.
2. Characteristics of PET
The properties of the PET polymer are largely dependent upon the average mo-lecular weight, which is usually determined by measurement of the Intrinsic Viscosity (IV). The higher the IV is, the higher the molecular weight is. The range of IVs used in preform injection molding is 0.72 to 0.88 depending on the size of the preform. The degree of crystallinity of the preform is determined by its density measurement. Amorphous PET has a density of 1.335 g/m3, the cal-culated density of perfect PET crystal is 1.455 g/m3 at room temperature [18]. An increase in IV reduces the rate of crystallization making it more difficult for a given chain to separate from other chains and form an ordered crystal [19]. The Natural Stretch (NSR) or draw ratio of a polymer is the ratio of the resulting length (in the direction of applied stress) to its original length. The point at which the PET requires extra force to continue stretching is the NSR for a par-ticular set of stretching conditions. A resin with a low IV has a higher NSR than a high IV resin since polymer chains in a low IV resin are shorter, and therefore, can be easily stretched more. Whereas, in high IV resin, chain entanglement limits the amount of stretching. For this reason, preform designs differ when considering low IV or high IV PET. The NSR is reached when strain hardening occurs on the stress-strain curve for materials. Stretching beyond the yield point results in permanent deformation of the bottle, and further stretching will result in fracture. The design of a PET preform for the optimum orientation is achieved when the stretching of the preform walls meets the mold boundaries. This point occurs beyond the NSR. Proper stretching results in longer shelf life, better top load performance and less gas permeability, for example, higher car-bon dioxide retention for carcar-bonated drinks. Overstretching results in excessive deformation of the bottle. Axial stretch ratio dividing the length of the bottle by the length of the preform as measured from underneath the neck support ring (NSR) to the end of bottle and preform. Hoop stretch ratios can be measured by dividing the average bottle diameter by the corresponding average preform di-ameter. Stretch ratio calculations and typical values are as follows:
(
)
(
)
Hoop Stretch Ratio
Bottle diameter average preform diameter 2
HSR
D OD ID
= + (1.1)
(
)
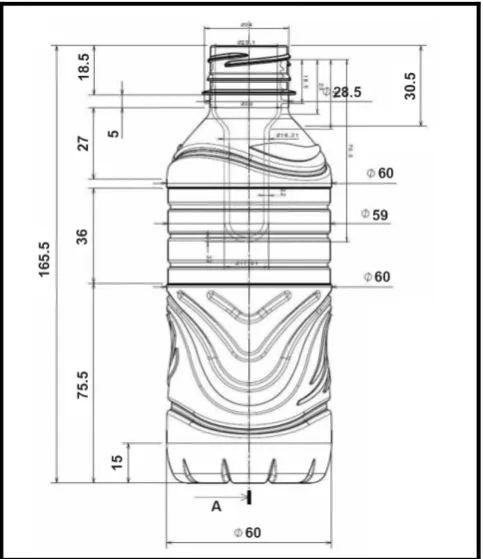
DOI: 10.4236/jsea.2019.127017 282 Journal of Software Engineering and Applications HSR typical Figurers are 3 to 4 whereas ASR are 2.5 to 3 [1]. These values give a more uniform stretch distribution and top load strength to the bottle. Figure 1 shows a combined 12-gram preform and bottle with IV of 0.738 dl/g used in stretching of a 330 ml bottle.
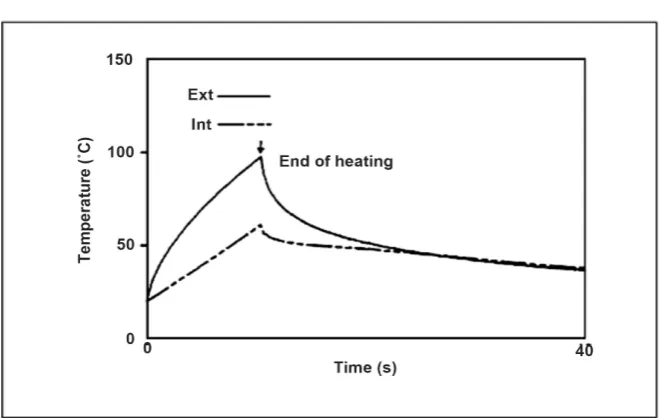
PET has temperature process range from 90˚C - 115˚C which can be adjusted by the oven lamps voltage range of 0 - 220 V (a percentage setting of 0% - 99%). Higher temperatures cause the PET material to crystallize whereas temperatures below 85˚C causes microcracks in the PET structure. Conduction, convection and radiation are all present heat transfer mechanisms in the SBM process. Conduction occurs when two parts touch each other and heat flows from the colder to the warmer part. However, PET is a poor conductor and it is not suita-ble to heat preforms this way. On the other hand, convection is done by heating up of air in the ovens of the blow machine takes place. Air heating is difficult to control and highly dependent on surrounding conditions and furthermore the outside walls of the preform heats up more than the inside as depicted in Figure 2. Radiation occurs when the output of the oven lamps reaches the preforms in the form of waves.
3. Neural Network Architecture
[image:5.595.253.495.413.693.2]Most physical systems have to be modelled separately due to complexity and presence of non-linear characteristics [20] [21]. Neural Networks (NN) have been used in a large number of applications and have proven to be effective in
Figure 1. Bottle 330 ml and preform IV 0.738 dimensions and
DOI: 10.4236/jsea.2019.127017 283 Journal of Software Engineering and Applications
Figure 2. Typical preform temperatures measured on outside and inside walls.
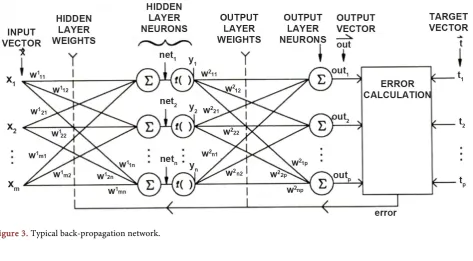
performing complex functions in various fields. These include pattern recogni-tion, classificarecogni-tion, control systems, vision, and predictions [22]. NN accom-plishes these tasks by learning from a series of data sets to the system, then ap-plies what has learned to approximate or predict the corresponding output. The most successful modern network-learning model has been back-propagation. Based on Least Mean Square (LMS) algorithm, the back-propagation method has been widely used to solve a number of applications [23][24][25][26]. Typ-ically, neural networks consist of three layers linked together by a weighted con-nection between neurons of different layers. Figure 3 shows a typical multi-layer neural network structure.
The input layer receives information from the external sources and passes the information to the network for processing. The next layer consists of one or more hidden layers that receive information from the input layer and processes them to other layers within the system. The output layer receives processed in-formation and sends output signals out of the system. Bias connections are off-sets that provide a threshold for the activation of neurons. During learning phase, NN attempts to optimize the connection weights to give best approxima-tion of the parameter in quesapproxima-tion. Once trained, NN can be used on line to esti-mates output parameters of the non-linear system. The node’s internal threshold
k
θ is the magnitude offset that affects the activation of the node output yk as
follows:
(
)
1
n
k p kp k
i
y X W θ
=
=
∑
− (1.3)where Wkp is weight factors associated with each node to determine the strength of input row vector Xp.
DOI: 10.4236/jsea.2019.127017 284 Journal of Software Engineering and Applications
Figure 3. Typical back-propagation network.
( )
11 x
f x
e−
=
+ 0≤ f x
( )
≤1 (1.4)And hyperbolic tangent transfer function of the form:
( )
exx e xxf x
e e
−
−
− =
+ (1.5)
4. Training the Neural Network
The objective of training the network is to adjust the weights with a set of training data. The iterative process is designed to minimize the mean square error between the actual and desired output. Typically, new inputs will lead to outputs close to the desired output for input vectors used in training that are similar to the new input being presented. This property makes it possible to train a network on a representative set of input-output target pairs and get good results without training the network on all possible input/output pairs. A trained multi-layer perceptron can perform non-linear input-output mapping. In Least-Mean-Square (LMS) algorithm training method, it is based on estimates of the auto-correlation function r i jx
( )
, and estimate of the cross-correlation function r i jdx( )
, . These estimators are used to update the weight parameter(
1)
k
W n + in the steepest decent method calculations, the output function of the
neuron is computed as:
( )
( )
1
n
k i
i
y n w n x
=
=
∑
(1.6)DOI: 10.4236/jsea.2019.127017 285 Journal of Software Engineering and Applications designed to minimize the LMS error E defined by:
(
)
2k k
n d y
Ε =
∑
− (1.7)where dk and yk are the desired and actual outputs respectively. Basic steps in-volved in this procedure are the following:
Step 1: The weights and offsets of different layers are initialized to small ran-dom values within the interval [−1, 1].
Step 2: The input is presented andoutput of the first layer is calculated. The input can have a new value for each iteration, or it can be sampled from a train-ing set.
Step 3: The actual output is calculated using the non-linear activation func-tion.
Step 4: The weights are adapted and adjusted by the following equation,
(
1)
( )
(
( )
(
1)
)
ij ij i ij ij
W t+ =W t +ηδjX +α W t W t− − (1.8)
where δj is the error term for node j, η is the gain term, and α is the momentum term. The momentum coefficient provides faster convergence and is usually set at a value in the interval of [0, 1]. This allows the network to respond to recent trends in the error gradient and therefore, the network will not get stuck in local minimum. The error reached by this local minimum does not represent the best set of weights. A too high momentum coefficient can cause instability, and will result in oscillation across the global minimum [27][28][29]. The learning rate setting is crucial in training, too small or too high values may lead to instabil-ity.
5. Model Development and Optimization—Backpropagation
Throughout the back-propagation simulation presented, the network was initia-lized based on the technique described by Nguyen and Widrow [29] [30]. To determine the number of layers and the corresponding number of hidden neu-rons M, the criterion used issmallest number of neurons that yield a minimum RMS error with the least number of iterations. The values of the learning rate η and momentum coefficient α were arbitrary set at small values. The network was simulated on 800 training data set for various numbers of hidden neurons in each layer. Table 1 and Table 2 summarize the results of the simulation for var-ious numbers of hidden neurons.The second run resulted in a considerable drop in the number of cycles. The third run did not significantly contribute to the MSE. Accordingly, the number of hidden neurons was held at 3 for the first layer, and 3 for the second layer.
6. Cross-Validation Analysis
DOI: 10.4236/jsea.2019.127017 286 Journal of Software Engineering and Applications
Table 1. Summary of Simulation Results for determination of number of hidden neurons.
Run Number 1stNeurons Layer 2nd Layer Neurons of Epochs Number Mean-Squared Error (MSE)
1 2 3 1135 0.030
2 3 3 1375 0.023
3 5 4 1323 0.024
[image:9.595.206.541.212.281.2]Learning rate parameter η = 0.7 and momentum coefficient α = 0.8
Table 2. Optimal configuration of back-propagation network.
Optimal Parameter Value
Number of Hidden Neurons 6
Learning Rate η 0.7
Momentum Coefficient α 0.8
occur when too many parameters are selected, while under-fitting can occur when few parameters are used. The particular model, which gives the best per-formance, is then trained on the full training data set and generalization is then tested on the verification set. Cross-validation can give essential information that can help in network parameter selection such as size of training set and value of learning rate. The available data is partitioned to two sets, training and test set. The training set is further partitioned into two sets: training and validation. The network is then simulated with the selected training data set. Results of the cross-validation curves are shown in Figure 4.
The results, in general, are satisfactory since the test and validation errors have similar characteristics. No over- or under-fitting is visible and therefore, we conclude that the training set and parameters chosen are adequate.
7. Simulation Results
Based on plant experience we included 9 input variables in the training of the SBM networks. The following L2 and L∞ norms error criteria were used for comparison and error analysis.
max max
T Ann T
ε∞
−
= (1.9)
(
)
( )
2
2 2
n
n
T Ann
T
ε
−
=
∑
∑
(1.10)DOI: 10.4236/jsea.2019.127017 287 Journal of Software Engineering and Applications
Figure 4. LMS and corresponding validation curves for selected values of learning rate.
bottle, the system has a capacity of 28,000 bottles per hour (bph). Preforms used throughout the study were 30/25 neck finish clear with IV 0.747 dl/gram and has residual Acetaldehyde (AA) content of 0.670 ppm. The beating zones were po-wered by six-zone IR tungsten lamps. The compressed air for stretch blow molding was powered by 40 bar Ateliers François compressor. The plant was operated and tested over a six-month period for the study, with data collection sampled every hour during the operation. In this example, 7 input variables were used in the input vector.
8. Predictions
DOI: 10.4236/jsea.2019.127017 288 Journal of Software Engineering and Applications
Figure 5. Input variables relative importance.
[image:11.595.208.537.221.460.2]Figure 6. Training network used.
[image:11.595.208.537.491.719.2]DOI: 10.4236/jsea.2019.127017 289 Journal of Software Engineering and Applications
Figure 8. Actual vs. estimated predicted blowing.
Figure 9. Actual vs. estimated predicted temperature (˚C) for selected zone 3.
9. Conclusion
[image:12.595.207.538.265.453.2]DOI: 10.4236/jsea.2019.127017 290 Journal of Software Engineering and Applications would account for the relationship between the temperature and the material orientation and crystallization. As for SBM optimization, we proposed a prac-tical methodology to numerically optimize a lower weight of a PET preform for a particular 0.330 ml size bottle, while providing a uniform thickness alongside the bottle walls. Encouraging prediction results have shown the viability of NN approach. However, it would probably be more desirable to have the outer wall IR heat temperature, along with the inside wall, measured and used as an input for the NN model. But to do so, major blower modifications will have to be car-ried out. Nevertheless, this approach would implicitly account for the influence of the temperature and pressure distributions through the preform weight, thickness, length, and stretch ratios.
NN can be very effective in predicting non-linear behavior problems asso-ciated with operational variables of SBM process. NN algorithms achieved an overall good generalization for predictions of blowing kinematics, mainly blowing pressure and zone temperatures. The prediction of the last zone tem-perature resulted in overall lower accuracy due to the fact of the high non-linearity of hot air distribution between inner and outer preform walls and dependence on other factors such as distance, wall thickness, stretching ratios and inner- and outer-diameters.
Acknowledgments
Financial support of the Public Authority for Applied Education and Training (PAAET), Kuwait during this research is greatly appreciated.
Conflicts of Interest
The authors declare no conflicts of interest regarding the publication of this pa-per.
References
[1] Brandau, O. (2012) Stretch Blow Molding. Elsevier, Cambridge, MA.
[2] Luersen, M.A. and Le Riche, R. (2002) Globalized Nelder-Mead Method for Engi-neering Optimization. Proceedings of the Third International Conference on Engi-neering Computational Technology, Stirling, Scotland, 165.
[3] Michaeli, W. and Papst, W. (2004) FE-Analysis of the Two-Step Stretch Blow Molding Process. SPE ANTEC Technical Papers 30, Chicago, IL.
[4] Champin, C., Bellet, M., Schmidt, F.M., Agassant, J.-F. and Le Maoult, Y. (2005) 3D Finite Element Modeling of the Blow Molding Process. 8th ESAFORM Conference on Material Forming, Cluj-Napoca, Romania, 905-908.
[5] Bordival, M., Schmidt, F.M., Le Maoult, Y. and Velay, V. (2009) Optimization of Preform Temperature Distribution for the Stretch-Blow Molding of PET Bottles: Infrared Heating and Blowing Modeling. Polymer Engineering and Science, 49, 783-793. https://doi.org/10.1002/pen.21296
DOI: 10.4236/jsea.2019.127017 291 Journal of Software Engineering and Applications 237-249.
https://doi.org/10.1002/(SICI)1098-2329(199823)17:3<237::AID-ADV4>3.3.CO;2-P [7] Martin, L., Stracovsky, D., Laroche, D., Bardetti, A., Ben Yedder, R. and DiRaddo,
R. (1999) Modeling and Experimental Validation of the Stretch Blow Molding of PET. SPE ANTEC Technical Papers, New York.
[8] Bordival, M., Schmidt, F.M. and Le Maoult, Y. (2006) Numerical Modeling and Op-timization of Infrared Heating System for the Blow Molding Process. 9th ESAFORM Conference on Material Forming, Glasgow, April 2006, 511-514. [9] Pham, X.T., Thibault, F. and Lim, L.T. (2004) Modeling and Simulation of Stretch
Blow Molding of Polyethylene Terephthalate. Polymer Engineering and Science, 44, 1460-1472.https://doi.org/10.1002/pen.20142
[10] Yang, Z.J., Harkin-Jones, E., Armstrong, C.G. and Menary, G.H. (1996) Finite Ele-ment Modelling of Stretch-Blow Molding of PET Bottles Using Buckley Model: Plant Tests and Effects of Process Conditions and Material Parameters. Proceedings of the Institution of Mechanical Engineers Part E: Journal of Process Mechanical Engineering, 218, 237-250.https://doi.org/10.1243/0954408042466990
[11] Bagherzadeh, S., Biglari, F.R. and Nikbin, K. (2010) Parameter Study of Stretch-Blow Moulding Process of Polyethylene Terephthalate Bottles Using Finite Element Simulation. Proceedings of the Institution of Mechanical Engineers Part B: Journal of Engineering Manufacture, 224, 1217-1227.
https://doi.org/10.1243/09544054JEM1853
[12] Chettiar, D., Masood, S.H. and Erbulut, D.U. (2008) Optimization of a PET Preform Design for Better Bottle Barrier Properties. Proceedings of ANTEC Society of Plas-tic Engineers, 4, 1947-1951.
[13] Thibault, F., Malo, A., Lanctot, B. and Diraddo, R. (2007) Preform Shape and Oper-ating Condition Optimization for the Stretch Blow Molding Process. Polymer En-gineering and Science, 47, 289-301.https://doi.org/10.1002/pen.20707
[14] Menary, G. (2001) Modeling of Injection Stretch Blow Molding and the Resulting in-Service Performance of PET Bottles. Ph.D. Thesis, Queen’s University of Belfast, Belfast.
[15] Bonnebat, C., Roullet, G. and de Vries, A.J. (2004) Biaxially Oriented Polyethylene Terephthalate Bottles: Effects of Resin Molecular Weight on Stretching Behavior. Polymer Engineering & Science, 21, 189-195.
https://doi.org/10.1002/pen.760210403
[16] Attaway, S. (2002) MATLAB: A Practical Introduction to Programming and Prob-lem.
[17] Neural Planner Software (2011) Neural Planner Software Ltd., Version 3. [18] Modest, M. (1993) Radiative Heat Transfer, McGraw-Hill, New York.
[19] Incropera, F.P. (1985) Fundamentals of Heat and Mass Transfer. Wiley, New York, 546.
[20] Zilouchian, A. and Bawazeer, K. (1997) Prediction of Products Quality of a Crude Fractionation Section of an Oil Refinery Using Neural Networks. Proceedings of International Conference on Neural Networks, Houston, TX, 12-12 June 1997, 157-162.
[21] Haykin, S. (1994) Neural Networks: A Comprehensive Foundation. Macmillan Col-lege Publishing, London.
DOI: 10.4236/jsea.2019.127017 292 Journal of Software Engineering and Applications https://doi.org/10.1109/5.58323
[23] Rumelhart, D.E., Hinton, G.E. and Williarns, R.J. (1986) Learning Internal Repre-sentations by Error Propagation. The MIT Press, Cambridge, MA.
[24] Wasserman, P.D. (1993) Advanced Methods in Neural Computing. Van Nostrand Reinhold,New York.
[25] Zilouchian, A. and Hamano, F. (1997) Recent Trends and Industrial Applications of Intelligent Control Systems Using Artificial Neural Networks and Fuzzy Logic. In: Tzafestas S.G., Ed., Methods and Applications of Intelligent Controls, Kluwer Aca-demic Publishers,Dordrecht. https://doi.org/10.1007/978-94-011-5498-7_3
[26] Luo, Z. (1991) On the Convergence of the LMS Algorithm with Adaptive Learning Rate for Linear Feed-Forward Networks. Neural Computation, 3, 226-245.
https://doi.org/10.1162/neco.1991.3.2.226
[27] Moody, J. and Darken, C. (1989) Fast Learning in Networks of Locally-Tuned Processing Units. Neural Computation, 1, 281-294.
https://doi.org/10.1162/neco.1989.1.2.281
[28] Hagan, M.T. and Menhaj, M. (1994) Training Feed-Forward Networks with the Marquardt Algorithm. IEEE Transactions on Neural Networks, 5, 989-993.
https://doi.org/10.1109/72.329697
[29] Nguyen, D. and Widrow, B. (1990) Improving the Learning Speed of 2-Layer Neur-al Networks by Choosing InitiNeur-al VNeur-alues of the Adaptive Weights. Proceedings of the International Joint Conference on Neural Networks, 3, 21-26.