STUDIES OF MAGNETIC MICROPULSATIONS
WITH SPECIAL REFERENCE TO
DISCRETE EMISSIONS IN THE VICINITY OF ONE CYCLE PER SECOND
VOLUME I
A Thesis presented for the
degree of Doctor of Philosophy.
University of Canterbury
1965
ABSTI:U\.C'J1
The work on magnetic micropulsations described in this
thesis falls into two parts. The first part considers micropulsations associated with meteoric phenomena, a high-altitude thermo-nuclear explosion, and man-made
el~ctromagnetic interference.
In the study on the association of micropulsations with
meteors, both the effects of hourly meteor rates and individual meteor occurrences on micropulsation activity in the
1.5
cps band recorded at the same site1 are considered. It i.s found that the variation in hourly meteor rates, plotted through a succession of nights, is not significantly related to thecorresponding micropulsation activity. Most individual meteors do not have any associated micropulsation activity, but the number of coincidences is greater than random, and it remains possible that some of the larger meteors do produce magnetic
effects.
Observations of the magnetic disturbance produced by the
July
9,
1962
thermo-nuclear explosion above Johnston Island aredescribed and the characteristic oscillation periods are
interpreted.
In
the second part ofthe
thesis,the
developmentof
recording and data analysis instrumentation, suitable for observing
the
frequency-time properties of signals in the Pc1band (0.2 -
5
cps), is described and the characteristics of eight months of recorded data are interpreted in order to gain insight into the origin of the discrete Pc1 emissions generally known as pearl-type micropulsations or hydromagnetic emissions .•Special attention is given to the design of a galvanometer-photocell p.reamplifier and it is shown that the frequency response
of a standard laboratory galvanometer may be extended, by the application of feedback, to cover a considerable portion of the
i i .
The fine structure properties of hydromagnetic emissions are found to be in qualitative agreement with recently suggested theories for emission propagation by hydromagnetic ion cyclotron wave packets in the magnetosphere. Significant diurnal variations in hydromagnetic emission fine structure parameters are established, and it is shown that these are not associated with the daytime
attenuation of hydromagnetic waves in the :ionosphere, but with the emission source in the magnetosphere. The diurnal variations indicate that the emission source is located near the L=4 field
line between 03 - 06 hr
L'r,
and near thEi L::::6.5
field line between12 - 15 hr LT.
The diurn~l movement in the emission source position provides a simple explanation fo~ the variation in hydromagnetic emission diurnal occurrence with latitude, and is also consistent with the variation in average emissionfrequency with latitude. It is suggested that the diurnal
movement in the source position may result from the magnetospheric convection of low energy trapped particles.
A preliminary analysis of the effects of geomagnetic activity on hydrornagnetic em:L.ssions shows that the average night time location of the emission source is in the vicinity of the L=5 field line on extremely quiet days, and the
L=3.7
field line on moderatelyThe writer would like to acknowledge the continual advice and suggestions of Professor G.D. Ellyett. He
would also like to thank those who assisted in the
TABLE OF CONTENT'S
ABSTRACT
ACKNOWLEDGEMEJ\f~P.S
LI.ST OF TABLES I. INTRODUCTION
PART JL MAGJ\TETI C EF'FI<:CTS E'ROM ME~PEORS, NU CLEAR DETON A.1.rION AND MI\J\l-MADE INT'ERF'J:GRENCE.
II. 'l'HE CORRELATION OF METEORS WI'l'H MICROPULSATIONS 2.1 Introduction
2.2 Micropulsation Equipment 2.3 Radar-Meteor Equipment
2.4 Correlation of Diurnal Variations
2 4.1 All-sky Meteor Aerials
2. 4. 2 Yagi Aerials giving Locali:;;:.ed Meteor Rate,s 2.5 Correlation of Magnetic Effects with Individual
Meteors 2.
6
Discus.:;ionIII. MAGNE~1IC DISTURBANCE l?ROM 'I'HE ~fULY 9 ~ '1962
HIGI-:I-ALTITUDE NUCiiEAR EXP.LOi'HON Introdiic tion
Observations
Discucision
IV. MAN-MADE ELECTROMAGNETIC INTERFEIIJBNCE
iv.
i i i i
ix 1
5
7
9
10 10 1 'I ·12·15
19
19
20 214 1 Introduction 23
4.2 Background Noise at 1.5 cps.
4.3 Interference from a D.C. Electric Train System
4.4 Conclusion
PART B. DISCRETE EMISSIONS IN THE VICINTrY OF ONE CYCLE PER SECOND
v.
THE DESIGN OF RECOIWING IN,SU?Ul'lfEN'rATIOJ\T5.1
Introduction5.2
Sensitivity Requirements5.3
The Detector Coil5.4 The
Galvanometer-Photocell Amplifier 5.4.1 Transfer Function5.4.2
PracticaJ Design Considerations5 5
Slow-Speed Magnetic Tape Recording .5 6 ,c;ummary24
25
26
26
2'7
') () L .. ~ /30
30
VI.
nrn
POH'l'ABLE m~COIUJING SYE!TEM 6.'I General6.2
Calibration6.3
OperationVII. THIG DA'l'A ANALYSIS SY.STEM
7.1
Introductiom7.2 Analysis Method
7.3
Data Channel Specifications7.3.1.
Sonagraph7.3.3.
Calibration7.3.4.
Tape Speed Variations'?. 4
TimingVIII .Pc1 GEOMAGNETIC MICJ:IOPULSA'I'IONS
8.1
Introduction8.2 Uydromagnetic Emissions
8.2.1. Amplitude-Time Characteristics 8.2.2. li'requency-·Tim,3 Characteristic13
39
40 40 42 4243
4446
46
48
48
49
49
49
8. 3
Diurnal Variations in Hydromagnetic Emitrnioru3 508. 4
Spatia1 Va:ciatio1us in llydromae;net:Lc EmurnJ.oru::3 .'.)'18.5
Additional Hydromagnetic EmissJon Pro~~rtie53
8.5.1.
Ionosp~eric Attenuation8.5.2
Polarization8. 6
Hydromagnetic Emic;sion:s and other GeophysicalPhe non1e na
54
8.7
Storm-Time Pc1 Emissions~55
8. 8
Sur<tmoJ::'yIX. EXCITA'.rION AND PROPAGArrION Oli' lIYDl?OMAGNE':I'IC EMISSIONS 9.1 Introduction
9.2 Hydromagnetic Wave Propagation in the Magnetosphere 60
9.2.1. General Dispersion Relations
60
9.2.2.
Ion Cyclotron Waves62
JC ra
9.4
Attenuation Processes9.4.1 Non-collision Thermal Damping 9.4.2. Ionospheric Attenuation
9.5
SummaryGENERAL PROPERTIES OF
Pc1EMISSIONS
vi.
68
68
69
69
71
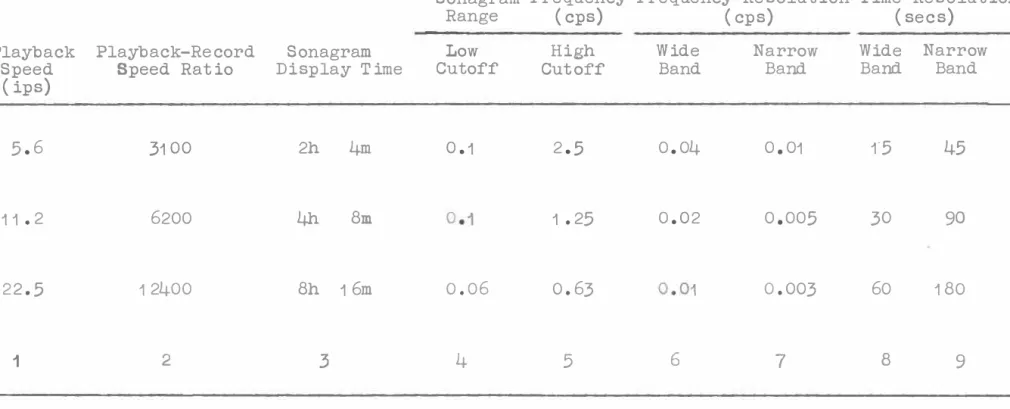
10.1 Introduction 71
10.2 Method of Analysis 71
10.2.'I. Data Reduction 71
10.2.2. Errors
73
10.3 Frequency-Time Characteristics of Hydromagnetic
Emissions
74
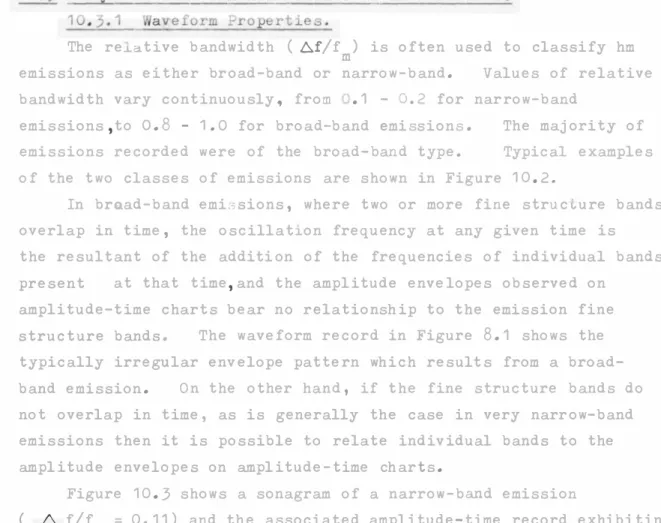
10.3.1. Waveform Properties
74
10.3.2. Fine Structure Properties
75
10.4 Relationship between hydromagnetic EmissionMidband Period and Fine Structure Band Spacing
77
10.5 Relationship between Hydromagnetic Emission FineStructwne Band Spacing and Band Slope
78
10.6 Hydromagnetic Emission occurrence and GeomagneticActivity.
79
10.7 Simultaneous Observations of Hydromagnetic Emi:..1E.ions
at Widely Spaced Stations 80
10.8 Frequency-Time Characteristics of Storm-Time Pc1 Emissions
1
o. 8.1.
Na:r:roW·,,band Emissions10.8.2. Broad-band Emissions 10.9 Summary
81
81
XI. DIURNAL VARIATIONS IN HYDROMAGNETIC EMISSIONS 11.1 Introduction
82
83
84
84
84
85
85
87
88
11.2 Occurrence Rates11.
3
Emi,ssion Parameters11.3.1. Midband Frequency
11.3.2., Fine Structure Ba,:nd Spacing 11.4 Frequency Spectra
11.5 Daytime Hydromagnetic Emissions 11.5.1. Emission Characteristics
11.
5. 2.
Emis,sion. E'requency and IonosphericAttenuation 90
XII. GEOMAGNETIC DIS'I'URBANCE AND HYDROMAGNETIC EMISSIONS
92
12.1 Introduction 92
12.2 Selection of Data 92
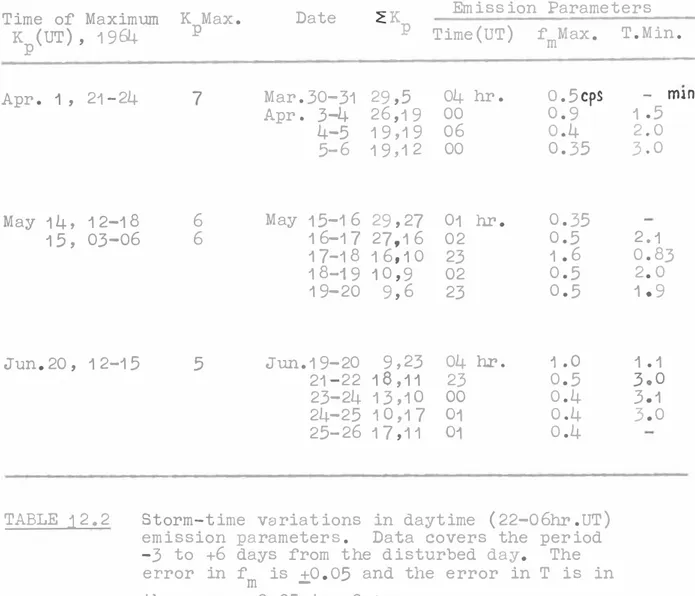
12.3 Storm-Time Variations in Emission Parameters
93
12.3.1.
Nighttime Emissions93
12.3.2.
Daytime Emissions 9412.1 Emission Parameters and Daily Magnetic Activity
97
12.5
Summary98
XIII .DISCUSSIONS
99
13.1 Fine Structure Properties 100
13.2
Diurnal Variations102
13.2.1. Emis,:don Parameters
13.2.2. Emission Source Location 13.2.3. EmisGion Occurrence
13.2.4.
Energetic Particle Distributions13.3 Storm-Time Variations XIV. CONCLUDION,S AND RECOMMENDATIONS APPENDICIES
I. TRANSFER FUNCTION APPROXIMATIONS II. PORTABLE RECORDING ],;QUIPivifmT
2.1 Detector Coil
2.2 Galvanometer-Photocell Amplifier 2.
3
Tape Amplifier2.4 Bias
Oscillator2.5 Slow-speed Tape Deck
2.6
Timing System2.7
Calibration Oscillator2.8
Power SupplyIII. DArrA ANALYSIS EQUIPMENT 3.1 Equalization Amplifier
3.2 Audio Frequency Amplifier
102 104 107 109 110 113 11? 'i 18 118 1 '18
3.3
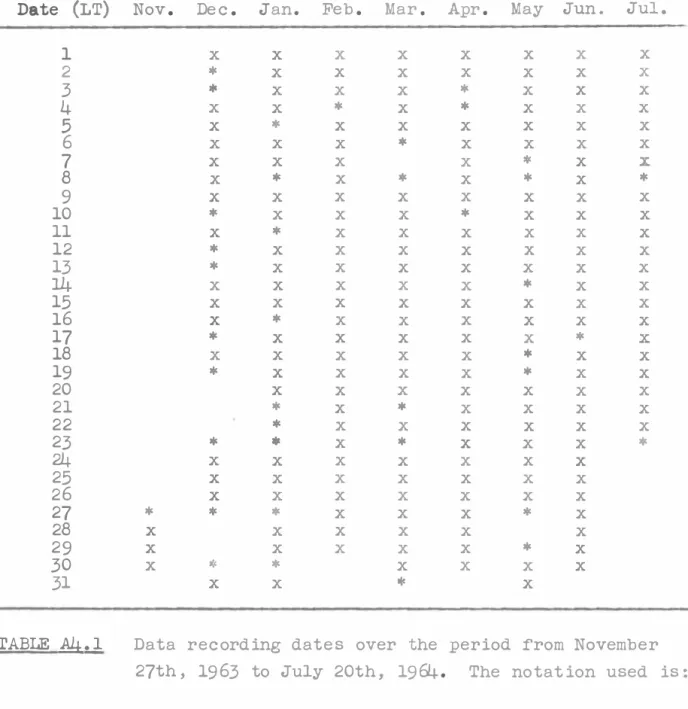
Pulse Amplifier3.4 Pulse Counter IV. DATA RECORDING PETUODS
REF'ERENCES
viii.
'!22
123 124
2.1 Correlation of individual meteors with individual micropulsations
2. 2 Number of small and large meteor echoes with accompanying micropulsations
3,'I Characteristic• phases of the J'uly 9, 1962 nuclear
7.1
10.1
10.2
11 1 'i 2. 1
1 ') ") c.. c.
13.1
A:4.1
explosion
Specifications of the data analysis equipment Errors of measurement in frequency and time
from
sonagramsFine structure details for the emission event
of April, 4, 1964.
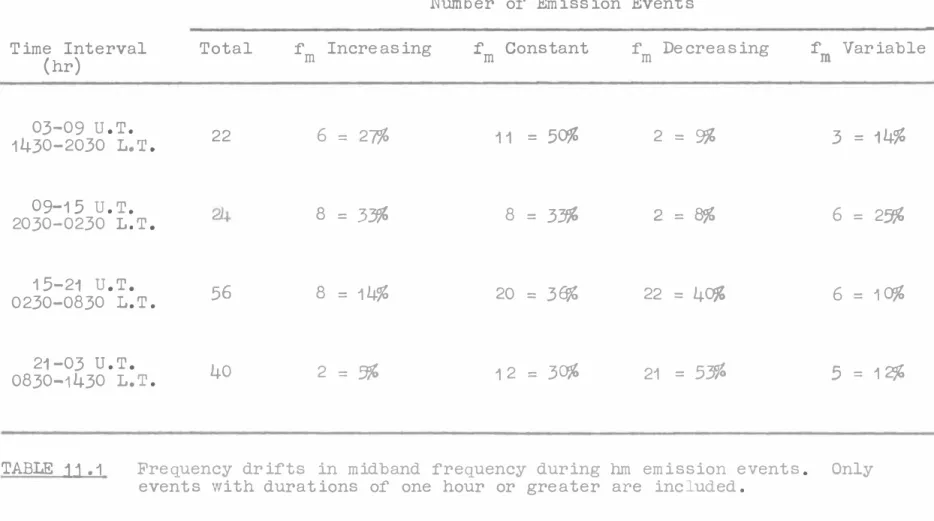
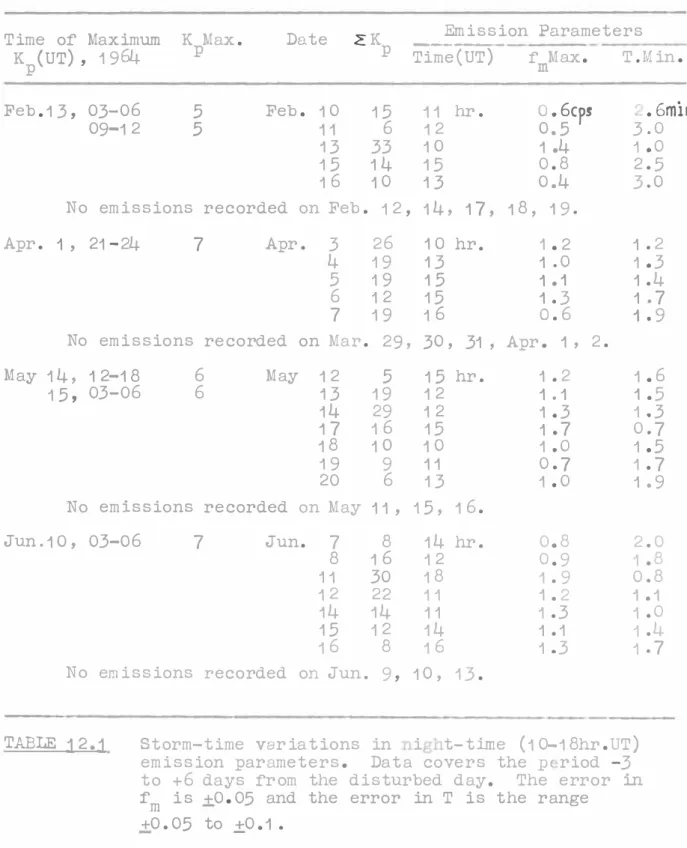
Frequency drifts within hm emission events Storm-time variations in nighttime hm emission para.meters
Storm-time variations in daytime hm emission parameters
Times of diurnal peak occurrence of hm emission activity at fifteen stations
Data recording dates.
14
16
19
45
74
79
86
95
96
106
CHAPTER I
IN'l~RODU CTI ON
The existence of rapid variations in the geomagnetic field of the earth was first recognized by Balfour Stewart in the second half of the nineteenth century. However, it is only during the last decade, especially since the begin~ing of the International Geophysical Year, that considerable attention has been devoted to the properties and origin of these fluctuations. Although
the theoretical interpretation of geomagnetic micropulsations is still in a primitive state it is generally believ~that they represent hydromagnetic waves, excited in the magnetosphere, propagated through
the
magnetosphereat
hydromagnetic velocities, and converted at the lower ionospheric boundary into electromagnetic fluctuations whichthen propagate
through the neutral loweratmosphere.
Geomagnetic micropulsati.on amplitudes range from a fraction of a gamma,to, on rare occasions, as much as a few tens of gammas
(1
gamma o::10-
9
Wb/m
2
)
whilethe
periods of oscillation extend from 0.1sec to 10 min~At the beginning of the I.G.Y. micropulsations were classified by the International Association of Geomagnetism and Aeronomy into three broad categories; Pc continuous regular pulsations, Pt -damped trains of pulsations of short duration, and Pg - giant long
period pulsations of infrequent occurrence. The results of I.G.Y. and later systematic micropulsation studies revealed the deficiency of this broad classification, and provided the basis of a new
classification system which has recently been adopted by the IAGA
Regular and Continuous Micropulsations (Pc)
Pc1
period range
0.2
- 5 sec
Pc2
5 - 10 sec
Pc3
10 - 45 sec
Pc4
Pc5
Irregular Micropulsations (Pi)
45
-
150 sec
150 -600 sec
Pi1
period range
1 - 40 sec
Pi2
40
-150
sec
This thesis is principally concerned
with
the properties of
micropulsations in the Pc1 band
.
In addition to the generation of micropulsations in the
magnetosphere
,
it has been suggested that minor contributions
to certain classes of micropulsations may result from
magnetic
effects produced in the ionosphere by the influx of meteoric
material.
It is on the premises of this suggestion
,
and the
confusing nature of previous experimental work on the subject,
that micropulsation studies were undertaken in conjunction
with
the radio meteor research programme at the Physics Department's
Radio Research Station at Rolleston.
Apparatus for recording
the time rate of change of the vertical component of the
geomagnetic field was constructed by Eppstein (1960) and an
initial study on the association of meteor occurrence
with
micropulsation activity was conducted by Gillion (1961)
.
The
results of this study (Ellyett and Gillion, 1963) were inconclusi
ve,
and in 1962 the apparatus was modified and a second and more
extensive study was undertaken by the writer
.
The results of
this
workare presented in Chapter
II.
3.
Following the completion of the meteor-micropulsation study
the decision was made to undertake an experimental study on
geomagnetic micropulsations in the Pc1 band. At this time little
was known about the properties of these
sign
al
s,
and primary
interest lay in the investigation of temporal frequency drifts in
the distinctive class of quasi-sinusoidal oscillations in the Pc1
band generally known as pearls (PP) or hydromagnetic emissions.
This study constitutes Part B of the thesis
.
In order to carry
out an experiment of this type it was necessary to redesign the
recording equipnent.
Also
,
problems with man-made noise during
the daytime precluded continuous observations on Pc1 micropulsations
at the sensitivites required with the available recording
equipment (Chapter IV)
.
These problems were resolved by employing
a completely portable transistorized recording system
,
which,if
necessary, could operate at an electrically quiet site far from
man-made noise
.
The design criteria and general principles of
operation of this system are considered in Chapters V and VI.
The analysis of Pc1 data in the frequency domain is most conveniently
carried out using spectrographic analysis techniques of the type
pioneered by Duffus et al (1958).
Details of a similar data
analysis system constructed for the present study and
employinga
Sonagraph Spectrum Analyser are given in Chapter
VII.
ChaptersVIII and IX are of a
reviewnature, providing
background information and
establishinga
frameworkinto
whichis fitted the analyses described in later chapters.
In Chapter
VIII some of the more important properties of signals occurring in
the Pc1 category are reviewed with particular emphasis being placed
on the characteristics of hydromagnetic emissions.
In Chapter IX
a summary is given of recent theoretical ideas, many as yet
The results of analyses performed on eight months of Pc1
data recorded on the portable micropulsation recording
system
are presented in ChaptersX, XI and XII.
In Chapter X, on the
general properties of Pc1 micropulsations, details of the
reduction of data from spectrograms are presented together
with
observations on the frequency-time characteristics of
hydromagnetic emissions and other types of emissions identified
in the Pc1 Dand.
In Chapter XI the diurnal variations in
hydromagnetic emission occurrence and frequency are considered,
and the emission frequency spectra determined.
In addition,
characteristics of
daytime
hydromagnetic emissions are considered.
Finally, Chapter XII is concerned
with
the effects of magnetic
disturbance on the properties of hydromagnetic emissions.
PART A
MAGNETIC EFFECTS
FROM
METEORS,
NUCLEAR DETONATION
t 'N,v" ,�1�v nF CA��fl,Bl'lt
CH PTER II
THE CORREL TION OF METEORS WITH MICROPULSATIONS
The
workconducted on the correlation of meteors
withmicropulsations has recently been published (Ellyett and Fraser,
1963 ) and is presented in this chapter in its published form
witha few minor alterations and additions.
2.1
INTRODUCTION
Meteors entering the lower ionosphere create relatively
intense transient trails of ionization
whencompared
withthe
background electron concentration.
Either the distortion of the
normal ionospheric current system, or the subsequent movement of
the trail
,
willcreate associated magnetic field changes
.
Various
authors
,
particularly in the last decade, have endeavoured to find
magnetic micropulsation effects at the earth's surface associated
with meteor input to the upper atmosphere
.
There is still a
widedivergence of opinion as to the reality of the effect.
In
some reports the gross effect only of a shOllllet' of meteors has
been looked for.
In most other studies,
meteor data used have
been obtained by different workers at earlier times and other
places,
and these make poor starting material for correlation
studies
withcurrently obtained magnetic fluctuations. The
present work overcomes this defect by observing the two effects
simultaneously
.
b.
Bumba (1955) considered that the magnetic K index increased
significantly with the passage of large meteor showers and then
decreased below normal three days later
.
Attempting to verify Kalashnikov's results, Hawkins (1959 )
used three mutually perpendicular coils connected to amplifiers
with a frequency response of 0.5 to 10 cps and a maximum
sensitivity of 3 m�.
No correlations of individual meteors
with
magnetic pulses
were
found other than those that might be
expected
randomly.His work, however, included frequencies
that could be attributed to thunderstorm activity, and Campbell
(1960) criticized it on these grounds
.
showers was not examined.
Correlation
with
meteor
Jenkins et al. (1960) ,
with
a somewhat increased maximum
sensitivity of 0. 3 mt, claimed an enhancement of nighttime
micropulsation activity in the 1.5 cps band on several nights
of meteor shower activity.
More recently, Campbell reported
increased micropulsation activity in the
0.03
to
0.2
cps range
,
with flux density increases lying between 20 and 320 m
0
during
the� Aquarid, � Aquarid
,
and Perseid meteor showers of 1958
.
Again only nighttime data were used.
The first preliminary result with the present equipment,
but with only 1/6 the subsequent sensitivity
,
was obtained by
Ellyett and Gillion (1963) during a single 24-hour period on
July 29
,
1961, when the� Aquarid shower was active, giving
2750 radar echoes.
No correlation was obtained, either
with
selected latge amplitude meteors or on a i-minute
time
basis.
Experimental work already carried out thus gives no evidence
of a magnetic effect due to a single meteor,
with
the possible
exception of the first worker, Kalashnikov.
The correlation to date with showers also lacks conviction,
both on the data actually put forward, and on the fact that both
Jenkins et al. and Campbell compare micropulsation activity
with
7.
If there is such a co
rre
la
t
ion
,
one implication might be that
showers cause a large total rate increase over the background.
Observations at high
r
a
te
s
,
however,show that showers cause a
relatively insignificant increase in the general rate (Ellyett
and K
e
ay
,
1956; Whipple and Hawkins
,
1959)
.
Also the hourly
meteor rate measurements usually apply at the observing station
only
,
and, to be
meantagful
1must be converted to incident meteor
flux on the eart
h
'
s atmosphere
(Keayand Ellyett, 196
1
)
.
Moreover, if any correlation does exist,
it should also be
found between micropulsations and the diurnal meteor var
i
ation,
where rate changes are as large as those produced by a meteor
shower.
After a brief description of the apparatus involved, a
comparison is given between radar-meteor rates at the Rolleston
field sta
t
ion
,
fifteen miles from Christchurch (geographic
coordinates 43
°37'S,
172
°24
'
E
;
geomagnetic coordinates 48
.
2
°s,
0253
.
5 E) and micropulsations in the
1.
5 cps band at the same sit
e.
Both all-sky meteor rates and meteor rates observed in the
vicinity of the magnetic field line of the earth which is
incident on the micropulsation loop are considered.
This is
followed by an investigation of the magnetic effect of single
meteors.
2
.
2 MICROPULS TION EQUIPMENT
A block diagram of the recording equipment is
shownin
Figure 2.1.
Micropulsations of the vertical component of the
earth's magnetic field induced a voltage in a two-turn horizontal
loop 100 meters in diameter,
withan effective area of 1
.
59 x 10
4m
2•
This loop was buried in the ground and fed to a galvanometer
8.
bandwidth from 1. 0 to 5. 0 cps and a semi•logarithmic amplitude
response was used to eliminate the
lowerm.icropulsation frequencies
and provide an extended amplitude response over a range of 34db.
This also presented a limited output to a following 1. 5 cps filter
amplifier, removing the possibility of oscillation in the filter
caused by large-amplitude lower-frequency micropulsations.
The filter amplifier had a bandwidth of 0.3 cps centred on
1. 5 cps, and hence had a
risetime of about 3 sec.
This
frequency was chosen to agree
with
that used by Jen.kins et al.
when they found a correlation
with
night meteor showers.
For
studying the magnetic effects of individual meteors, a sharper
rise time of about 1 sec was desired, and so the bandwidth was
increased to 1 cps.
The frequency response curves of the various
components of the apparatus are shown in Figure
2.
2
.
Maximum sensitivity was aimed for, as any detectable effect
would almost certainly be small.
Full-scale deflection on the
chart of the pen recorder, which moved at 0.
75
mm/sec, was only
2 my; the
mimimum
detectable signal was
0
.
05 m(.
Because of
the very high sensitivity of the present apparatus, the readings
often reached full scale, but this was of no consequence as only
the time occurrence or absence of micropulsations was under
consideration.
Time marks were recorded o� the chart at
1-minute intervals, and once daily a constant amplitude calibration
signal,
sweepingfrom 0. 5 to 3 cps, was applied.
This signal
checked both the frequency response and the amplitude calibration
of the filter amplifier.
In addition,
the output of the
Pulses of 81 -kw pe ak power and
26-
µ
s pulse width were
radiated at 69.
5
Mc/s
witha pulse repetition rate of 150/sec .
Separated
,
crossed , folde d dipole s for the transmitter and
re ceiver , giving all-sky
viewing ,were used in the first part of
the work. Echoes were recorded from an intensity-modulated
cathode ray tube on a continuously moving 35-mm film. A
detaile d de scription of the meteor equipment and operation is
given by Ellyett and Ke ay ( 1 963 )
.
Meteors were re corded down
to a zenithal magnitude of +8
.
2 (Keay
,
1 963 ) .
In the second part of the work the all -sky
viewingaerials
were replaced by five-element Yagi aerials pointing in the dire ction
o f magnetic nor th at an elevation angle o f 65
°.
This is the
elevation angle of a point at a ve rtic al height of 95 km lying
on the magnetic line of force passing through Christ church .
The measured horizontal beamwidth betwee n half-power points
0was 55 .
The ve rtical beamwidth
w
i
ll be slightly greater
(Fishenden and Wiblin , 1 949)
.
With these aerials the minimum
de tectable zenithal meteor magnitude was incre ase d to
+10
.
8
.
The meteor detection equip�ent operated at the main field
station and the mic ropulsation equipment was situated at an
electrically quie t site 1 mile beyond the main stat
i
on
.
In the
final part o f the work, whe n the magnetic effect of individual
meteors was being considered
,
timing requirements demanded that
the meteor echo pulse s be placed on the same chart as the 1
.
5
cps
mic
ropu
l
sations
.
The meteor re cei
ver
,
with its Yagi aerial , was
1
0.
eliminating both slowly varying background noise (McLauchlan,
1960) and pulse-type interference (
Ellyett
and Keay,
1963).
It
was hoped that these features,
combined with the low noise
site,
would lead to a reasonably true count rate.
The paper chart recording system was tested by operating
it at the meteor site alongside the normal film recording system
for one night
.
In the period shown in Figure
2
.
3
,
1 784 meteors
were recorded on the film
,
and 1 704 on the ch
ar
t,
witha correlation
coefficient of 0
.
95
.
(A period of noise caused the chart to
give some false meteors.
)
When the receiver was operated at the micropulsation site
,
tuning difficulties caused the recorded meteor rate to decrease
by a factor of about 2
.
This was not serious
,
however
,
as all
large-amplitude or long-duration meteors were still being recorded.
2
.
4 CORRELATION 0
2
.
4.
1
Most meteors in the magnitude range being observed move in
short-period orbits of low inclination to the plane of the
ecliptic.
Consequently , orbit interception by the earth will
show helion and antihelion maxima at around 10 hr and 02 hr
L T
,
respectively
.
A third
,
often smaller maximum arises at 06 hr
L
T
,
when the part of the earth containing the observing station is
moving toward the apex of the earth 's way and hence intercepting
meteors.
A diurnal minimum occurs 1 2 hours later,
at 18 hr LT,
when meteors, to be recorded, must catch up with the earth as it
moves alo�g its orbit (Ellyett and Keay,
1
963).
The mean hourly all-sky meteor rates for the period March
5 - 16
,
1962
,
are shown in Figure
2.
4
.
This is a typical
omnidirectional rate curve at Christchurch
,
showing the helion
At this stage
,
owingto the possible occurrence of man-made
micropulsations in the daytime
,
it was decided to restrict
correlation studies to the night hours , between 19 hr and 07 hr LT.
Micropulsation activity at 1. 5 cps was recorded as either being
present or absent in the level about 0
.
05
mt
in each � min.
Figure 2
.
5 shows the antihelion peak in averaged meteor activity
and the corresponding averaged micropulsation occurrence
.
Clearly
there is no positive corr
e
liion
,
as is shown by a negative
correlation coefficient of -0. 64.
On no single night in the
interval was any increase observed corresponding to the constantly
present antihelion rate peak.
The minor peak in the micropulsation curve at 01 hr is due
to a magnetic disturbance (local K
=
4) which occurred on March 6.
This was the only occasion during the whole period when the local
K index rose above 3.
The meteor rate for each hour
wasplotted through the
succession of nights March 10 - 15 and in general showed a steady
and consistent decrease at all hours.
No similar trend appeared
in the corresponding curves of micropulsation activity.
2
.
4
.
2
Yagi erials giving Localized Meteor Rates :
A meteor producing a plasma of ions and electrons in its
wake does not constitute an electric current.
Any gross current
effects are likely to be produced only by the subsequent movement
of the trail as a whole
,
or by the disturbance of normal
12
.
possible
r
ange
,
and at the same time covering those meteors that
have any likelihood of sho
w
ing a fiel
d-
al
i
gn
e
d magnetic change due
to partial subsequent motion of the trail electrons around the
earth
'
s field line .
The mean ob served diurnal meteor rate curve for the period
March 23 through April 6
,
1962
,
is given in Figure
2
.
6
;
as
e
xpected
,
it has a markedly different di stribution from that of
the omnidirectional
arr
ay
,
the helion and antihelion peaks being
displaced later in time
owing
to the north-directed aerial
.
The night period only is again compared with micropulsation
occurrence in Figure 2
.
7
.
The meteor activity decreases to a
minimum at 04 hr and i s not followed by the micropulsation
curve,
which has an earlier minimum near 01 hr.
The correlation
coefficient is
0
.
39
.
The individual nightly curves again showed
the independence of the two phenomena
,
as seen in the three
selected hours given in Figure
2
.
8
.
Because of the tilt of the earth
'
s axi
s
,
a north-directed
aerial
will show
a marked seasonal change in the diurnal
distribution of meteors
.
If there i s any connection
with
micropulsations,
these should also show a seasonal change in
act
i
vity
.
Further micropulsation results were therefore obtained
in the periods September 1 4 through October 6 and October 9
through November 6 (Figure
2
.
9
)
.
The curves show a pattern similar
to that in Figure 2
.
7 obtained six months
e
arlier
.
2
.
5
CORREL TION 0
Correlation was recorded as positive if a micropulsation
occurred within !2 sec of the occurrence of a meteo
r
.
This
criterion for the simultaneity of meteor echo and micropulsation
occurrence automatically double s the coincidence probability since
the causality requirement that the meteor precedes the
phenomena presented side by side on the same paper chart, as shown
in Figure 2.
10
.
A micropulsation peak was counted as a discrete
event if its amplitude exceeded 0. 05 mt •
Observations were taken
continuously between 1900 hr and 0659 hr LT each night during a
weekin May.
The results are set out in the first four columns of Table
2
.
1.
The event occurrence rate for the two phenomena,
within the
limits chosen, was of equal order, micropulsations
beingsomewhat
the higher.
Clearly most of the recorded meteors produce no
corresponding micropulsations.
If a = the total number of meteors in any
givennight, b =
the total number of micropulsations in the same night, and n =
the total number of 4-sec time intervals, then, if both meteors
and micropulsations are distributed randomly among the n time
intervals, the probability P that x meteors occur in the b
timeintervals is given by
p =
(1 - -)
b a -
n
XThis distribution gives a calculated mean = ab/n ; the resulting
values are given in the fifth column of Table
1
.
The sixth
column gives the standard deviation S about the calculated mean ,
obtained from
s
= a b n ( 1 - - ) bn
1/2
The final column shows to what extent the excess of observed
coincidences over calculated exceeds the standard deviation. Two
nights
showno excess.
Including these, the average excess is
threetimes the standard deviation.
The significance of this
Date,
No
.
of'
May 1 962
Mete ors ,
a
21 -22
371
22-23
401
23
-
24
41 6
24-25
328
25-26
331
26-27
309
27
-
28
300
Algebraic average
TABLE 1 :
Calculated
No
.
of'
Mete ors
with
No
.
of'
Observed No
.
of'
C orresponding
Ob served to
Micro-
Met eors
with
Micropulsati on
Calculated
pulsati on
Corresponding
If' Both Are
Standard
Standard
Peaks
,
b
Mi cropulsati on
Random , ab/n
Deviati on ,
s
Deviati on
240
23
8
.
2
±2
.
8
5
.
3
488
31
1 8 .1
+
-4
.
0
3
.
2
695
36
26
.
8
+
-
5
-
4
1
•
7
376
37
1 1
.
4
+
-
3
.
6
7
.
1
848
25
26
.
0
+
-
5
.
2
-0
.
2
620
40
1
7
-
7
!4
.
4
5 .1
2
6
.
4
+
-1
.
4
951
1 9
-5
-
3
s. o
1957 )
,
and no such correlation has been found.
If this result
be accepted
,
then correlation among the lengths of time intervals
between micropulsation peaks does not affect the argument.
In
any case, there is no evidence to suggest that such peaks possess
any time relationship.
The sum of the local 3-hourly K indices of magnetic activity
was zero throughout the whole of the first six
nig
hts
,
indicating
no appreciable magnetic ac
t
i
v
ity
.
The 12-hour period on the final
night gave an integrated K value of 1 1
.
This was the only
night on which appreciably fewer meteors were observed than would
be expected on chance coincidence
.
Magnetic disturbance does not
therefore appear to be a factor causing an increase in correlation.
As Table 2.
1 shows some slight evidence of a relationship
between the two phenomena, it was decided to separate the meteors
into those with echoes saturating the amplitude scale and those
lying between half and full scale ( smaller echoes were not counted)
.
The results (Table 2.2 ) show quite generally that large meteors
are accompanied almost
twic eas often as small meteors by a
simultaneous magnetic micropulsation.
2
.
6 DISCU SI0N
From the evidence given above, correlation between meteors
and micropulsation activity in the 1
.
5
cps band is clearly
infrequent.
If some meteors do produce an effect at the earth's
surface
,
the vertical component of the magnetic effect, as seen
from a typical section of record in Figure
2
.
10
is seldom larger
than
0
.
1
m t·
No
.
of
Date,
Mic ropulsati on No
.
of Large
May 1 962
Peaks
Meteors
21
-
22
240
243
22
-
23
488
294
23-24
695
299
24-25
376
223
25-26
848
21 6
26
-27
620
1 97
27
-
28
951
1 91
Average
Observed No
.
of Large Meteors
with C orresponding
N
o
.
of Small
Micropulsati on
Meteors
20
=8
.
2%
1 28
24
=8
.
2%
1 07
32
=1 o
.
7%
1 1 7
28
=1 2
.
6%
1 05
1 8
=8
.
3%
1 1 5
34
=1 7
-
3%
1 1 2
1 8
=9
-
4%
1 09
1 o
.
7%
Observed No
.
of Small Meteors
with C orresponding
Micropulsation
3
=2
.
3%
7
=6
.
5%
4
=3
.
8%
9
=8
.
6%
7
=6 .
1 %
6
=5
-4%
1
=0
.
9%
4
.
8%
pulses of this magnitude do occasionally showan associated me
t
eo
r
,
but any basic theory cannot as yet be regarded as established by
this result
.
Work carried out by Jenkins et
al
.
( 1960) showed that the
enhanced micropulsation activity in the 1
.
5
cps band at the peak
of the Geminid
,
Draconid
,
0rionid , and Ursid showers predominated
on the N-S
c
omponent
.
In the first place
,
this result is
sur-prising as the last two showers have very low rates.
There was
a lesser effect on the E-W component and only a slight increase in
the vertical component
.
As the present observations were made
on the vertical component , there could be some doubt as to
whether the meteor effects would be observed on this component
.
Jenkins ' results might be further questioned, however
,
as the six
meteor showers they consider occur ,
with
the exception of the
Draconids
,
in the early morning hours , which is also the time of
maximum occurrence of pearl-type Pc1 micropulsations at middle
latitude stations
( Be
nioff
,
1
9
6
0
)
.
Furthermore
,
additional
details of this work (Mason et al
. ,
1961) indicate that the 1
.
5 cps
micropulsation signals consisted of quasi-sinusoidal wavetr
ains
.
This again is a characteristic property of pearls and it is not clear
whether these have been excluded
.
Pearls can last up to an hour
or more (Jacobs and Jolley
,
1962)
,
can correlate with polar-cap
absorption ( Tepley
,
1961)
,
can be a worldwide effect
,
and are
clearly in no way connected with
meteors
.
Such pearls were observed
during the current observations on March 13 between 01 hr and 04 hr LT
,
and again on March 15 - 16 between 23 hr and 06 hr
LT
.
During these
Roura the meteor rates were normal
.
Such pearls were excluded
from the present
analysi
s.
The low percentage correlation between micropulsation spikes
and individual meteors as compared
with
up to a 35 per cent
18
.
which would include a much higher time occurrence of micropulsations,
and also possibly the lower-frequency edge of lightning effects.
The final result of the present work cannot be entirely
conolusive.
It is found that most meteors do not produce
detectable micropulsations, even with a higher limit to the
sensitivity in the present instance than has been used by o
thers
.
However, more correlations do occur than would be expected on a
random basis
,
and the correlation is higher for meteor trails
givinga larger echo amplitude.
If the matter is to be pursued further,
it
will
be desirable to investigate the characteristics of the
individual meteor echo and the frequency coverage of the accompanying
micropulsation to see if there is any particular characteristic
that can be associated with a correlation.
The frequency of 1.5 cps
was chosen for the present work to make the results strictly
CH PTER I I
MAGNETIC DISTURB NCE FROM THE JULY 9
,
1 962
.
HI H
-
ALTITUDE NUCLE
REXPLOSION
3
,
1 INTRODUCTION
On July 9 , 1 962 , at 0900 hr OOmin 09sec , the United States
Atomic Energy Commission detonated a high altitude thermonuclear
device above Johnston Island (geomagnetic coordinates 1 4
.
3
°N
,
2
56
.
5
°E)
.
The height of the explosion was 400 km and the yield
approximately 1
.
4
me
gatons
.
At this time the micropulsation recording equipment described
in section 2
.
2
was in operation to detect any magnetic effects
resulting from the explosion.
Data recorded on the broad-band
channel
wi tha bandwidth of 0
.
008
-
1
.
6 cps were of primary
importance.
Full-scale pe ak-to-peak deflection on the chart
corresponded to a change in magnetic flux density of 0.5 r/sec
and the minimum detectable signal was 0
.
0
15 0
/
sec
.
A chart
speed of 0. 75 mm/sec was used and the resulting time re
s
olut
i
on
,
limited by the thickness of the pen trace
,
was
0
.
3 sec
.
No great effects from the explosion were expected at
Christchurch
,
since the magnetic disturbances associated with the
1958 Teak and Orange explosions were not detected in New Zealand
20
.
3
.2
A preliminary description of the observed magnetic disturbance
has been
givenby Fraser (1962). More recently the data have
been reanalysed (March, 1963) and it is the results of this
reanalysis that are included
here .The original chart record is shown in Figure
3
.
1.
In order
to interpret this record the response of the galvanometer amplifier
to large impulsive signals must be considered. For signals with
amplitudes greater than 0
.
95 t/sec . the galvanometer light spot
moved completely off the photocells and the chart indicated a
zero
reading.
Each time the polarity of the input signal
reversed, and the light spot deflected across the photocells
,
a
pair of positive and negative spikes appeared on the record. From
the sequence of these spikes it was possible to reconstruct the
record shown in Figure 3.2 •
Off-scale peak-to-peak signal
amplitudes between 0.5
t
/sec and 0.95 0 /sec and greater than
0
.
95 t/sec are also indicated
.
Beaause of slight uncertainties
in timing,
it is possible to state only that the first effects of
the explosion were recorded at 0900 ·hr 00 min 09!5 sec.
First indication on the record was a small negative impulse
with an extremely fast rise time and an amplitude of 0.05 0 /sec.
It should be noted that the small irregular fluctuations commencing
6 sec prior to the bomb disturhance were caused by local man-made
interference. The initial impulse was followed
0
.
5!0
.
3
sec later
by five cycles of off-scale fluctuations having periods between
2 and 5 sec , and lasting until 30 sec after onset.
The amplitude s
of fluctuations within this time interval were greater than
0
.
95
1(
/sec
between
O. 5 and 19 sec and in the range O
.
5
-
O
.
95
0
sec
between 19 and 30 sec. For the next three minutes fluctuations
with periods of 20
-
40 sec and amplitudes greater than O
.
95
t
/sec
were evident.
After 3.5 min three cycles of long period
back to normal 10 min after detonation
.
The features of the
disturbance described above are summarized in Table 3. 1.
Phase
Time Interval
Period
Amplitude
(A)
( secs . )
(secs. )
c 0 /sec.)
1
0
-
0
.
5-0
+.
3
Impulse
0
.
05
19
2
-
5
>
0
.
95
2
{ 0 . 5 -19
-
30
2-5
. 5< A <
0
.
95
3
30
-
210
20
-40
>
•
95
4
210
- 600
100-140
0
.
3
T BLE
3.
1
Characteristic phases of the July 9 nuclear explosion.
Time is taken from initial onset
.
3
.
3 DISCUSSION
From consideration of the predominant oscillation periods
given in Table 3.1
,
it is convenient to divide the disturbance into
four phases and consider possible physical mechanisms which may
explain the characteristic oscillation periods within each phase
.
Before any mechanism can be suggested for the first two
phases
,
it is necessary to establish a more exact onset time for
the disturbance .
This can be achieved by considering other
micropulsation and earth current data recorded in New Ze
al
and
.
Christoffel (1962) estimates the arrival time of the main magnetic
+
disturbance at H
+0. 6-
0
.
2
sec, while Poletti and Gadsden (1965 )
timed it at H +
0
.
5
sec.
These times correspond to the commencement
+