COMPARATIVE STUDY OF WATER QUALITY OF BURIGANGA AND BALU RIVER,
*1
Md. Abdul Mottalib,
1Sobug Roy,
1
Institute of Leather Engineering and Technology, University of Dhaka, Dhaka
2
Designated Reference Institute for Chemical Measurement, BCSIR, Dhaka, Bangladesh
3Department of Analytical Chemistry &
(TICI), Polash, Narsingdi
ARTICLE INFO ABSTRACT
A study was conducted on physico selected area of Buriganga and Balu
such as pH, electric conductivity (EC), biochemical oxygen demand (BOD), chemical oxygen demand (COD) and six heavy metals like Fe, Zn, Cd, Cr, Hg and Pb were investigated to assess water qualit of these rivers on April
7.64, 1096 mg/L, and 204.8
metals in water samples were determined by Atomic Absorption Spectrophotometer (AAS). The amount of Fe, Zn, Cd, Cr, Hg, and Pb in Buriganga and Balu River were 0.47
ppm; 0.47
0.62-2.23 ppb, 1.44
revealed that the COD, BOD and heavy metal concentration of both the river water were higher than Bangladesh s
physico
is more polluted than Balu River.
Copyright©2017, Md. Abdul Mottalib et al. This is an open access article distributed under the Creative Commons Att use, distribution, and reproduction in any medium, provided the original work is properly cited.
INTRODUCTION
Dhaka is the most populated city in Bangladesh and there are different kinds of industry established around the Dhaka city. Two important rivers, Buriganga and Balu River across the Dhaka city. Buriganga River flows through west and south of Dhaka which is one of the largest rivers in Bangladesh [Ahmed
et al., 2001]. Buriganga, the lifeline of Dhaka city is a source
of water used by the city residents for bathing, drinking, irrigation and industrial purposes. The river is significantly polluted by industrial effluents, solid wastes, urban sewage from human activities. There were about 200 tanneries in Hazaribagh area on the bank of Buriganga River which discharged 21,600 square meter effluents into this ri
(Kamal et al., 1999). These effluents containing chromium, aluminum, sulphur, lead, salts and other chemicals were polluting Buriganga River severely. These effluents carry some toxic chemicals such as epoxy, polyurethane, enamel, ductile silvery white metal, organic and inorganic acids, alkalis, lime,
*Corresponding author: Md. Abdul Mottalib,
Institute of Leather Engineering and Technology, University of Dhaka, Dhaka 1209, Bangladesh.
ISSN: 0975-833X
Article History:
Received 25th July, 2017 Received in revised form 09th August, 2017
Accepted 29th September, 2017
Published online 31st October, 2017
Available online at http://www.journal
Citation: Md. Abdul Mottalib, Sobug Roy, Md. Shakil Ahmed, Mala Khan and A. N. M. Al
Buriganga and Balu river, Dhaka, Bangladesh”, International Journal of Current Research
Key words: Heavy metals, COD, BOD, Electric conductivity, Effluents.
RESEARCH ARTICLE
COMPARATIVE STUDY OF WATER QUALITY OF BURIGANGA AND BALU RIVER,
DHAKA, BANGLADESH
Sobug Roy,
1Md. Shakil Ahmed,
2Mala Khan and
Engineering and Technology, University of Dhaka, Dhaka
Designated Reference Institute for Chemical Measurement, BCSIR, Dhaka, Bangladesh
Department of Analytical Chemistry & Environmental Science, Training Institute for Chemical Industries
(TICI), Polash, Narsingdi-1611, Bangladesh
ABSTRACT
A study was conducted on physico-chemical parameters and heavy metal contents of water from the selected area of Buriganga and Balu River of Dhaka, Bangladesh. Four physico
such as pH, electric conductivity (EC), biochemical oxygen demand (BOD), chemical oxygen demand (COD) and six heavy metals like Fe, Zn, Cd, Cr, Hg and Pb were investigated to assess water qualit of these rivers on April-May, 2016. The pH, EC, BOD, COD of Buriganga River were found 7.57 7.64, 1096-1117 μS/cm, 109-163 mg/L, 185-381 mg/L whereas 7.58
mg/L, and 204.8-307.2 mg/L respectively found in Balu river water. Th
metals in water samples were determined by Atomic Absorption Spectrophotometer (AAS). The amount of Fe, Zn, Cd, Cr, Hg, and Pb in Buriganga and Balu River were 0.47
ppm; 0.47-0.90 ppm, 0.47-0.83 ppm; 0.959-8.003 ppb, 0.563-1.296 ppb; 270
2.23 ppb, 1.44-2.34 ppb and 22.1-60.6 ppb, 7.5-38.1 ppb respectively. The obtained results revealed that the COD, BOD and heavy metal concentration of both the river water were higher than Bangladesh standard where as pH and EC values were within the permissible limit. The measured physico-chemical properties and heavy metal concentration of study area shows that Buriganga River is more polluted than Balu River.
is an open access article distributed under the Creative Commons Attribution License, which use, distribution, and reproduction in any medium, provided the original work is properly cited.
Dhaka is the most populated city in Bangladesh and there are different kinds of industry established around the Dhaka city. Two important rivers, Buriganga and Balu River across the River flows through west and south of Dhaka which is one of the largest rivers in Bangladesh [Ahmed
., 2001]. Buriganga, the lifeline of Dhaka city is a source of water used by the city residents for bathing, drinking, ses. The river is significantly polluted by industrial effluents, solid wastes, urban sewage from human activities. There were about 200 tanneries in Hazaribagh area on the bank of Buriganga River which discharged 21,600 square meter effluents into this river daily These effluents containing chromium, aluminum, sulphur, lead, salts and other chemicals were River severely. These effluents carry some toxic chemicals such as epoxy, polyurethane, enamel, ductile-silvery white metal, organic and inorganic acids, alkalis, lime,
hnology, University of Dhaka,
Dhaka-caustic soda, aluminum, zinc chromate, zinc phosphate, asbestos etc. This river also receives effluents of many textile, dyeing, battery manufacturing industries from Turag River. Turag River polluted by industrial effluents from Tongi area towards downstream and it meets with Buriganga River at Gabtoli bridge area. Industries such as tanneries, dyeing, textile, battery producers, steel plants responsible to pollute Buriganga River (Kamal et al., 1999;
Halim et al., 2011). The disposal of untreated waste water of various industries, urban wastes and agrochemical wastes in the low land, open water bodies and rivers has reached an alarming situation in Bangladesh which is increasin
day (Islam et al., 2015, Ali et al.,
and Al-Razee et al., 2016). Another important river of Dhaka city is Balu River which is a tributary of
Balu River is one of the important water resources in Dhaka district. This river is used for industrial, domestic, residential and various purposes. Many textile, dying, battery manufacturing industry etc. discharge their effluents onto the river and have a significant impact on surface water quality. About 10% of industries discharge treated effluent and the rest of the industries discharge effluent in the rivers or water body
International Journal of Current Research Vol. 9, Issue, 10, pp.59132-59137, October, 2017 Available online at http://www.journalcra.com
Roy, Md. Shakil Ahmed, Mala Khan and A. N. M. Al-Razee, 2017. “Comparative study of water quality of
International Journal of Current Research, 9, (10), 59132-59137.
COMPARATIVE STUDY OF WATER QUALITY OF BURIGANGA AND BALU RIVER,
Mala Khan and
3A. N. M. Al-Razee
Engineering and Technology, University of Dhaka, Dhaka-1209, Bangladesh
Designated Reference Institute for Chemical Measurement, BCSIR, Dhaka, Bangladesh
Environmental Science, Training Institute for Chemical Industries
chemical parameters and heavy metal contents of water from the River of Dhaka, Bangladesh. Four physico-chemical parameters such as pH, electric conductivity (EC), biochemical oxygen demand (BOD), chemical oxygen demand (COD) and six heavy metals like Fe, Zn, Cd, Cr, Hg and Pb were investigated to assess water quality May, 2016. The pH, EC, BOD, COD of Buriganga River were found
7.57-381 mg/L whereas 7.58-8.35, 996-1099 μS/cm, 102-149 307.2 mg/L respectively found in Balu river water. The concentration of heavy metals in water samples were determined by Atomic Absorption Spectrophotometer (AAS). The amount of Fe, Zn, Cd, Cr, Hg, and Pb in Buriganga and Balu River were 0.47-2.83 ppm, 0.95-2.759 1.296 ppb; 270-556 ppb, 200-485 ppb; 38.1 ppb respectively. The obtained results revealed that the COD, BOD and heavy metal concentration of both the river water were higher than tandard where as pH and EC values were within the permissible limit. The measured chemical properties and heavy metal concentration of study area shows that Buriganga River
ribution License, which permits unrestricted
caustic soda, aluminum, zinc chromate, zinc phosphate, asbestos etc. This river also receives effluents of many textile, dyeing, battery manufacturing industries from Turag River. by industrial effluents from Tongi area towards downstream and it meets with Buriganga River at area. Industries such as tanneries, dyeing, textile, battery producers, steel plants responsible to pollute , 1999; Rahman et al., 2010 and , 2011). The disposal of untreated waste water of various industries, urban wastes and agrochemical wastes in the low land, open water bodies and rivers has reached an alarming situation in Bangladesh which is increasing day by
et al., 2016, Mottalib et al., 2016
Another important river of Dhaka city is Balu River which is a tributary of Shitalakhya River. Balu River is one of the important water resources in Dhaka district. This river is used for industrial, domestic, residential and various purposes. Many textile, dying, battery manufacturing industry etc. discharge their effluents onto the have a significant impact on surface water quality. industries discharge treated effluent and the rest of the industries discharge effluent in the rivers or water body
INTERNATIONAL JOURNAL OF CURRENT RESEARCH
without any treatment (Satter et al., 2005). Tejgaon metropolitan area is such a type of industrial area having more than 300 industries and these units dispose about 12000 m3 untreated waste per day which consists residue of soap, dyeing, pharmaceuticals, metals industries (Roy et al., 2013). Wastes of this industrial area is directly discharged into Begunbari and Narai canal which carries the waste through Balu River and ultimately flows on Sitalakhya River which is used in Saydabad water treatment plant for meeting water consumption demand of Dhaka city dwellers. Thus Balu River and its canal system in Dhaka east especially Narai canal is the most polluted area which is responsible for polluting Sitalakhya river day by day (Roy et al., 2014). The aim of the present study was to assess pollution level and suitability for swimming, drinking, irrigation, industrial uses and for aquatic lives of Buriganga and Balu Rivers. This study was conducted on five important locations of each river.
MATERIALS AND METHODS
Sample collection and study area
To investigate the water quality of Buriganga and Balu River, samples were collected from 1.5 ft depth of the water surface and 10 samples were collected from five points of each river.
The distance between each two points was 500 m. From each point 2 water samples were collected, one sample used for the determination of physico-chemical properties and other one for heavy metal concentration. Each sample was collected in 500 mL plastic bottle those were made of polyethylene and before collecting sample all bottles were washed with distilled water and dried well. 1 mL of concentrated nitric acid was added to 500 mL samples which were collected for determining selected heavy metals. The tanning industries of Hazaribagh area discharged their liquid waste into a main canal which passed the Hazaribagh-Gabtoli road at Rayer Bazar and met the Buriganga River at Baroipara, Hazaribagh with a large amount of wastes. By this way industrial and other wastes were discharged into Buriganga River and polluted surface water significantly. The sample which was collected from meeting point of Buriganga River and canal was expressed as S1. The samples S2, S3, S4 were collected from 500 m regular distance
towards downstream of the river from location S1. The sample S5 was collected from the 500 m upstream of the meeting point S1.
Similarly another five samples were collected from Balu river. S1 sample was collected from a meeting point of Balu River and a canal which was near the Chanpara mosque. This canal
carries a large amount of waste from the industries. The samples S2, S2, S3 and S4 were collected from 500 m regular distance towards downstream from each sample. The sample S5 was collected from 500 m upstream of sampling point S1. Before determining the concentration of heavy metals acid digestion was carried out for activation of metals following APHA (1985) process. The samples were collected on April, 2016.
Acid digestion for heavy metal determination
100 mL water sample was taken in a beaker from which sample was collected for heavy metal determination. 2 mL concentrated nitric acid was added to the beaker and upper open part of the beaker was covered with a watch glass. Then beaker was heated slowly until 100 mL sample was reduced to 60 mL sample. Heating was stopped and allowed for cooling. Then the sample was filtered and diluted into 100 mL with double distilled water. All chemicals used were in MERK Germany analytical grade.
RESULTS AND DISCUSSION
Method of analysis
In this research each parameter was measured five times and the presented data is the mean value of five readings. pH was measured by a digital pH meter and EC value was determined by conductivity meter. BOD and COD values were measured by BOD incubator and COD reactor. The concentration of heavy metals (Fe, Zn, Pb, Cr and Cd) was determined by using Atomic Absorption Spectroscopy (AAS 6800, Shimadzu, Japan) and the concentration of Mercury (Hg) was determined by using Hg Analyzer. The obtained results of physico-chemical properties of both the rivers are shown in Table 1.
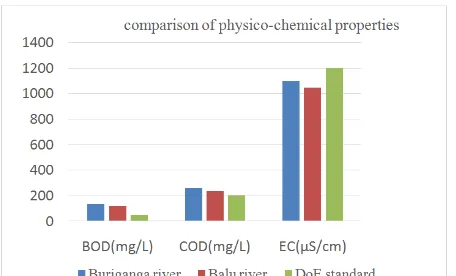
Biochemical oxygen demand is the amount of oxygen required during the biochemical degradation and transformation of organic compounds in wastewater under aerobic conditions by bacteria and other microorganism (Dara 2002). BOD is considered one of the most important parameters for water body. The BOD values obtained (Table 1) in the current research ranged from 109 to 163 mg/L in Buriganga River whereas ranged 102 to 149 mg/L in Balu River. The average values of this parameter in the study area were 135 mg/L and 118 mg/L respectively in Buriganga and Balu Rivers those are higher than the DoE standard (50 mg/L) (DoE, 2003). These higher values indicate that there were huge organic pollutants in both river water. In the case of Buriganga River S1 point was worst affected probably because of discharge wastes from Rayer Bajar and Hazaribagh tannery industrial area and sewage discharged from Dhaka city. This value was gradually decreasing on both upstream and downstream of the river. The results in table 1 show that BOD value is the mirror of COD value. It is noted that COD value indicates the amount of
bio-degradable and non-biobio-degradable pollutants present in water body. Again the higher COD values compared to the BOD values indicate the presence of inert organic material in the river water. The average COD value in the study area of Buriganga and Balu River were 275 mg/L and 199 mg/L respectively. In the case of Buriganga River water COD values of 4 points decreased gradually towards downstream which revealed the most responsible sources locations on upstream of the river. Surface water of rivers usually have a BOD value 1 mg/L to 8 mg/L (Retrieved 2016). Tasfina et al. (2016) assessed average BOD value of Buriganga River water which was 82.8 mg/L.
The variation of BOD and COD values in Balu River were little dissimilar to Buriganga River and these values also were lower than the Buriganga River. The highest BOD and COD values in Balu River found at sampling point S1 and decreased to the point S2 and again increased at sampling point S3. The lowest BOD and COD values were found at the sampling point S4. There were some small canals were found between sampling points S2 and S3 those canals carried industrial effluents to Balu river, as a result sampling point S3 became more polluted than point S2. BOD and COD values of both rivers exceed the Bangladesh standard 50 mg/L and 200 mg/L respectively (DoE 2003). The pH value refers to the alkali, acidic or neutral condition of water body. Average pH values in Buriganga and Balu River water were 7.60 & 7.83 respectively. pH values for both the rivers crossed the value of neutral water. Interestingly, Balu River having little higher pH value than Buriganga River. Electric conductivity measures the salinity of water and depends on presence of ion in water body. The EC of the present study found ranged from 1083 to 1117 μS/cm in Buriganga River while ranged 996 to 1099 μS/cm in Balu River. The EC value of Buriganga River was higher than Balu River which indicates that more ions are present in
[image:3.595.42.555.483.574.2]Buriganga River. The EC of both the river water were lower than the Bangladesh standard 1200 μS/cm (DoE 2003).
[image:3.595.320.548.649.787.2]Table 2. A comparison of physic-chemical properties of Buriganga and Balu river with standard Table 1. The summary of physico-chemical properties of Buriganga and Balu Rivers
Sample ID Buriganga River Balu River
pH EC(μS/cm) BOD(mg/L) COD(mg/L) pH EC(μS/cm) BOD(mg/L) COD(mg/L)
S1 7.64 1117 163 384 8.35 1099 149 307
S2 7.60 1102 145 281 7.80 1096 106 203
S3 7.58 1097 138 255 7.64 1063 125 241
S4 7.57 1083 120 200 7.58 1001 111 228
S5 7.63 1096 109 184 7.76 996 102 204
average 7.60 1099 135 261 7.83 1045 119 237
Table 3. Pearson correlations of physico-chemical properties of surface water of Buriganga River, N=5
pH EC BOD COD
pH 1
EC 0.768 1
BOD 0.283 0.814 1
COD 0.471 0.897* 0.973** 1
* Correlation is significant at the 0.05 level (2-tailed). ** Correlation is significant at the 0.01 level (2-tailed).
The excellent correlations of BOD with COD were found in the above correlation index. The Buriganga River is polluted by tannery wastages and sewage discharges from Dhaka city. In this regard organic pollution load predominated. As the COD and BOD indicates the organic compound therefore the table 3 highlights that BOD (0.973) is strongly correlated with COD.
Table 4. Pearson correlations of physico-chemical parameters of surface water of Balu River
pH EC BOD COD
pH 1
EC 0.616 1
BOD 0.772 0.593 1
COD 0.791 0.487 0.985** 1
**Correlation is significant at the 0.01 level (2-tailed). N=5, no. of samples
Table 4 also focused that BOD (0.985) is strongly correlated with COD in the case of Balu River.
Assessment of heavy metals
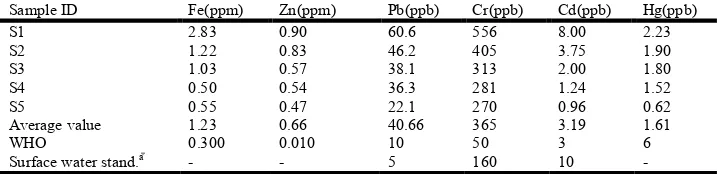
[image:4.595.117.476.386.473.2]Heavy metal pollution of aquatic environment has become a great concern in recent years because they are very harmful as a reason of their non-biodegradable nature, long life and their potential to accumulate in different aquatic organism. Heavy metal concentrations of the selected sampling point of both the rivers are summarized in Tables 5 and 6. The obtained results revealed that the concentration of Fe, Zn, Pb, Cr, Ad and Hg ranged from 0.50 to 2.83 ppm, 0.95 to 2.76 ppm; 0.47 to 0.90 ppm, 0.46 to 0.83 ppm; 22.1 to 60.6 ppb, 7.6 to 38.1 ppb; 270 to 556 ppb, 180 to 485 ppb; 0.96 to 8.00, 0.53 to 1.30 ppm; 0.62 to 2.23 ppb, 1.44 to 2.62 ppb in Buriganga and Balu rivers respectively. These data shows that the amount of Fe, Pb and Cr in both rivers water were much more higher than the WHO standards. A significant reading of heavy metals concentration indicates the input of pollutants from various sources like industrial effluents, domestic sewage, municipal sewage, agricultural runoff and so on. In the Buriganga River Cr concentration was ranged from 556 ppb to 270 ppb which were much more higher than other four tested metals like Cd, Zn, Pb, Hg concentration. Major source of Cr in Buriganga River was tanning industry at Hazaribagh.
Table 5. The concentration of heavy metals in Buriganga river at Hazaribagh area
Sample ID Fe(ppm) Zn(ppm) Pb(ppb) Cr(ppb) Cd(ppb) Hg(ppb)
S1 2.83 0.90 60.6 556 8.00 2.23
S2 1.22 0.83 46.2 405 3.75 1.90
S3 1.03 0.57 38.1 313 2.00 1.80
S4 0.50 0.54 36.3 281 1.24 1.52
S5 0.55 0.47 22.1 270 0.96 0.62
Average value 1.23 0.66 40.66 365 3.19 1.61
WHO 0.300 0.010 10 50 3 6
Surface water stand.a⃰ - - 5 160 10 -
[image:4.595.138.453.512.582.2]a⃰ New Jersey Water Supply, “Surface water quality and pollutant loadings,” A Technical Report for the Baritan Basin Watershed Management Project, 2002.
Table 6. The concentration of heavy metals in Balu River
Sample ID Fe(ppm) Zn(ppm) Pb(ppb) Cr(ppb) Cd(ppb) Hg(ppb)
S1 2.76 0.83 38.1 485 1.30 2.34
S2 1.20 0.57 10.5 321 0.56 2.09
S3 1.35 0.61 23.03 331 0.66 2.62
S4 0.98 0.55 9.0 180 0.53 1.58
S5 0.95 0.46 7.6 200 0.56 1.44
[image:4.595.116.480.607.796.2]Average value 1.45 0.60 17.64 303 0.72 2.01
To convert raw hides/skins into leather basic chromium sulfate used in tanning process. 60-70% of basic chromium sulfate reacts with hides and rest of Cr remain unreacted and discharged directly from the industry and its final destination was Buriganga river (Alireza and Reza 2005). Ahmad et al.
[image:5.595.35.291.190.262.2]investigated the heavy metal concentration in Buriganga River and found the concentration of Cd, Cr and Pb ranged 7.08-12.33, 489.27-647 and 58.7-72.45 mg/L which was varied seasonally (Ahmad 2010).
Table 8. Pearson Correlations of heavy metals in Balu River, N=5
Fe Zn Pb Cr Cd Hg
Fe 1
Zn 0.969** 1
Pb 0.951* 0.952* 1
Cr 0.925* 0.921* 0.919* 1
Cd 0.992** 0.941* 0.939* 0.880* 1
Hg 0.559 0.657 0.729 0.778 0.482 1
**. Correlation is significant at the 0.01 level (2-tailed). *. Correlation is significant at the 0.05 level (2-tailed).
Balu River also gave the results of highly polluted water. A very few industries discharge treated effluent and most of the industries discharge effluent in the rivers or water body without any treatment or with minimal treatment. Tejgaon metropolitan area is such a type of industrial area where more than 300 industrial units are located and these units dispose about 12000 m3untreated waste per day which consists residue of soap, dyeing, pharmaceuticals, metals industries etc. (Roy 2013). Effluent of this industrial area is directly discharged into Begunbari and Narai canal which carries the waste through Balu River and ultimately flows on Sitalakhya River. In Balu river Cr concentration was ranged from 485 ppb to 200 ppb which were higher than the standard value but lower than Buriganga River. Chromium based dye, pigment, paint or other industrial wastewater are responsible to increase Cr concentration in Balu River. Metal concentration in all points in both rivers gradually decreases down the stream. The metal possessing the highest concentration next to Cr was Pb for both the river. In Buriganga River the highest value was 60.6 ppb at point S1 and the lowest value was 22.1 ppb at S5 point. In the Balu River the similar sample ID gave the highest value of 38.1 ppb and the lowest value of 7.6 ppb. Pb concentration in all points in Buriganga River crossed the WHO standard whereas those values at the sampling point S4 and S5 in Balu River were within the acceptable limit. It is noted that dye and pigment industries are the main source of lead pollutants. Both the leather and textile industries play a vital role to increase Pb concentration in Buriganga and Balu river respectively as both types of industries need to use a huge amount of dyes and pigments to impart colour. The average concentrations of Zn in both the rivers were lower than the permissible limit. The highest concentration of Cd was found 8.03 ppb at the sampling point S1 in Buriganga river which exceeded the tolerable limit but other locations gave within permissible limit (WHO). Similarly S1 point near Chandpara Mosque of Balu river gave higher value of Cd, 1.30 ppb than other locations. It is very noticeable that among the tested metals of both rivers the average concentration of Fe and Hg were higher in Balu river than Buriganga river. The average concentration of Fe in both rivers crossed the permissible limit of WHO while concentration of Hg at all points in Buriganga and Balu river were lower than WHO standard. Battery manufacturing industries and some other sources on the bank of rivers increase the concentration of Hg in water body which is very
harmful to aquatic lives. Both physico-chemical properties and heavy metal concentration of Buriganga and Balu Rivers shows that both river water are not suitable for drinking, bathing, house hold activities and aquatic life.
The relationship between the heavy metals studied offer remarkable information on the sources and pathway of the heavy metals. Table 8 indicates Fe is significantly strong correlated with Zn (0.969), Pb (0.951), Cr (0.929), Cd (0.992). The significant strong positive correlations between the heavy metals indicate high degrees of association. The correlation analyses showed a high degree of metal association in the order of Fe/Cd> Fe/Zn> Zn/Pb> Fe/Pb>Zn/Cd> Pb/Cd> Fe/Cr> Zn/Cr> Pb/Cr> Cr/Cd> Cr/Hg> Pb/Hg> Zn/Hg> Fe/Hg> and Cd/Hg.
Conclusion
The quality of drinking and irrigation water is a basic need for a healthy society. Assurance of drinking water safety is a foundation for the prevention and control of waterborne diseases. In present research BOD & COD values for both the rivers were higher than standard values. The EC and pH values of both rivers were within the acceptable limit. The present work shows that the concentration of Fe, Pb and Cr in both the river water were very high and these concentrations are harmful to aquatic life. Buriganga River is polluted by many sources but mainly by leather industries and from these industries inorganic and organic pollutants discharged into Buriganga River regularly without any treatment. On the other hand, the measured concentrations of heavy metals in Balu River were comparatively lower than those in Buriganga River except Fe and Hg. The Balu River is polluted by various industries and mainly by fabric dyeing industries in which huge amount of organic chemicals are used. However, the metal concentrations of Balu River were less than Buriganga River but these values exceeded the acceptable limit compared with water quality standards. In conclusion authors made a comment that both the rivers are highly polluted by industrial and sewerage wastewater.
REFERENCES
Ahmad, M. K. Islam, S., Rahman, S., Haque, M. R. and Islam, M. M. 2010. Heavy metals in water, sediment and some fishes of Buriganga River, Bangladesh, International
Journal of Environmental Research, 4(2):321-332.
Ahmed, S., Bramley, G. 2005. How will Dhaka grow spatially in the future? Modelling its urban growth with a near-future planning scenario perspective, Int. Journal of
Sustainable Built Environment,4(2): 359-377.
Ali, M. M., Ali, M. L., Islam, M. S. and Rahman, M. Z. 2016, Preliminary assessment of heavy metals in water and sediment of Karnaphuli River, Bangaldesh; Environmental Nanotechnology, Monitoring and Management, 5: 27-35. Alireza and Reza. 2005. Chromium removal and recovery from
Tannery waste water by precipitation process. American
Journal of Applied Science,2(10): 471.
Al-razee, A. N. M., Abser, M. N., Mottalib, M. A. and Ansary, M. Z. H. 2016. Assesment of lead in water, sediments, soils and vegetables grown on the bank of Shitalakhya river, Bangladesh; J. Bangladesh Acad. Sci., 40(2): 91-99. American Public Health Association, Washington DC:
Dara, S. S., 2002, A Text book of Environmental Chemistry and Pollution Control (S. Chand and Company Limited), New Dilhi, India, 24-30.
Dhar, R. 2017, June 11. 35% of Hazaribagh tanneries relocated to Savar, Dhaka Tribune. Retrieved from http://www.dhaka tribune.com.
DoE: 2003. A Compilation of Environmental Laws of Bangladesh. Administrated by the Department of Environment, Second Print.
EU, Water Quality Standards. http://en.wikipedia.org/ wiki/Drinking_Water_Quality.
Halim, M. A., Sumayed, S. M., Majumder, R. K., Ahmed, Karmaker, N., Karmaker, Karmaker and Rabbani, K. A. 2011. Study on groundwater, riverwater and tannery effluent quality in southwestern Dhaka, Bangladesh: Insights from multivariate statistical analysis, Journal of
Nature Science and Sustainable Technology, 5(3): 125.
Islam, M. S., Ahmed, M. K., Raknuzzaman, M., Habibullah-Al-Mamun, and Islam, M. K. 2015. Heavy metal pollution in surface water and sediments: a preliminary assessment of an urban river in a developing country. Ecol.
Pharmacol., 39: 347-357.
Kamal, M. M., Malmgren-Hansen, A. and Badruzzaman, A. B. M. 1999. Assessment of pollution of the river Buriganga, Bangladesh, using a water quality model, Water Sci.
Technol., 40(2): 129-136.
Mottalib, M. A., Al-Razee, A. N. M., Abser, M. N. and Aman, E. U. M. 2016. Assessment of physico-chemical properties
of surface water of Shitalakhya River near Polash, Narsingdi, Bangladesh. Int. J. Adv. Res., 4(8): 915-924. Rahman, M. A., and Bakri, D. A. 2010. A Study on Selected
Water Quality Parameters along the River Buriganga,
Bangladesh, Iranian Journal of Energy & Environment,
1(2): 81-92.
Retrieved 2016 January 21, from en.wikipedia.org/wiki/ Ganges.
Roy, S., Banna, L. N., Hossain, M. and Rahman, H. 2014. Water quality of Narai Canal and Balu River of Dhaka city: An impact of industrialization, J. Bangladesh Agril.Univ.,
12(2): 285-290.
Roy, S., Banna, L. N., Mamun, S. A. and Farukh, M. A. 2013. Effects of Industrial Waste water reuse for crop production: A case study in Tejgaon metropolitan area of Dhaka, Bangladesh, J. Bangladesh Agril.Univ., 11(2): 183-188. Satter, M. A. and Islam, M. S. 2005. Quality Assessment of
River Water around Dhaka City, Bangladesh Journal of
Environmental Sciences, 10: 326-329.
Tasfina, S., Ahmed, S. S., Rabbani, K. A., Khaleque, M. A. 2016. An Ivestigation into the water quality of Buriganga-Ariver running through Dhaka, International Journal of
Scientific and Technology, 5: 36-41.
WHO 2004. (World Health Organization), Guideline for drinking water quality, 3rd ed. WHO, Geneva.
WHO, 1996. (World Health Organization), Guidelines for drinking water quality, Geneva,