SPECTRAL ANALYSIS AND INVESTIGATIONS OF AUDIO SIGNALS USING SIGNAL PROCESSING
TOOLS - A CASE STUDY ON NOTES IN
*,1
Parimala, Y. G.,
21
Research Scholar (Extra mural), Department of Physics, Rayal
2
Research Guide, Department of Physics, Rayalaseema University, Kurnool, A.P
3
Co-Guide in Music, Rayalaseema University and Founder, Tarangini arts Foundation, Sirur Park
ARTICLE INFO ABSTRACT
Tones have a fixed frequency while notes in music are a combination of tones or frequencies which are observable in the power spectra. The frequencies present in the spectra are characteristic of the pitch, timbre, amplitude of the input audio signal. Th
Carnatic music system by studying the frequency spectra of input signals from veena and vocal. It is found that the spectra contain other harmonics and overtones along with input signal frequency due to resonance effects and the characteristic overtones can be analyzed to get useful information about the timbre of the source. In particular spectra of notes S, R1, R2, M1, P, D2 from vocal at G# and Veena at E are analysed.
Copyright©2017, Parimala et al. This is an open access article distributed under the Creative Commons Att distribution, and reproduction in any medium, provided the original work is properly cited.
INTRODUCTION
Frequency analysis and power spectrum studies of musical scales are studied with reference to Western scales extensively. However, very little investigative studies are found regarding Carnatic musical scales. Present research work concentrates on theses aspects. In particular the present paper concerns studies of frequency spectra from individual notes in Carnatic music. It is known that while tones give raise to a single frequency, a group of frequencies give a
called’swara’ in carnatic music. Western music defines 7 full
notes and 5 semitones giving totally 12 notes
Terhardt, 1974 and Physics of music and Musical Instruments 2006). Carnatic music has an analogical system but the definition of relative frequencies between two notes is different in the two systems. Also melodious tunes or ragas in Carnatic music always have an important ornamentation called
*Corresponding author: Parimala, Y. G.,
Research Scholar (Extra mural), Department of Physics, University, Kurnool, A.P. India.
ISSN: 0975-833X
Article History:
Received 18th May, 2017
Received in revised form
23rd June, 2017
Accepted 26th July, 2017
Published online 31st August, 2017
Citation: Parimala, Y. G., Dr. Munibhadrayya, B. and Dr. Suma Sudhindra
processing tools - A case study on notes in carnatic classical music to analyse the overtones and harmonics (08), 55560-55567.
Available online at http://www.journal
Key words:
Spectral analysis, Carnatic, overtones,
Harmonics, Resonance, Veena.
RESEARCH ARTICLE
SPECTRAL ANALYSIS AND INVESTIGATIONS OF AUDIO SIGNALS USING SIGNAL PROCESSING
A CASE STUDY ON NOTES IN CARNATIC CLASSICAL MUSIC TO ANALYSE THE
OVERTONES AND HARMONICS
2
Dr. Munibhadrayya, B. and
3Dr. Suma Sudhindra
Research Scholar (Extra mural), Department of Physics, Rayalaseema University, Kurnool, A.P. India
Research Guide, Department of Physics, Rayalaseema University, Kurnool, A.P
Guide in Music, Rayalaseema University and Founder, Tarangini arts Foundation, Sirur Park
Malleswarm, Bangalore, India
ABSTRACT
Tones have a fixed frequency while notes in music are a combination of tones or frequencies which are observable in the power spectra. The frequencies present in the spectra are characteristic of the pitch, timbre, amplitude of the input audio signal. These features are illustrated in a case study on Carnatic music system by studying the frequency spectra of input signals from veena and vocal. It is found that the spectra contain other harmonics and overtones along with input signal frequency due to nance effects and the characteristic overtones can be analyzed to get useful information about the timbre of the source. In particular spectra of notes S, R1, R2, M1, P, D2 from vocal at G# and Veena at E are analysed.
is an open access article distributed under the Creative Commons Attribution License, which distribution, and reproduction in any medium, provided the original work is properly cited.
Frequency analysis and power spectrum studies of musical scales are studied with reference to Western scales extensively. However, very little investigative studies are found regarding Carnatic musical scales. Present research work concentrates particular the present paper concerns studies of frequency spectra from individual notes in Carnatic music. It is known that while tones give raise to a single
frequency, a group of frequencies give a note which is
usic. Western music defines 7 full notes and 5 semitones giving totally 12 notes (Feynman, 1965; Physics of music and Musical Instruments, Carnatic music has an analogical system but the two notes is different in the two systems. Also melodious tunes or ragas in Carnatic
music always have an important ornamentation called gamaka.
Research Scholar (Extra mural), Department of Physics, Rayalaseema
Hence depending on the performer any note rendered either in vocal or instrumental music have characteristic wave forms, with varying harmonics and overtones. There is immense scope to study these with respe
music.
Standing Waves
Standing waves occur whenever two waves with equal frequency and wavelength move through a medium so that the two perfectly reinforce each other. In order for this to occur the length of the medium must be equal to some integer multiple of half the wavelength of the waves. Usually, one of the two waves is the reflection of the other. When they reinforce each other, it looks like the energy is standing in specific locations on the wave medium, hence it is
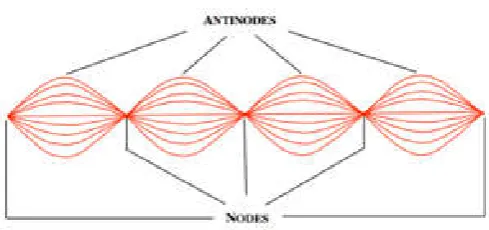
(figure 1). There are parts of the wave medium that remain motionless (the nodes) and parts where the wave medium moves back and forth between maximum positive and maximum negative amplitude (the antinodes)
Johan, 1989).
International Journal of Current Research
Vol. 9, Issue, 08, pp.55560-55567, August, 2017
Munibhadrayya, B. and Dr. Suma Sudhindra. 2017. “Spectral analysis and investigations of audio signals using signal
case study on notes in carnatic classical music to analyse the overtones and harmonics”, International Journal of Curr
Available online at http://www.journalcra.com
z
SPECTRAL ANALYSIS AND INVESTIGATIONS OF AUDIO SIGNALS USING SIGNAL PROCESSING
CARNATIC CLASSICAL MUSIC TO ANALYSE THE
Dr. Suma Sudhindra
aseema University, Kurnool, A.P. India
Research Guide, Department of Physics, Rayalaseema University, Kurnool, A.P. India
Guide in Music, Rayalaseema University and Founder, Tarangini arts Foundation, Sirur Park road,
Tones have a fixed frequency while notes in music are a combination of tones or frequencies which are observable in the power spectra. The frequencies present in the spectra are characteristic of the ese features are illustrated in a case study on Carnatic music system by studying the frequency spectra of input signals from veena and vocal. It is found that the spectra contain other harmonics and overtones along with input signal frequency due to nance effects and the characteristic overtones can be analyzed to get useful information about the timbre of the source. In particular spectra of notes S, R1, R2, M1, P, D2 from vocal at G# and Veena
ribution License, which permits unrestricted use,
Hence depending on the performer any note rendered either in vocal or instrumental music have characteristic wave forms, with varying harmonics and overtones. There is immense scope to study these with respect to the ragas of Carnatic
Standing waves occur whenever two waves with equal frequency and wavelength move through a medium so that the two perfectly reinforce each other. In order for this to occur the be equal to some integer multiple of half the wavelength of the waves. Usually, one of the two waves is the reflection of the other. When they reinforce each other, it looks like the energy is standing in specific locations on the wave medium, hence it is known as standing wave (figure 1). There are parts of the wave medium that remain motionless (the nodes) and parts where the wave medium moves back and forth between maximum positive and maximum negative amplitude (the antinodes) (Sundberg, INTERNATIONAL JOURNAL
OF CURRENT RESEARCH
Fig. 1. Standing wave pattern showing Nodes and antinodes
Standing waves are formed when two waves of equal frequency and wavelength move through a medium and perfectly reinforce each other. In order for this to occur the length of the medium must be equal to some integer multiple of half the wavelength of the waves. In the case of this standing wave, the medium is two wavelengths long (4 half wavelengths).
Modes, Overtones, and Harmonics
When a Desired note (tone) is played on a musical instrument, there are always additional tones produced at the same time. The different modes of vibration produced by a musical instrument are a key to the development of consonant musical scales. The sound produced by any musical instrument is far more complex than the single frequency of the desired note. The frequency of the desired note is known as the fundamental frequency, which is caused by the first mode of vibration, but many higher modes of vibration always naturally occur simultaneously. Higher modes are simply alternate, higher frequency vibrations of the musical instrument medium. The
frequencies of these higher modes are known as overtones. So
the second mode produces the first overtone, the third mode produces the second overtone, and so on. In musical instruments like stringed and wind instruments or in vocal music, the overtones are related to the fundamental frequency “harmonically.” If overtones from the instruments are harmonic, they satisfy a simple relation with the fundamental frequency. Harmonics are overtones that happen to be simple integer multiples of the fundamental frequency. E.g. if a string is plucked and it produces a frequency of 110 Hz, multiples of that 110 Hz will also occur at the same time: 220 Hz, 330 Hz, 440 Hz, etc will all be present, though not with the same intensity. Infact Greeks call the interval between these two frequencies as a diapason. 440 Hz and 880 Hz and they sound good together; the fundamental frequency and all of its overtones combine to produce that instrument’s sound spectrum or power spectrum. Flute has this particular “spectrum of sound.” Other instruments playing a given note would have overtones present in different portions. The sound spectrum of an instrument is its “acoustical fingerprint.” (Resonant Frequencies, 2017 and the Physics OF Resonance, 2017).
Sympathetic and Forced Vibration
Resonance is a relationship that exists between two bodies vibrating at the same frequency or a multiple, i.e., the vibrations emanating from one body cause the other body to start vibrating in tune with it (Raghavendra Rao, 2002). There
are two kinds of resonance: sympathetic resonance (or free
resonance) and forced resonance (or conductive resonance). In
sympathetic resonance there is no need of a direct physical contact between the two bodies. The resonator starts functioning because it receives vibrations through the air and responds to them sympathetically, as long as the resonator's natural frequencies of vibration coincide with the exciting oscillations. In forced resonance the resonator starts vibrating because it is in physical contact with a vibrating body, which "forces" the resonator to replicate its oscillations. Both types of resonance are at work in the human voice during speaking and singing. Much of the vibration felt by singers while singing is a result of forced resonance. The waves originated by the airflow modulated by the vibrating vocal folds travel along the bones, cartilages, and muscles of the neck, head, and upper chest, causing them to vibrate by forced resonance. There is little evidence that these vibrations, sensed by tactile nerves, make any significant contribution to the external sound. These same forced vibrations, however, may serve as sensation guides for the singer, regardless of their effect on the external sound. These sensations may provide evidence to the singer that his vocal folds are forming strong primary vibrations which are being carried from them to the head and chest. In contrast, the sound a person hears from a singer is a product of sympathetic resonance. Air vibrations generated at the level of the vocal folds in the larynx propagate through the vocal tract, i.e. the ducts and cavities of the airways, being considerably modified. In other words, the glottal wave created in the vocal source is filtered by the vocal tract, a phenomenon of sympathetic resonance (Srimani, ?) The vocal resonator is not a sounding board, comparable with stringed instruments, but rather a column of air, the vocal tract, with a shape that is not only complex, but highly variable. The voice, like all acoustic instruments such as the guitar, trumpet, piano, or violin, has its own special chambers for resonating the tone. Once the tone is produced by the vibrating vocal cords, it vibrates in and through the open resonating ducts and chambers, or the vocal tract, being sometimes associated to different regions of the
body: chest, mouth, nose, "mask", and head. In stringed
Instruments Strings or parts of strings may resonate at
their fundamental or overtone frequencies when other strings are sounded. For example, an A string at 440 Hz will cause an E string at 330 Hz to resonate, because they share an overtone of 1320 Hz (3rd overtone of A and 4th overtone of E). (Srimani, 2009). String resonance is one of the factors which reflect on the timbre of a string instrument.
Timbre or Quality of a Sound
One can easily identify the instrument even if each produce the same note due to the difference in intensities of the various overtones produced, which gives each instrument a characteristic sound quality or timbre. This ability to distinguish is true even between musical instruments that are quite similar, like a flute and a saxophone even though both are wind instruments. The contribution of total sound arising from the overtones varies from instrument to instrument, from note to note on the same instrument and even on the same note [10] This is true in other string instruments, like the violin, veena or the sitar where overtones contribute significantly to the power spectrum and hence a unique timbre is associated with each which helps in identification of the instrument.
RESULTS AND DISCUSSION
In the present work we try to analyze the contributions of overtones and harmonics in various notes produced in vocal music and on veena. The definition of the 12 notes and their
relative frequency ratios in carnatic classical music were formulated considering the shruthis and the mela systems. In CCM swaras(or notes) have varying ratios with their successive swaras. Carnatic music defines 16 notes which take
12 locations. Shruthis are fundamental to CCM and are
defined as minimum intervals between notes which have a
musical value like overtones.
Table 1. Comparative table showing the notes, their relative frequency ratios and frequencies for a pitch of
Western Equitempered Scale
Note Freq ratio Decimal value Freq
C 20-Dec 1 440
C# 21-Dec 1.06 466.16
D 22-Dec 1.123 493.9
D# 23-Dec 1.189 523.25
E 24-Dec 1.26 554.36
F 25-Dec 1.335 587.31
F# 26-Dec 1.414 622.25
G 27-Dec 1.498 659.25
G# 28-Dec 1.587 698.46
A 29-Dec 1.681 739.99
A# 210/12 1.782 783.99
B 211/12 1.888 830.63
C1 212/12 2 880
55562 International Journal of Current
relative frequency ratios in carnatic classical music were formulated considering the shruthis and the mela systems. In (or notes) have varying ratios with their successive swaras. Carnatic music defines 16 notes which take are fundamental to CCM and are defined as minimum intervals between notes which have a
The combinations of shruthis results in 2 types of swaras
Prakruti swaras- S and P which are inherently stable,
having no variants and ii) Vikruti
have variants. R,G,D and N have 3 variants each, M has 2, giving totally 16 variants. Out of them 4 pairs of variants G1, R3-G2, D2-N1 and D3-N2 overlap.
Table 1. Comparative table showing the notes, their relative frequency ratios and frequencies for a pitch of A(440 Hz) for Carnatic and Western music
Carnatic scale
Freq ∆f Note Freq ratio Decimal value
440 S 1 1
466.16 26.16 R1 256/243 1.054
493.9 27.74 R2 09-Aug 1.125
523.25 29.35 G2 32/27 1.185
554.36 31.11 G3 81/64 1.266
587.31 32.95 M1 04-Mar 1.33
622.25 34.94 M2 729/512 1.424
659.25 37 P 03-Feb 1.5
698.46 39.21 D1 128/81 1.58
739.99 41.53 D2 27/16 1.688
783.99 44 N2 16-Sep 1.8
830.63 46.64 N3 243/128 1.898
[image:3.595.81.523.180.769.2]880 49.37 2S 2 2
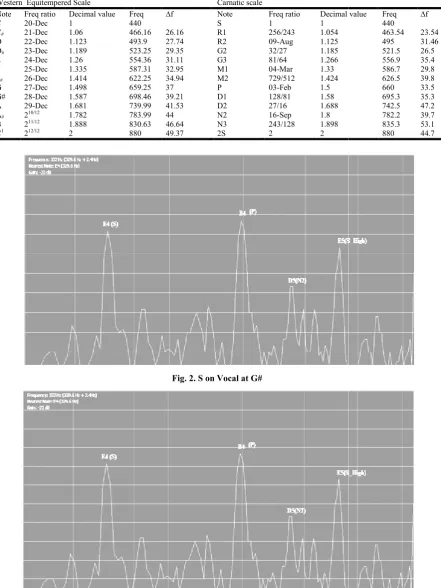
Fig. 2. S on Vocal at G#
Fig. 3. S on Veena at E
International Journal of Current Research, Vol. 9, Issue, 08, pp.55560-55567, August,
The combinations of shruthis results in 2 types of swaras- i) S and P which are inherently stable, i.e.,
Vikruti swaras - R,G,M,D,N which have variants. R,G,D and N have 3 variants each, M has 2, giving totally 16 variants. Out of them 4 pairs of variants-
R2-N2 overlap.
Table 1. Comparative table showing the notes, their relative frequency ratios and frequencies for a pitch of
Decimal value Freq ∆f
440
463.54 23.54
495 31.46
521.5 26.5
556.9 35.4
586.7 29.8
626.5 39.8
660 33.5
695.3 35.3
742.5 47.2
782.2 39.7
835.3 53.1
880 44.7
his results in 12 swarasthanas or semitones
relative ratios are indicated in table 1 These
in the table are named as S, R1, R2/G1, R3/G2, G3, M1, M2, P, D1, D2/N1, D3/N2, N3. A frequency analysis of notes S, R2, M1, P, D2 on Veena and Vocal are shown in the graphs 2 13
55563 Parimala et al. Spectral analysis and investigations of audio signals using signal processing tools on notes in Carnatic
semitones whose names and relative ratios are indicated in table 1 These 12 notes as shown in the table are named as S, R1, R2/G1, R3/G2, G3, M1, M2, P, D1, D2/N1, D3/N2, N3. A frequency analysis of notes S, R2, M1, P, D2 on Veena and Vocal are shown in the graphs
2-Pitches and equivalent notes
[image:4.595.107.502.128.564.2]Vocalists pitch is a variable one which can be at any note A, A#, B, C… while instruments have a limitation of pitches which they can be tuned to. For eg. An instrument like Veena may be tuned only in a small range D# to E or F.
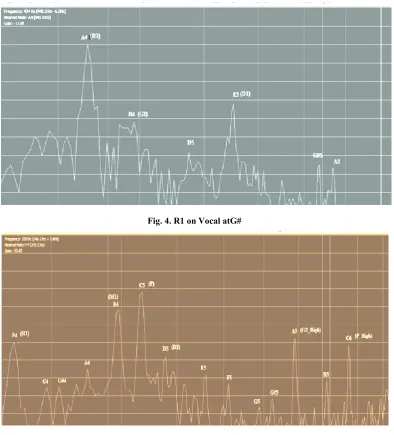
Fig. 4. R1 on Vocal atG#
Fig. 5. R1 on Veena at E
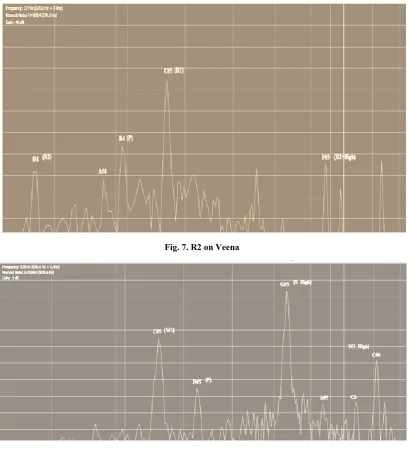
Fig. 6. R2 on vocal
Spectral analysis and investigations of audio signals using signal processing tools -on notes in Carnatic classical music to analyse the overt-ones and harm-onics
Vocalists pitch is a variable one which can be at any note A, A#, B, C… while instruments have a limitation of pitches which they can be tuned to. For eg. An instrument like Veena may be tuned only in a small range D# to E or F.
55564 International Journal of Current Research,
[image:5.595.104.503.514.750.2]Fig. 7. R2 on Veena
Fig. 8. M1 on Vocal at G#
Fig. 9. M1 on Veena at E
Depending on the chosen pitch the remaining notes correspond to their Western counterparts in accordance with the relative frequency ratios and can be easily determined. For eg if the reference pitch is G#, then the correspondence is G#
R1, A# ≡ R2/G1, B≡ R3/G2, C≡ G3, C# ≡ M1, D≡M2, D# ≡ P, E≡D1, F≡D2/N1, F# ≡ D3/N2, G ≡ N3. A similar scaled equivalence can be done for any pitch. A frequency plot for any audio input consists of a plot of amplit
frequency which will show characteristic peaks for any note or set of notes or melodious tunes. The spectra will usually contain several peaks, of which some are of large amplitudes than the others.
The spectra reflect the features of the input signal in terms of important frequencies present, overtones and harmonics present, their amplitudes. An analysis of the spectrum will hence indicate the important note in the source input signal and also the timbre of the source. This study can help in developing a technique for identification of features of an input audio signal. Audio processing tools were used in our studies and were carried out on various sources. At G# an input note of S is shown in the Fig 2. A note of s similarly input at a pitch E from a Veena is shown in Fig. 3. They both show not only characteristic peaks at S but also at S at the upper octave and P of the middle octave.
55565 Parimala et al. Spectral analysis and investigations of audio signals using signal processing tools on notes in Carnatic classical music to analyse the overtones and harmonics
Depending on the chosen pitch the remaining notes correspond to their Western counterparts in accordance with the relative frequency ratios and can be easily determined. For eg if the G#, then the correspondence is G# ≡ S, A≡ ≡ R2/G1, B≡ R3/G2, C≡ G3, C# ≡ M1, D≡M2, D# ≡ P, ≡D1, F≡D2/N1, F# ≡ D3/N2, G ≡ N3. A similar scaled equivalence can be done for any pitch. A frequency plot for any audio input consists of a plot of amplitude against frequency which will show characteristic peaks for any note or set of notes or melodious tunes. The spectra will usually contain several peaks, of which some are of large amplitudes
The spectra reflect the features of the input signal in terms of important frequencies present, overtones and harmonics present, their amplitudes. An analysis of the spectrum will important note in the source input signal and also the timbre of the source. This study can help in developing a technique for identification of features of an input audio signal. Audio processing tools were used in our studies and At G# an input note of S 2. A note of s similarly input at a pitch E . 3. They both show not only characteristic peaks at S but also at S at the upper octave and P
This is because all higher harmonics or overtones which are in consonance with the given input resonate with this frequency. When input is a R1 at the given pitch say G# or E, however other peaks are seen as shown in
the vocal input a peak is also present at D1 and Veena shows an additional peak at M1 as well. This is explained in terms of the consonance notes as stated by musicologists and as observed by performers. While in western music some notes sounded together in consonanc
or melodies of Carnatic system these notes are known as vadi samvadi notes which means they are anological counter parts in the two halfs of a musical scale.
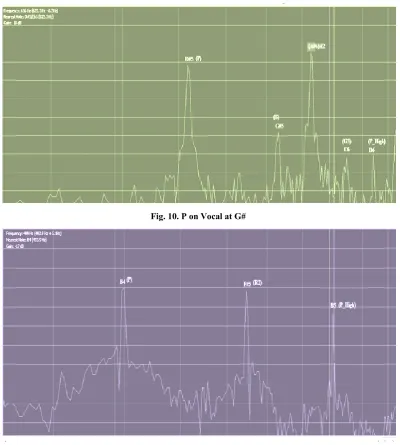
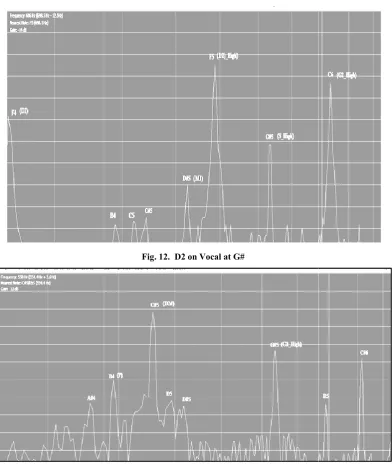
[image:6.595.100.501.197.643.2]Similar consonant peaks occur at D2 when R2 is the input, D3 when R3 is input. With P as input, we see peaks at P, R2 and P of upper octave. This follows the same reasoning that R2 is at a position 3/2 times the fundamental. If P is at a frequency of 622.3 Hz, the upper octave P is at 1244.6 Hz, i.e., doubles the lower P and R2 is at 933.45Hz which is at 3/2 times the input note. Therefore in relation to the input note it again takes the position of P. Spectra for the input M1 show peaks at M1 and upper M1 as well as peaks at S and P. While S is again at 3/2 of the fundamental frequency, the smaller peak at P is an overtone at this input.
Fig. 10. P on Vocal at G#
Fig. 11. P on Veena at E
Spectral analysis and investigations of audio signals using signal processing tools -on notes in Carnatic classical music to analyse the overt-ones and harm-onics
is because all higher harmonics or overtones which are in consonance with the given input resonate with this frequency. When input is a R1 at the given pitch say G# or E, however other peaks are seen as shown in Figs 4 and 5 respectively. In ut a peak is also present at D1 and Veena shows an additional peak at M1 as well. This is explained in terms of the consonance notes as stated by musicologists and as observed by performers. While in western music some notes sounded together in consonance are known as chords, in ragas or melodies of Carnatic system these notes are known as vadi-samvadi notes which means they are anological counter parts in the two halfs of a musical scale.
peaks occur at D2 when R2 is the input, D3 when R3 is input. With P as input, we see peaks at P, R2 and P of upper octave. This follows the same reasoning that R2 is at a position 3/2 times the fundamental. If P is at a frequency octave P is at 1244.6 Hz, i.e., doubles the lower P and R2 is at 933.45Hz which is at 3/2 times the input note. Therefore in relation to the input note it again takes the position of P. Spectra for the input M1 show peaks at M1 eaks at S and P. While S is again at 3/2 of the fundamental frequency, the smaller peak at P is an
In general inputs from veena tend to show more peaks which can be explained since vibrations of the strings in veena which are in tension can give raise to additional resonance effects and can include sympathetic resonance and presence of gamakas
inherent in the instrument. (Figs 5-13)
Conclusions
Input audio signals form vocal and veena for various inputs were analyzed by obtaining their frequency spectra to determine the overtones and harmonics present. The results are in agreement with the notes and chords defined in Western music. They are also able to explain the theoretical predictions on various features of notes in Carnatic music namely ‘Vadi Samvadi notes’, gamakas and resonance effects which give raise to the peaks corresponding to the harmonics and overtones. This technique can be very useful in studying the nature of input signals and timbre of the sources. In particular veena produces more harmonics and overtones than vocal since there are other reasons for production of harmonics like resonance due to vibrations transmitted to ad
tension in the string.
55566 International Journal of Current Research,
more peaks which can be explained since vibrations of the strings in veena which are in tension can give raise to additional resonance effects and can include sympathetic resonance and presence of gamakas
Input audio signals form vocal and veena for various inputs were analyzed by obtaining their frequency spectra to determine the overtones and harmonics present. The results are in agreement with the notes and chords defined in Western also able to explain the theoretical predictions on various features of notes in Carnatic music namely ‘Vadi-Samvadi notes’, gamakas and resonance effects which give raise to the peaks corresponding to the harmonics and ery useful in studying the nature of input signals and timbre of the sources. In particular veena produces more harmonics and overtones than vocal since there are other reasons for production of harmonics like resonance due to vibrations transmitted to adjacent strings,
REFERENCES
Feynman, 1965. Richard Feynman. 1983, 1965. "The
Character of Physical Law". The M.I.T. Press,
Cambridge, Massachusetts.
Terhardt, 1974. PCH Ernst Terhardt. 1973/4. "Pitch, consonance, and harmony"
No.5, May 1974 (received 1973), pp. 1061
Physics of music and Musical Instruments, David R. Medford, Masachusetts
Sundberg, Johan, 1989. The Science of the Northern Illinois University Press,
"Resonant Frequencies". Acoustical Surfaces July 2017.
"The Physics Of Resonance". Intuitor. Retrieved
Raghavendra Rao, K.S., Jaishree Prasad, M.K. 2002.
in the theory, practice and experiment in Karnatak music”, Abhinav Publications, 2002
Srimani, P.K. and Parimala, Y.G.
[image:7.595.111.504.52.520.2]unique Raga Classification and Identification tool using Aritificial Neural networks’, Selected for presentation at Int.Conf. of IETAN, Jaipur
Fig. 12. D2 on Vocal at G#
Fig. 13. D2 on Veena at E
International Journal of Current Research, Vol. 9, Issue, 08, pp.55560-55567, August, 2017
Richard Feynman. 1983, 1965. "The
Character of Physical Law". The M.I.T. Press,
PCH Ernst Terhardt. 1973/4. "Pitch,
consonance, and harmony" J. Acoust Soc. Am., Vol.55,
No.5, May 1974 (received 1973), pp. 1061-1069.
Physics of music and Musical Instruments, David R. Lapp,
1989. The Science of the Singing Voice, Northern Illinois University Press, ISBN 0875805426
Acoustical Surfaces. Retrieved 10
Intuitor. Retrieved 10 July 2017.
, K.S., Jaishree Prasad, M.K. 2002. “Veena, in the theory, practice and experiment in Karnatak music”, Abhinav Publications, 2002.
, Y.G. ‘Pattern Recognition and a unique Raga Classification and Identification tool using Aritificial Neural networks’, Selected for presentation at
Srimani P.K. and Parimala Y.G., ‘Dwavimshathi Shruthis’, Proc., “Mahila Vijnana Sammelana-5’ (in Kannada), Mangalore, 2009
https://arxiv.org/html/1202.4212v1/en.wikipedia.org/wiki/Res onance
https://ipfs.io/ipfs/QmXoypizjW3WknFiJnKLwHCnL72vedxj QkDDP1mXWo6uco/wiki/String_resonance.html