ISSN Online: 1949-5005 ISSN Print: 1949-4998
DOI: 10.4236/health.2018.1012124 Dec. 3, 2018 1650 Health
Association of Low Back and Pelvic Pain with
Mental Health Condition during Pregnancy and
Postpartum
Yuko Uemura
1*, Toshiyuki Yasui
2, Kimiyo Horike
3, Kazuhisa Maeda
3, Hirokazu Uemura
4,
Mari Haku
5, Reiko Sakae
1, Keiko Matsumura
11Department of Nursing, Kagawa Prefectural University of Health Sciences, Kagawa, Japan
2Department of Reproductive and Menopausal Medicine, Institute of Biomedical Sciences, Tokushima University Graduate School, Tokushima, Japan
3Shikoku Medical Center for Children and Adults, Kagawa, Japan
4Department of Preventive Medicine, Institute of Biomedical Sciences, Tokushima University Graduate School, Tokushima, Japan 5Department of Midwifery, Institute of Biomedical Sciences, Tokushima University Graduate School, Tokushima, Japan
Abstract
Background: Low back and pelvic pain (LBPP) as a physical symptom may cause psychological symptoms during pregnancy and the postpartum period. We examined the association of LBPP with mental health condition in wom-en from pregnancy to puerperium in a prospective study. Methods: This study was conducted from March 2015 to December 2016 in a birth center in Kagawa Prefecture in Japan. We recruited 89 pregnant women who respond-ed to questionnaires in all four stages (first, second and third trimesters and one week postpartum). We designed a self-administered questionnaire in-cluding a visual analog scale (VAS) of LBPP and Edinburgh postnatal depres-sion scale (EPDS). Results: There were significant differences in EPDS scores and VAS scores among the 4 stages. The EPDS score at the first trimester showed significant positive correlations with VAS scores at the second and third trimesters, and the EPDS score at the second trimester showed a signif-icant positive correlation with VAS score at the third trimester. The VAS scores at the second trimester showed significant positive correlations with EPDS scores at the third trimester and at one week postpartum. Conclusion: It was shown that the mental health condition at early pregnancy was related to an increase in LBPP at mid-pregnancy and that LBPP at mid-pregnancy was associated with the mental health condition thereafter.
Keywords
Low Back Pain, Mental Health, Pregnancy, Prospective Study
How to cite this paper: Uemura, Y., Yasui, T., Horike, K., Maeda, K., Uemura, H., Haku, M., Sakae, R. and Matsumura, K. (2018) Association of Low Back and Pelvic Pain with Mental Health Condition during Pregnancy and Postpartum. Health, 10, 1650-1660.
https://doi.org/10.4236/health.2018.1012124
Received: November 5, 2018 Accepted: November 30, 2018 Published: December 3, 2018
Copyright © 2018 by authors and Scientific Research Publishing Inc. This work is licensed under the Creative Commons Attribution International License (CC BY 4.0).
DOI: 10.4236/health.2018.1012124 1651 Health
1. Introduction
Low back and pelvic pain (LBPP) during pregnancy has a great influence on daily life thereafter. We reported that LBPP at the early stage of pregnant was associated with limitation of mobility and difficulty in performing daily activities during pregnancy [1]. Olsson et al. reported that 40% of women at 6 months postpartum had LBPP and that continuation of LBPP in the postpartum period might have an influence on child rearing [2]. It has been reported that pelvic girdle pain during late pregnancy prevented return to work after childbirth in working women at 12 weeks postpartum [3] [4]. Recently, it was reported that one in 10 women with pelvic girdle pain during pregnancy had severe conse-quences for up to 11 years, and that women with pelvic girdle pain had signifi-cantly decreased ability to perform daily activities, a lower level of self-efficacy, and higher levels of anxiety and depression and that they worked significantly fewer hours/week compared to women without pain [5].
With regard to mental disorders in pregnancy and puerperium, it has been reported that a depressive mood observed in early pregnancy decreased at late pregnancy but increased during the postpartum period [6]. Mental disorders in the postpartum period are important social issues in Japan. Death of children due to child abuse has been increasing in Japan, and psychological disease, an-xiety about child rearing and burden of childcare are considered to be factors related to child abuse [7]. Also, 60% of pregnant women who committed suicide had postpartum depression, and efforts have been made to improve management of postpartum depression in Japan [8]. Physical symptoms such as LBPP may be linked to psychological symptoms. Regarding the association between low back pain in late pregnancy and depression, Chang et al. reported that initial depression scores predicted increases in pain interference and that depression was associated with an increase in pregnancy-related low back pain interference [9]. Pregnant women with physical health problems such as exhaustion, morning sickness, back pain, constipation and severe headaches or migraines are at increased risk of hav-ing depressive symptoms in early pregnancy [10]. It has also reported that post-partum depressive symptoms were 3-times more prevalent in women with lum-bopelvic pain than in women without lumlum-bopelvic pain [11]. We hypothesized that LBPP from pregnancy to the postpartum period is related to psychological symptoms and that an increase in LBPP is correlated with levels of psychological symptoms. There has been no longitudinal study on the association between LBPP and mental condition during pregnancy and the postpartum period. In the present prospective study, we investigated longitudinal changes in LBPP in the first tri-mester, second tritri-mester, third trimester and one week postpartum in order to de-termine correlations of LBPP in these stages with mental health.
2. Methods
2.1. Subjects and Methods
DOI: 10.4236/health.2018.1012124 1652 Health
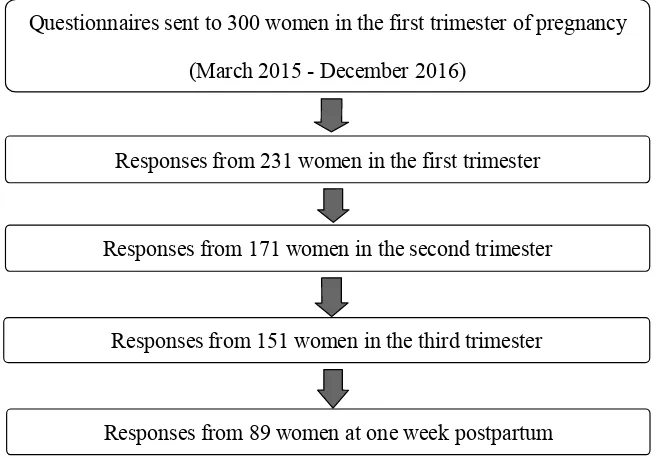
in Kagawa Prefecture in Japan. We distributed questionnaires regarding LBPP to 300 pregnant women at the first trimester. Number of delivery was approx-imately 500 per year in the hospital that we examined, and sample size was 246 by using permissible errors (5%), reliability (95%) and a ratio of a population (20%). We determined that sample size was 300 considering the number of un-collected sample. The numbers of un-collected questionnaires were 231 in the first trimester (mean period: 14.8 weeks; 10 - 19 weeks), 171 in the second trimester (mean period: 25.8 weeks; 25 - 28 weeks), 151 in the third trimester (mean pe-riod: 35.7 weeks; 35 - 38 weeks), and 89 at one week postpartum. Eighty-nine pregnant women who responded to questionnaires in all four stages were used as subjects for this study (Figure 1). Participants were informed of the purposes and procedure of the study.
Low back pain during pregnancy is said to be “low back pain”, “back pain”, “low back pain and pelvic pain”, “pelvic girdle pain”, “back or pelvic pain” “lumbopelvic pain”, “peripartum pelvic pain”, “pelvic girdle syndrome”, “pu-regnancy-related lumbopelvic pain (PRLPP)” in various terms. In this study, low back pain caused by pregnancy is defined as including back pain and pelvic pain (LBPP) during pregnancy.
2.2. Questionnaire
[image:3.595.210.538.478.707.2]We designed a self-administered questionnaire consisting of three parts that equired about 20 minutes to complete. Uemura et al. [12] designed the ques-tionnaire for this study. The contents of the quesques-tionnaire were shown in detail in our previous report [12]. Briefly, the first part of the questionnaire consisted of questions regarding baseline characteristics such as age, marital status, educa-tion and week of pregnancy. The second part of the queseduca-tionnaire consisted of
Figure 1. Recruitment of subjects.
Questionnaires sent to 300 women in the first trimester of pregnancy
(March 2015 - December 2016)
Responses from 231 women in the first trimester
Responses from 171 women in the second trimester
Responses from 151 women in the third trimester
DOI: 10.4236/health.2018.1012124 1653 Health
questions regarding the presence of LBPP, location of pain, and 10 cm visual analog scale (VAS). Maternal mental health problems in pregnancy and in the postpartum period were assessed by using the Edinburgh Postnatal Depression Scale (EPDS). The EPDS questionnaire is a self-reported questionnaire consist-ing of ten items scored on a four-point Likert scale (0 - 3) that is designed to as-sess pregnancy and postpartum depression [13]. The EPDS Japanese version showed good internal consistency (Cronbach alpha = 0.78) and test-retest relia-bility (Spearman correlation = 0.92) [14]. A score equal to or higher than 9 was designated to screen for minor and major depressive episodes, with sensitivities of 75% and 82% and with specificities of 93% and 95%, respectively [14] [15].
2.3. Data Analysis
The correlation of VAS score in one period with that in another period and the correlation of VAS score with EPDS score were analyzed by using Spearman’s correlation. The change in the proportions of women with LBPP during the 4 stages of pregnancy and postpartum was evaluated by using Cochran’s Q test, and changes in the VAS and EPDS scores during the 4 stages were analyzed by using Friedman’s test. The VAS scores as well as the EPDS scores between the different 2 stages were compared by paired t-test, and their p values less than 0.0083 (0.05/6) were considered to be statistically significant according to the Bonferroni’s method. P values were two-tailed, and those less than 0.05 were considered to be statistically significant. Statistical analyses of the data were car-ried out using SPSS version 24 for Windows (IBM Corp., Aromonk, NY).
3. Results
Baseline characteristics of the subjects are shown in Table 1. Mean age ± stan-dard deviation (SD) of the subjects was 32.7 ± 5.0 years. The subjects included 37.1% primiparous women and 62.9% multiparous women. The proportion of unemployed women was 21.3% at the first trimester. The proportion of women with a past history of LBPP before pregnancy was 47.2%, and the proportion of women with a past history of LBPP in the previous pregnancy was 62.5%.
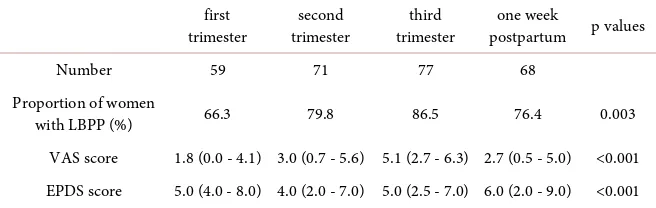
The proportions of women who complained of LBPP were 66.3% at the first trimester, 79.8% at the second trimester, 86.5% at the third trimester, and 76.4% at one week postpartum. There was a significant difference in the proportion of women with LBPP among the 4 stages (p = 0.003) (Table 2).
DOI: 10.4236/health.2018.1012124 1654 Health
Table 1. Characteristics of the subjects (n = 89).
Age (years) 32.7 ± 5.0
Marital status Married 86 (96.6)
Not married 3 (3.4)
Working Yes 70 (78.7)
No 19 (21.3)
Parity Primiparous 33 (37.1)
Multiparous 56 (62.9)
Presence of LBPP before pregnancy Yes 42 (47.2)
No 47 (52.8)
Past history of LBPP in previous pregnancy (n = 56) Yes 35 (62.5)
No 21 (37.5)
The numbers in parenthesis indicate the proportion. Age is shown as mean ± standard deviation. LBPP: low back and pelvic pain.
Table 2. Proportion of women with LBPP, VAS score and EPDS score during the 4
stag-es.
first
trimester trimester second trimester third postpartum p values one week
Number 59 71 77 68
Proportion of women
with LBPP (%) 66.3 79.8 86.5 76.4 0.003
VAS score 1.8 (0.0 - 4.1) 3.0 (0.7 - 5.6) 5.1 (2.7 - 6.3) 2.7 (0.5 - 5.0) <0.001 EPDS score 5.0 (4.0 - 8.0) 4.0 (2.0 - 7.0) 5.0 (2.5 - 7.0) 6.0 (2.0 - 9.0) <0.001 VAS: visual analog scale; EPDS: Edinburgh Postnatal Depression Scale; VAS score and EPDS score are shown as median (25 - 75 percentiles).
between VAS scores at the first trimester and one week postpartum (r = 0.286, p = 0.007), and between VAS scores at the second trimester and third trimester (r = 0.485, p < 0.001).
[image:5.595.210.538.346.450.2]DOI: 10.4236/health.2018.1012124 1655 Health
at one week postpartum (r = 0.581, p < 0.001). The proportions of women for whom the EPDS score was more than 9 were 20.2% at the first trimester, 16.9% at the second trimester, 16.9% at the third trimester and 32.6% at the one week postpartum. There were significant differences in the proportions of women with a high EPDS score between the first trimester and second trimester (p = 0.002), first trimester and third trimester (p = 0.011), second trimester and third trimester (p = 0.003), second trimester and one week postpartum (p = 0.016), and third trimester and one week postpartum (p = 0.003).
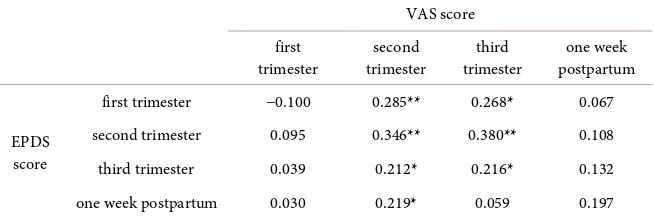
The EPDS score at the second trimester was significantly associated with the VAS score at the second trimester (r = 0.346, p = 0.001), and the EPDS score at the third trimester was significantly associated with the VAS score at the third trimester (r = 0.216, p = 0.042). The EPDS score at the first trimester showed significant positive correlations with VAS scores at the second trimester (r = 0.285, p = 0.007) and at the third trimester (r = 0.268, p = 0.011), and the EPDS score at the second trimester showed a significant positive correlation with the VAS score at the third trimester (r = 0.380, p < 0.001). The VAS score at the second trimester showed significant positive correlations with EPDS scores at the third trimester (r = 0.212, p = 0.046) and at the one week postpartum (r = 0.219, p = 0.039) (Table 3). VAS scores at the first trimester and one week post-partum did not show significant correlations with EPDS scores at any stages.
4. Discussion
[image:6.595.212.539.599.709.2]In the present study, we showed that the EPDS score at the first trimester was decreased at the second and third trimesters followed by an increase at one week postpartum. Recently, EPDS has been used as an indicator of postpartum de-pression in pregnant women [6] [10] [16]. Cut-off values of EPDS vary in dif-ferent countries [10] [17]. It was reported that the proportions of women with depression for whom the EPDS score was more than 10 were 20.0% at the first trimester, 19.6% at the second trimester, 17.4% at the third trimester, 17.6% at childbirth and 11.1% at 3 months postpartum [16]. It has been shown that the unadjusted prevalence of depression in women for whom the EPDS score was more than 12 were 14.1% in early pregnancy, 10.4% in late pregnancy and 8.1% in the postpartum period [18]. It has been reported that a high EPDS score in
Table 3. Correlations between VAS scores and EPDS scores among the 4 stages.
VAS score first
trimester trimester second trimester third postpartum one week
EPDS score
first trimester −0.100 0.285** 0.268* 0.067
second trimester 0.095 0.346** 0.380** 0.108
third trimester 0.039 0.212* 0.216* 0.132
one week postpartum 0.030 0.219* 0.059 0.197
DOI: 10.4236/health.2018.1012124 1656 Health
women with depression in early pregnancy continued to increase over the peri-natal period, indicating a worsening of mood over that time, although women for whom the EPDS score was less than 12 in early pregnancy experienced an improvement of mood along with a decrease in EPDS scores throughout preg-nancy and the postpartum period [19]. Women in early pregnancy are likely to be physically and psychologically unstable and depressive. Since the physical condition of pregnant women becomes stable with advance of gestation and since a stable physical condition leads to a stable mental condition, the EPDS score in early pregnancy decreases in mid- and late pregnancy. Although the EPDS score has been reported to decrease in the postpartum period in other countries, an increase in the EPDS score in postpartum women has been re-ported in Japan. A score of 9 points is used as a cut-off value of EPDS in Japan [14]. Ishikawa et al. reported that the mean EPDS scores (proportions of women for whom the EPDS score was more than 9) were 4.5 (14.3%) in early pregnancy, 3.7 (11.8%) in late pregnancy and 4.5 (16.4%) at 5 days postpartum, indicating that the EPDS score increases in the postpartum period [6]. Our results are in line with the results of that study. The reason for increase in women with a high EPDS score at postpartum may be an isolated child-rearing environment since support and care for postpartum women are insufficient due to an increase in women of advanced maternal age [20].
We showed that the EPDS score in early pregnancy was correlated with EPDS scores in mid- and late pregnancy and at one week postpartum, suggesting that the mental health condition in early pregnancy is associated with the mental health condition thereafter. It has been reported that 83% of women with persis-tent depressive symptoms were identified by EPDS assessment at 12 weeks of gestation [21]. Given that the mental health condition during pregnancy has an influence on the mental health condition after delivery, it is important to eva-luate the EPDS score in early pregnancy as a predictive indicator of the EPDS score after delivery. Continuous support throughout pregnancy and in the post-partum period may be needed for women for whom the EPDS score in early pregnancy is more than 9.
On the other hand, we showed that the VAS score in early pregnancy in-creased toward late pregnancy, followed by a decrease in the postpartum period. The change in the VAS score in the present study is consistent with changes found in previous studies [22] [23] [24]. Support for LBPP should be given to women from mid-pregnancy to the postpartum period, during which the VAS score is increasing.
DOI: 10.4236/health.2018.1012124 1657 Health
depression [26]. The association of LBPP with mental health condition found in the present study is consistent with the results in previous studies. During the period from mid-pregnancy to late pregnancy, in which there is an increase in VAS score, pregnant women with a depressive mood are likely to have LBPP and pregnant women with a high VAS score are likely to have a depressive mood. Thus, evaluation of mental status is needed for pregnant women with a high VAS score for LBPP to provide health guidance during the mid- and late periods of pregnancy. The reason for no significant association being found between EPDS and VAS scores at the first trimester may be the low VAS score at the first trimester, and the reason for no significant association being found between EPDS score at one week postpartum and VAS might be that various factors oth-er than LBPP affect EPDS score at one week postpartum.
Also, EPDS scores during early and mid-pregnancy were correlated with VAS score at mid-pregnancy, and VAS score at mid-pregnancy was correlated with EPDS scores at late pregnancy and in the postpartum period. Mental health con-ditions at early and mid-pregnancy are associated with LBPP at mid-pregnancy, and LBPP at mid-pregnancy is associated with mental health conditions thereaf-ter. Thus, there is a close mutual relationship between mental symptoms and LBPP as a physical symptom during pregnancy and in the early postpartum pe-riod. Women with depression are likely to have chronic pain. It has been re-ported that preoperative depression before Cesarean section was associated with chronic post-surgical pain at 3 months postpartum [27]. Also, Borges et al. re-ported that preoperative anxiety increases the risk of moderate-severe postoper-ative pain in women who received Cesarean section [28]. Based on these results, an unstable mental condition is considered to be a factor enhancing subsequent pain. An unstable mental state at early pregnancy may be a factor enhancing LBPP at a later stage of pregnancy. Stability of mental health at early pregnancy may prevent exacerbation of LBPP at mid and late pregnancy. On the other hand, it has been reported that perineal pain at 3 - 5 days postpartum predicted depressive symptoms at 3 months postpartum [29], suggesting that physical pain influences the mental health condition thereafter. Exacerbation of pain may be involved in psychological instability. It is important to evaluate mental health by the EPDS score as well as the VAS score for LBPP in early pregnancy and to prevent LBPP in pregnancy and in the postpartum period.
This study has a strength since the study is a prospective design. However, a limitation of this study is that the sample size is relatively small. The characteris-tics of women without LBPP should be clarified by an increase in the sample size. Further prospective study from the first trimester to three months postpar-tum may be needed.
5. Conclusion
DOI: 10.4236/health.2018.1012124 1658 Health
with the mental health condition thereafter. Stability of mental health in early pregnancy may be important for the management of LBPP during pregnancy and in the postpartum period.
Acknowledgements
The authors are grateful to doctors, midwives and medical assistants in Shikoku Medical Center for Children and Adults for supporting this research. We also thank the women who participated in this study.
Ethics Approval and Consent to Participate
The study protocol was reviewed and approved by the ethics Review Board of Tokushima University Hospital (approval no. 2201). This study was reviewed by the Ethics Review Board of a birth center in Kagawa Prefecture in Japan.
Conflicts of Interest
The authors declare no conflicts of interest regarding the publication of this pa-per. This study is a part of “Prospective study on back pain and its related factors during pregnancy to postpartum” (16K12104) which has been conducted under Grant-in-Aid for Scientific Research (c) Japan Society for the Promotion of Science.
References
[1] Uemura, Y., Yasui, T., Horike, K., Maeda, K., Uemura, H., Haku, M., Sakae, R. and Matsumura, K. (2017) Association of Low Back and Pelvic Pain at the Second Tri-mester with That at the Third TriTri-mester and Puerperium in Japanese Pregnant Women. Journal of Pregnancy Child Health, 4.
http://doi.org/10.4172/2376-127X.1000351
[2] Olsson, C.B., Nilsson-Wikmar, L. and Grooten, W.J. (2012) Determinants for Lumbopelvic Pain 6 Months Postpartum. Disability and Rehabilitation, 34, 416-422. https://doi.org/10.3109/09638288.2011.607212
[3] Stomp-van den Berg, S.G., van Poppel, M.N., Hendriksen, I.J., Bruinvels, D.J., Ue-gaki K., de Bruijne, M.C. and van Mechelen, W. (2007) Improving Return-to-Work after Childbirth: Design of the Mom@Work Study, a Randomised Controlled Trial and Cohort Study. BMC Public Health, 7, 1-10.
https://doi.org/10.1186/1471-2458-7-43
[4] Stomp-van den Berg, S.G., Hendriksen, I.J., Bruinvels, D.J., Twisk, J.W., van Me-chelen, W. and van Poppel, M.N. (2012) Predictors for Postpartum Pelvic Girdle Pain in Working Women: The Mom @ Work Cohort Study. Pain, 153, 2370-2379.
https://doi.org/10.1016/j.pain.2012.08.003
[5] Elden, H., Gutke, A., Kjellby-Wendt, G., Fagevik-Olsen, M. and Ostgaard, H.C. (2016) Predictors and Consequences of Long-Term Pregnancy-Related Pelvic Gir-dle Pain: A Longitudinal Follow-Up Study. BMC Musculoskeletal Disorders, 17, 1-13. https://doi.org/10.1186/s12891-016-1154-0
DOI: 10.4236/health.2018.1012124 1659 Health https://doi.org/10.1016/j.jpsychores.2011.02.001
[7] Ministry of Health, Labor and Welfare (2017) Release of Results of the 13th Report on Verification of Child Abuse Cases Which Resulted in Deaths.
http://www.mhlw.go.jp/stf/houdou/0000173365.html
[8] Ministry of Health, Labor and Welfare (2016) The Materials of the Study Meeting on the 6th Perinatal Medical System. (In Japanese)
http://www.mhlw.go.jp/stf/shingi2/0000134653.html
[9] Chang, H.Y., Lai, Y.H., Jensen, M.P., Shun, S.C., Hsiao, F.H., Lee, C.N. and Yang, Y.L. (2013) Factors Associated with Low Back Pain Changes during the Third Tri-mester of Pregnancy. Journal of Advanced Nursing, 70, 1054-1064.
https://doi.org/10.1111/jan.12258
[10] Perlen, S., Woolhouse, H., Gartland, D. and Brown, S.J. (2013) Maternal Depression and Physical Health Problems in Early Pregnancy: Findings of an Australian Nulli-parous Pregnancy Cohort Study. Midwifery, 29, 233-239.
https://doi.org/10.1016/j.midw.2012.01.005
[11] Gutke, A., Josefsson, A. and Oberg, B. (2007) Pelvic Girdle Pain and Lumbar Pain in Relation to Postpartum Depressive Symptoms. Spine, 32, 1430-1436.
https://doi.org/10.1097/BRS.0b013e318060a673
[12] Uemura, Y., Yasui, T., Horike, K., Maeda, K., Uemura, H., Haku, M., Sakae, R. and Matsumura, K. (2017) Factors Related with Low Back Pain and Pelvic Pain at the Early Stage of Pregnancy in Japanese Women. International Journal of Nursing and Midwifery, 9, 1-9. https://doi.org/10.5897/IJNM2016.0249
[13] Cox, J.L., Holden, J.M. and Sagovsky, R. (1987) Detection of Postnatal Depression. Development of the 10-Item Edinburgh Postnatal Depression Scale. British Journal of Psychiatry, 150, 782-786.https://doi.org/10.1192/bjp.150.6.782
[14] Okano, T., Murata, M., Masuji, F., Tamaki, R., Nomura, J. and Miyaoka, H. (1996) Validation and Reliability of Japanese Version of EPDS (Edinburgh Postnatal De-pression Scale). Archives of Psychiatric Diagnosis and Clinical Evaluation, 7, 525-533.
[15] Yamashita, H., Yoshida, K., Nakano, H. and Tashiro, N. (2000) Postnatal Depres-sion in Japanese Women. Detecting the Early Onset of Postnatal DepresDepres-sion by Closely Monitoring the Postpartum Mood. Journal of Affective Disorders, 58, 145-154.https://doi.org/10.1016/S0165-0327(99)00108-1
[16] Figueiredo, B. and Conde, A. (2011) Anxiety and Depression in Women and Men from Early Pregnancy to 3-Months Postpartum. Archives of Women’s Mental Health, 14, 247-255. https://doi.org/10.1007/s00737-011-0217-3
[17] Shakeel, N., Eberhard-Gran, M., Sletner, L., Slinning, K., Martinsen, E.W., Holme, I. and Jenum, A.K. (2015) A Prospective Cohort Study of Depression in Pregnancy, Prevalence and Risk Factors in a Multi-Ethnic Population. BMC Pregnancy Child-birth, 15, 5.https://doi.org/10.1186/s12884-014-0420-0
[18] Lydsdottir, L.B., Howard, L.M., Olafsdottir, H., Thome, M., Tyrfingsson, P. and Si-gurdsson, J.F. (2014) The Mental Health Characteristics of Pregnant Women with Depressive Symptoms Identified by the Edinburgh Postnatal Depression Scale. Journal of Clinical Psychiatry, 75, 393-398. https://doi.org/10.4088/JCP.13m08646
[19] Bowen, A., Bowen, R., Butt, P., Rahman, K. and Muhajarine, N. (2012) Patterns of Depression and Treatment in Pregnant and Postpartum Women. The Canadian Journal of Psychiatry, 57, 161-167.https://doi.org/10.1177/070674371205700305
Symp-DOI: 10.4236/health.2018.1012124 1660 Health
toms in Older Japanese Primiparas at 1 Month Post-Partum: A Risk-Stratified Analysis. Japan Journal of Nursing Science, 13, 147-155.
https://doi.org/10.1111/jjns.12099
[21] Truijens, S.E.M., Spek, V., van Son, M.J.M., GuidOei, S. and Pop, V.J.M. (2017) Different Patterns of Depressive Symptoms during Pregnancy. Archives of Wom-en’s Mental Health, 20, 539-546.https://doi.org/10.1007/s00737-017-0738-5
[22] Mohseni-Bandpei, M.A., Fakhri, M., Ahmad-Shirvani, M., Bagheri-Nessami, M., Khalilian, A.R., Shayesteh-Azar, M. and Mohseni-Bandpei, H. (2009) Low Back Pain in 1,100 Iranian Pregnant Women: Prevalence and Risk Factors. The Spine Journal, 9, 795-801.https://doi.org/10.1016/j.spinee.2009.05.012
[23] Thorell, E. and Kristiansson, P. (2012) Pregnancy Related Back Pain, Is It Related to Aerobic Fitness? A Longitudinal Cohort Study. BMC Pregnancy Childbirth, 12, 30. https://doi.org/10.1186/1471-2393-12-30
[24] Ostgaard, H.C., Roos-Hansson, E. and Zetherström, G. (1996) Regression of Back and Posterior Pelvic Pain after Pregnancy. Spine, 21, 2777-2780.
https://doi.org/10.1097/00007632-199612010-00013
[25] Tetsunaga, T., Misawa, H., Tanaka, M., Sugimoto, Y., Tetsunaga, T., Takigawa, T. and Ozaki, T. (2013) The Clinical Manifestations of Lumbar Disease Are Correlated with Self-Rating Depression Scale Scores. Journal of Orthopaedic Science, 18, 374-379.https://doi.org/10.1007/s00776-013-0363-8
[26] Apter, G., Devouche, E., Garez, V., Valente, M., Genet, M.C., Gratier, M. and Be-laisch-Allart, J. (2013) Pregnancy, Somatic Complaints and Depression: A French Population-Based Study. The European Journal of Obstetrics & Gynecology and Reproductive Biology, 71, 35-39.https://doi.org/10.1016/j.ejogrb.2013.08.013
[27] Jin, J., Peng, L., Chen, Q., Zhang, D., Ren, L., Qin, P. and Min, S. (2016) Prevalence and Risk Factors for Chronic Pain Following Cesarean Section: A Prospective Study. BMC Anesthesiology, 16, 99.https://doi.org/10.1186/s12871-016-0270-6
[28] Borges, N.C., Pereira, L.V., de Moura, L.A., Silva, T.C. and Pedroso, C.F. (2016) Predictors for Moderate to Severe Acute Postoperative Pain after Cesarean Section. Pain Research and Management, 2016, Article ID: 5783817.
https://doi.org/10.1155/2016/5783817