ORIGINAL RESEARCH
Influence of Partial Volume on Venous Output and
Arterial Input Function
I. van der Schaaf E.-J. Vonken A. Waaijer B. Velthuis M. Quist T. van Osch
BACKGROUND: CT perfusion (CTP) is an important diagnostic tool for the imaging of cerebral hemo-dynamics. To obtain quantitative values of cerebral blood volume (CBV), blood flow (CBF), and mean transit time (MTT), measurement of the arterial input function (AIF) is required. To correct for partial volume effects (PVEs), it is common to normalize the AIF with respect to the venous output function (VOF). This correction assumes that measurement of the VOF is unhampered by PVEs. The purpose of this study was to evaluate the effect of PVE on the measurement of the AIF and VOF and, consequently, on the absolute perfusion parameters.
METHODS: In 10 patients the mean area under the curve (AUC) of the AIF and VOF were quantified for 3-, 6-, and 12-mm-thick sections. Differences in the mean (1) AUC of the VOF, (2) AUC of the AIF, and (3) width of the AIF were compared for the 3 section thicknesses, and the influence on the absolute values of CBV, CBF, and MTT were studied.
RESULTS: With thinner sections, the AUC of the VOF and the AIF increased significantly and the width of the AIF decreased slightly. Differences in AUC between the 3 section thicknesses were larger for the AIF than for the VOF.
CONCLUSION:PVEs affect not only the AIF, but also the VOF. This results in an overestimation of CBV and CBF when a thicker section is used. To avoid PVE, VOF measurements should be performed at lower section thicknesses.
C
T perfusion (CTP) is an important diagnostic tool for im-aging of cerebral hemodynamics. It has a predictive value for stroke outcome1,2 and has successfully been applied to other brain pathologies. Examples are the detection and eval-uation of the severity of vasospasm in patients with a sub-arachnoid hemorrhage3and the evaluation of cerebrovascular reserve capacity in patients with stenotic occlusions of the in-ternal carotid artery.4CTP yields information at not only the cerebral perfusion level, but also the level of vasodilation (via the cerebral blood volume [CBV]), the perfusion pressure (re-lated to the reciprocal of the mean transit time [MTT], the average time taken by the blood to cross the capillary net-work,5and the efficiency of the blood supply (via the time to peak [TTP]). Like the identification of the penumbra in stroke patients2or identification of patients developing secondary ischemia after subarachnoid hemorrhages,3for most applica-tions of CTP it is essential to measure the perfusion quantita-tively (ie, to report absolute values).CTP is performed by monitoring the first passage of a bolus of contrast material through brain tissue. From these mea-surements relative estimates of the perfusion parameters can be obtained, but quantification requires the measurement of the arterial input function (AIF). In arteries such as the ante-rior cerebral artery (ACA) or median cerebral artery (MCA) the shape of the AIF can be measured accurately; however, because of partial volume effects (PVEs), the area under the curve (AUC) of the AIF (AUCAIF) will be underestimated. To correct for these PVEs, the AUCAIFis normalized with respect to the area under the venous output function (VOF) as mea-sured in a large vein, such as the superior sagittal sinus (SSS).
This correction assumes that the measurement of the VOF is unhampered by PVEs, both in the in-plane and through-plane directions. In clinical practice, however, relatively thick sec-tions are chosen to obtain a sufficient signal intensity-to-noise ratio (SNR) for the evaluation of the passage of the bolus through the tissue. The use of these thick sections might thus violate the assumption that PVEs do not affect the VOF, thereby causing systematic quantification errors in the perfu-sion parameters and reduced reproducibility. Such errors would affect all quantitative perfusion CT methods that scale the AIF by the AUC of the VOF. The purpose of this study was to evaluate the effect of the section thickness on the measure-ment of the AIF and VOF and, consequently, on the absolute perfusion parameters.
Theoretical Background
All methods quantifying cerebral perfusion from CT mea-sure temporal changes in signal intensity during the first pass of a bolus of an iodinated contrast agent. Changes in signal intensity from the baseline signal intensity (that is, before the arrival of the contrast agent) are linearly related to the concen-tration of the contrast agent in that voxel. The CBV is then calculated as the ratio of the AUC of the first passage through the tissue to that of the AUC of the first passage through an artery6,7with a correction factor,H,to account for the differ-ence in the hematocrit in small versus large vessels:
1) CBV⫽HAUCTISSUE/AUCAIF.
Calculation of CBV, therefore, requires knowledge of con-trast enhancement in an arterial pixel devoid of PVEs. When imaging at the level of the basal ganglia, however, no arterial pixel can be found that is unaffected by PVEs. A pixel in the center of one of the great sinuses (eg, the SSS) is therefore often preferred as reference because the AUC of the first passage of contrast agent through a vein is equal to the AUC of an artery Received February 23, 2005; accepted after revision June 5.
From the Department of Radiology (I.v.d.S., E.J.V., A.W., B.V., T.v.O.), University Medical Center Utrecht, Philips Medical Systems (M.Q.), Best, the Netherlands, and the Department of Radiology (T.v.O.), Leiden University Medical Center, Leiden, the Netherlands.
when the blood-brain barrier is intact. Effectively this means that the CBV is inversely related to the AUC of the VOF:
2) CBV⫽HAUCTISSUE/AUCVOF.
The MTT is calculated by means of deconvolution analy-sis.6,7Convolution describes the tissue contrast enhancement curve (CTISSUE) at timetas a function of the arterial input curve (CART), the tissue residue functionR(t), and the cerebral blood flow (CBF; blood volume per unit time):
3) CTISSUE(t)⫽CART共t兲VR(t)䡠CBF.
Conversely, knowledge of the tissue and arterial curve al-lows for the inverse operation, or deconvolution, which results inR(t), the “residue function.” From the residue function, the MTT can be derived.8In practice, the MTT can be thought of as the difference between the width of the tissue curve and the width of the AIF.
The calculation of the CBF is based on the central volume principle,9-11which states that the CBF is equal to the ratio of CBV and MTT:
4) CBF⫽CBV/MTT.
Consequently, the CBF is inversely related to the AUC of the VOF and directly related to the widths of the AIF and the tissue curve.
From equations (2) and (4) it can be seen that an underes-timation of the AUC of the VOF as caused by PVEs would translate to an overestimation of the CBV and thus also to an overestimation of the CBF. In this perspective, a section thick-ness that is thin enough to guarantee an accurate measure-ment of the AUFVOFhas to be chosen. A thinner section thick-ness, however, would decrease the SNR, thus degrading image quality and a compromise on the optimal section thickness has to be found. Theoretically, only negligible effects due to PVEs are expected on the width of the AIF.12
Materials and Methods
Experimental Design
To study whether PVEs of the VOF do occur for clinically used section thicknesses, the AUCs of the VOF were determined for 3 re-constructions of, respectively, 3-, 6-, and 12-mm-thick sections in 10 patients. For each patient, the AUCs were averaged over all sections with equal section thickness to obtain mean values. Differences in the mean AUC of the VOF for the 3-, 6-, and 12-mm-thick sections were tested by means of a pairedttest (SPPS, version 11, SPSS, Inc., Chi-cago, Ill).13The difference was considered statistically significant at P⬍.05. The AUCAIFand the width of the AIF were also compared for the 3 section thicknesses.
In addition, the optimal VOF and AIF within the stack of sections were selected and the AUC and width of the resulting curves were compared for the 3-, 6-, and 12-mm-thick sections; as in clinical prac-tice, the optimal VOF and AIF curves within the set of sections are used for the perfusion analysis. The best VOFs and AIFs were defined as the voxels with the largest AUC (AIF and VOF) and an early arrival time of the contrast agent (AIF). Differences were tested by means of pairedttest statistics.
Mean values of CBV, CBF, and MTT of the 10 patients were cal-culated for 3-, 6-, and 12-mm section thickness in regions of interest in the peripheral anterior flow territory at the level of the basal
gan-glia, containing both white and gray matter. Perfusion values were averaged over all sections with equal section thickness to obtain mean values. Regions with perfusion abnormalities were excluded from the analysis.
Patients
The CTP scans of 10 consecutive patients who underwent CTP in a single institution during a 2-week period were used for this study. Indications for scanning were screening for new aneurysms or growth of known aneurysms in 4 patients, suspicion of sinus thrombosis or dissection in 2 patients (which was not present in both patients), subarachnoid hemorrhage in 3 patients, and intracerebral hematoma in one patient. In these patients CT angiography (CTA) was indicated. To perform CTA, a timing scan is needed to measure the required scan delay. For the purpose of this and other studies, this conventional timing scan was replaced by the CTP scan, which provides perfusion images in addition to the same timing information. The performance of CTP was approved by the ethics committees of the University Hos-pital. Informed consent was obtained from all patients.
CTP Acquisition, Reconstruction, and Measurements
The imaging studies were performed on a 16-section spiral CT scanner (Philips Mx8000 LDT).
CTP source data were derived from sequential scans covering a 2.4-cm-thick section selected 4 cm above the sella turcica and angu-lated parallel to the meato-orbital line to contain the upper parts of the lateral ventricles and the basal ganglia. Forty milliliters of non-ionic contrast agent (Iopromide, Ultravist, 300 mg iodine/mL; Scher-ing, Berlin, Germany) was injected into the cubital vein (18-gauge needle) at a rate of 5 mL/s followed by a 40-mL saline flush at a rate of 5 mL/s by using a dual power injector (Stellant Dual CT injector; Medrad Europe, Beek, the Netherlands). The following parameters were used: 90 kVp, 150 mAs, 8⫻3 mm collimation, 512⫻512 matrix, 200 mm field of view, 1-second cycle time, UB filter, and standard resolution. To limit the analysis to the first passage of the contrast agent and thus eliminate recirculation effects, it is common to fit an analytical function through the concentration curves. In this study, a gamma variate function was used to fit the AIF and VOF.
Data were transferred to a Philips workstation for postprocessing. (We used Philips prototype software that was the predecessor of the extended Brilliance Workstation Perfusion software.) CTP scans were reconstructed at, respectively, 3-, 6-, and 12-mm-thick contiguous axial images, thus leading to, respectively, 8, 4, and 2 sections. There-after, a motion-correction algorithm was applied to correct for pa-tient motion, and the results were visually inspected to exclude the possibility of severe residual motion artifacts.
The AIF and the VOF were obtained semiautomatically with the user selecting vascular structures of interest and the computer algo-rithm choosing the optimal AIF and VOF based on the AUC and the time of arrival (only for the AIF). In each patient, the VOF was se-lected from the same vein for the different section thicknesses. Be-cause the inclusion of structures with high attenuation (eg, bone) would result in a baseline increase and thus an erroneously high AUC, the baseline attenuation as calculated as the mean attenuation value before contrast agent arrival was subtracted for each voxel from the passage curves when calculating the AUC. For all patients, the AUCs of the AIF and VOF and the width of the AIF were obtained for all sections of the 3-, 6-, and 12-mm series by drawing regions of interest in the ACA and one of the major sinuses (SSS, straight sinus, sigmoid sinus). The width of the AIF was defined as the full width at half
BRAIN
ORIGINAL
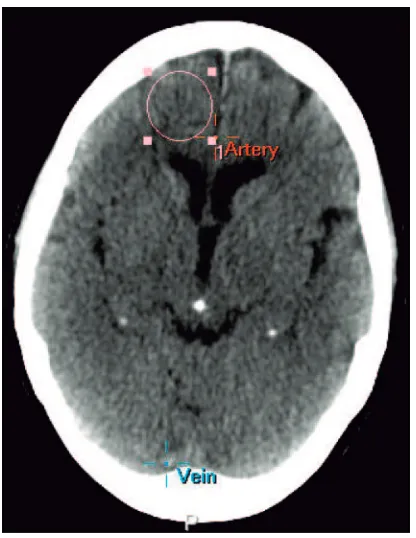
maximum of the fitted gamma variate function. Finally, circular re-gions of interest with a standard size of 2.5 cm in diameter were drawn for each section, in the peripheral anterior flow territory at the level of the basal ganglia on a standard location for all patients and each sec-tion thickness (Fig 1), containing both white and gray matter. All regions of interest were placed manually by one experienced observer (I.v.d.S.). In all patients, the perfusion in this area was not affected by infarction or blood.
Results
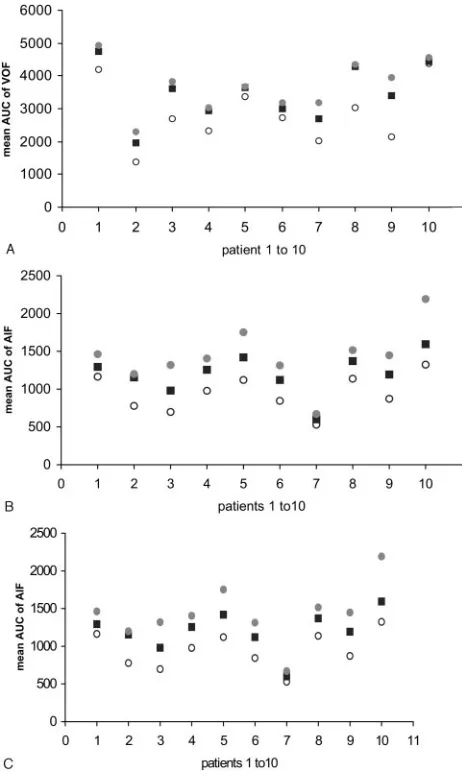
The mean AUC of the VOF and AIF are shown in Fig 1 and Table 1, for 12-, 6-, and 3-mm section thicknesses. With a smaller section thickness, the AUC of the VOF and the AIF increased, and Fig 2 shows that for all patients a smaller section thickness resulted in an equal or larger AUC for both the AIF and VOF. This increase was statistically significant for the mean AUC of 6- versus 12-mm, 3- versus 12-mm and 3- ver-sus 6-mm section thickness of both the VOF and AIF; how-ever, the difference between 6 and 3 mm became borderline significant when the optimal VOF was compared (Table 1, right columns). Figure 3 shows the raw attenuation curves of the optimal VOF for 3-, 6-, and 12-mm section thickness. The differences in AUC between the 3 section thicknesses were larger for the AIF than for the VOF. With a smaller section thickness, the width of the AIF decreased slightly. This dif-ference is statistically significant for the mean width of 3-versus 12-mm-thick sections. When the widths of the opti-mal AIF were compared, however, this difference was no longer significant.
Table 2 shows the mean values of perfusion parameters for different section thicknesses in the 10 patients. The mean CBV
and CBF decreased, and the mean MTT increased for smaller section thickness.
Discussion
CTP is considered a valuable method for the assessment of patients with acute stroke and has also been applied to other brain pathologies.11,12,14For these clinical implications, quan-titative perfusion parameters are essential. A requirement for the determination of quantitative values is that the AUCAIFis unhampered by PVEs. Because this requirement is not met in most CTP experiments, the AIF is normalized with respect to the VOF, and it is assumed that the VOF is unhampered by PVEs. In a previous article on the influence of AIF and VOF properties on perfusion parameters, the determination of the AIF and VOF showed to be a source of variability in the esti-mation of perfusion values.15We evaluated the influence of PVEs on the measurement of AIF and VOF and quantified the effect on absolute perfusion parameters. We observed that, for a section thickness of 6 mm or larger, PVEs affect not only the AIF, but also the VOF, leading to an overestimation of CBF and CBV.
To investigate the effect of section thickness on the AIF and VOF measurements and, consequently, on the quantitative perfusion parameters, the mean AUC of the AIF and VOF were determined for 3 reconstructions of, respectively, 3-, 6-, and 12-mm-thick sections in 10 patients. We observed in all subjects an increase in the AUC of both the AIF and VOF with decreasing section thickness. Selecting the optimal AUCVOF and AUCAIF, as occurs in clinical practice, yielded the same findings, except for the AUCVOF of 3 versus 6 mm, which became borderline significant. Although more prominent for the AIF, these differences were also significant for the VOF. This implies that the selection of a great vein instead of an artery diminishes, but does not solve, the problem of PVEs. The perfusion slab is commonly positioned at the level of the basal ganglia. When the perfusion slab is angulated parallel to the meato-orbital line, the SSS passes diagonally through the slab in most patients.
This obviously introduces PVEs, with the extent being de-pendent on the individual size and anatomy of the SSS and degree of angulation of the slab; however, other factors could also explain the observed effects. When a multisection tech-nique is used, the amount of attenuation can vary over the sections because of differences in beam hardening. This would result in an AUC of the VOF, which is consistently higher or lower for particular sections across the detector track. The influence of beam hardening is expected to be small, however, because the perfusion slab is only 2.4 cm thick and is not lo-cated near structures that are expected to cause the most severe beam hardening, such as the skull base or the protuberantia occipitalis. Another factor that could explain our findings is that the fit of the gamma variate function to the time-attenu-ation curve could behave differently for thinner sections be-cause of the increased noise level in thin sections. Such differ-ences would influence the shape and thus the AUC of the AIF and VOF. As can be seen in Fig 3, the SNR of the VOF at 3-mm-thick sections is high enough to guarantee a good fit. Therefore, it can be concluded that effects due to a low SNR in the fitting procedure are too small to explain the observed increase in the AUC of the VOF for thinner sections.
Fig 1.A circular region of interest with a standard size of 2.5 cm in diameter was drawn
[image:3.585.66.274.39.308.2]The section thickness had a slight effect on the width of the AIF, but selection of the optimal AIF, as occurs in clinical practice, resulted in insignificant differences in the width for the 3 section thicknesses. This means that the MTT is hardly influenced by the section thickness, because the MTT is
[image:4.585.53.534.59.204.2]di-rectly related to the width of the AIF. In theory, a somewhat wider AIF could be explained by the incorporation of tissue in the arterial voxels because the wider tissue function combines with the AIF function; however, the gamma variate function fit, which restricts the AIF to the first pass of the bolus, would most likely eliminate these small effects. These results are in concordance with the findings of Kealey et al.15In that article, PVEs, which were intentionally induced by a more peripheral placement of the region of interest, significantly increased CBF and CBV, whereas the MTT was not significantly changed compared with central placement of the region of interest.
Table 2: Values for CBV, MT, and CBF in 12-, 6-, and 3-mm-thick sections
Section Thickness (mm)
CBV (mL/100 g)
12 4.3⫾1.53
6 3.7⫾1.15
3 3.1⫾0.99
CBF (mL/100 g/min)
12 61.1⫾15.7
6 48.6⫾12.5
3 34.4⫾8.07
MTT (s)
12 4.2⫾0.78
6 4.6⫾0.79
3 5.1⫾0.74
Note:—CBV indicates cerebral blood volume; CBF, cerebral blood flow; MTT, mean transit
time. Values are means⫾SD.
Table 1: Difference in AUC and width in 12-, 6-, and 3-mm-thick sections
Difference (%)
P Value
Difference (%)
P Value
Mean AUC VOF AUC of optimal VOF
6 vs 12 ⫹17 .017 6 vs 12 ⫹17 .014
3 vs 12 ⫹20 .004 3 vs 12 ⫹20 .009
3 vs 6 ⫹4 .006 3 vs 6 ⫹3 .056
Mean AUC AIF AUC of optimal AIF
6 vs 12 ⫹22 .000 6 vs 12 ⫹25 .000
3 vs 12 ⫹34 .000 3 vs 12 ⫹39 .000
3 vs 6 ⫹15 .004 3 vs 6 ⫹19 .003
Mean width AIF Width of optimal AIF
6 vs 12 ⫺7 .063 6 vs 12 ⫺1 .88
3 vs 12 ⫺8 .007 3 vs 12 ⫺2 .42
3 vs 6 ⫺2 .328 3 vs 6 ⫺1 .44
Note:—AUC indicates area under the curve; VOF, venous output function; AIF, arterial input function.
Fig 2.Mean AUC for the VOF (A), AIF (B) and mean widths of the AIF (C) for 12-mm (E),
6-mm (f), and 3-mm (●) section thickness in 10 patients. In all patients, a smaller section thickness results in an equal or larger AUC of the VOF (A) and AIF (B). The width of the AIF decreases slightly (C) with a smaller section thickness in most patients.
Fig 3.Raw attenuation curves of the optimal VOF for 12-mm (E), 6-mm (f), and 3-mm (●)
[image:4.585.295.528.64.383.2] [image:4.585.53.284.223.609.2] [image:4.585.302.532.570.711.2]The CBV and CBF values we observed for a 3-mm section thickness are comparable with the literature. Regions of inter-est were placed in both gray and white matter, and the mean CBV value of 3.1 and CBF value of 34.4 are in line with a series of positron-emission tomography (PET) and single-photon emission tomography studies in which CBV values ranged be-tween 4.6 and 2.0 for gray matter and 2.6 and 2.0 for white matter and CBF values ranged between 52.1 and 40.2 for gray matter and 20.3 and 26.0 for white matter.16-20
It has been suggested that the substantial variability in per-fusion values, related to manual region of interest placement and the definition of variables during postprocessing, could improve by use of a semiautomated system selecting the opti-mal time-attenuation curves.15,21Despite use of a semiauto-mated system, as we did in this study, considerable variation in perfusion values was still observed. By using thinner sections for the VOF determination, this variability decreased, which shows that PVEs do contribute significantly to this variability. Choosing the optimal section thickness in CTP is a trade-off between increasing PVEs with thicker sections and reduc-ing SNR with thinner sections. The increase in noise affects both the VOF and the measurement of the bolus passage through the brain tissue; however, the effects of the increased noise on the VOF are small, as can be concluded from Fig 3. Therefore, the VOF measurements should be performed on thin sections of approximately 3 mm to minimize PVEs. When the same, small section thickness for the measurement of the bolus passage through the brain tissue is used, however, the SNR on tissue level will become too low to obtain high-quality CTP images. Therefore, the optimal approach is to obtain the AIF and VOF at a small section thickness and to perform sub-sequent analysis on thicker sections. Both reconstructions can be obtained from the same dataset. Because the SNR of the VOF at a small section thickness is high enough, such an ap-proach does not need an increase in radiation dose. Eventu-ally, the choice of the section thickness in CTP should be val-idated against a gold standard. This could be done by either correlating the VOF measurements to blood-sampling data or validating the entire CTP procedure against another brain per-fusion imaging technique such as PET or stable xenon CT.22
Conclusion
In conclusion, both AIF and VOF are affected by PVEs in sections of 6 mm or thicker, which results in an overestimation of the CBV and CBF. The MTT is hardly influenced by section thickness. We recommend performing VOF measurement on thin sections of approximately 3 mm and conducting subse-quent analysis on thicker sections (for example, 10 mm).
References
1. Eastwood JD, Lev MH, Wintermark M, et al.Correlation of early dynamic CT perfusion imaging with whole-brain MR diffusion and perfusion imaging in acute hemispheric stroke.AJNR Am J Neuroradiol2003;24:1869 –75 2. Wintermark M, Reichhart M, Thiran JP, et al.Prognostic accuracy of cerebral
blood flow measurement by perfusion computed tomography, at the time of emergency room admission, in acute stroke patients.Ann Neurol2002;51: 417–32
3. Nabavi DG, LeBlanc LM, Baxter B, et al.Monitoring cerebral perfusion after subarachnoid hemorrhage using CT.Neuroradiology2001;43:7–16 4. Jain R, Hoeffner EG, Deveikis JP, et al.Carotid perfusion CT with balloon
occlusion and acetazolamide challenge test: feasibility.Radiology2004;231: 906 –13
5. Schumann P, Touzani O, Young AR, et al.Evaluation of the ratio of cerebral blood flow to cerebral blood volume as an index of local cerebral perfusion pressure.Brain1998;121:1369 –79
6. Axel L.Cerebral blood flow determination by rapid-sequence computed tomography: theoretical analysis.Radiology1980;137:679 – 86
7. Axel L.Tissue mean transit time from dynamic computed tomography by a simple deconvolution technique.Invest Radiol1983;18:94 –99
8. Wintermark M, Maeder P, Thiran JP, et al.Quantitative assessment of regional cerebral blood flows by perfusion CT studies at low injection rates: a critical review of the underlying theoretical models.Eur Radiol2001;11:1220 –30 9. Meier P. Zierler KL.On the theory of the indicator-dilution method for
mea-surement of cerebral blood flow and volume.J Appl Physiol1954;6:731– 44 10. Nabavi DG, Cenic A, Craen RA, et al.CT assessment of cerebral perfusion:
experimental validation and initial clinical experience.Radiology1999;213: 141– 49
11. Hoeffner EG, Case I, Jain R., et al.Cerebral perfusion CT: technique and clin-ical applications.Radiology2004;231:632– 44
12. Ko¨nig M.Brain perfusion CT in acute stroke: current status.Eur J Radiol
2003;45 (suppl 1):S11–22
13. Altman D.Practical statistic for medical research.London: Chapman & Hall;1991: 456
14. Latchaw RE, Yonas H, Hunter GJ, et al.Guidelines and recommendations for perfusion imaging in cerebral ischemia: a scientific statement for healthcare professionals by the writing group on perfusion imaging, from the Council on Cardiovascular Radiology of the American Heart Association.Stroke2003;34: 1084 –104
15. Kealey SM, Loving VA, Delong DM, et al.User-defined vascular input function curves: influence on mean perfusion parameter values and signal-to-noise ratio.Radiology2004;231:587–93
16. Leenders KL, Perani D, Lammertsma AA, et al.Cerebral blood flow, blood volume and oxygen utilization: normal values and effect of age.Brain1990; 113:27– 47
17. Ishikawa T, Kawamura S, Hadeishi H, et al.Cerebral blood flow and oxygen metabolism in hemiparetic patients with chronic subdural hematoma. Quan-titative evaluation using positron emission tomography.Surg Neurol1995;43: 130 –36
18. Pantano P, Baron JC, Lebrun-Grandie P, et al.Regional cerebral blood flow and oxygen consumption in human aging.Stroke1984;15:635– 41
19. Iida H, Akutsu T, Endo K, et al.A multicenter validation of regional cerebral blood flow quantitation using[123I]iodoamphetamine and single photon emission computed tomography.J Cereb Blood Flow Metab1996;16:781–93 20. Vonken EJ, van Osch MJ, Bakker CJ, et al.Measurement of cerebral perfusion
with dual-echo multi-slice quantitative dynamic susceptibility contrast MRI.
J Magn Reson Imaging1999;10:109 –17
21. Fiorella D, Heiserman J, Prenger E, et al.Assessment of the reproducibility of postprocessing dynamic CT perfusion data.AJNR Am J Neuroradiol2004;25: 97–107