www.impactjournals.com/oncotarget/ Oncotarget, Vol. 7, No. 25
Blockade of MCP-1/CCR4 signaling-induced recruitment of
activated regulatory cells evokes an antitumor immune response
in head and neck squamous cell carcinoma
Wei Sun1,2, Wei-Jin Li1,2, Fan-Qin Wei1,2,3, Thian-Sze Wong4, Wen-Bin Lei1,2,
Xiao-Lin Zhu1,2, Jian Li1,2, Wei-Ping Wen1,2
1Department of Otorhinolaryngology-Head and Neck Surgery, The First Affiliated Hospital, Sun Yat-sen University, Guangzhou,
China
2Institute of Otorhinolaryngology-Head and Neck Surgery, Sun Yat-sen University, Guangzhou, China
3Department of Otorhinolaryngology-Head and Neck Surgery, The Sixth Affiliated Hospital, Sun Yat-sen University,
Guangzhou, China
4Department of Surgery, Queen Mary Hospital, The University of Hong Kong, Hong Kong, China
Correspondence to: Wei-Ping Wen, email: wenwp@mail.sysu.edu.cn Wei Sun, email: sunw2@mail2.sysu.edu.cn
Keywords:CCR4, Treg, antitumor immunity, prognosis, head and neck squamous cell carcinoma Received: January 28, 2016 Accepted: April 26, 2016 Published: May 10, 2016
ABSTRACT
FoxP3+ regulatory T (Treg) cells have diverse functions in the suppression of antitumor immunity. We show that FoxP3hiCD45RA−CD4+ Treg cells [activated Treg (aTreg) cells] are the predominant cell population among tumor-infiltrating FoxP3+ T cells, and that high aTreg cell-infiltrating content is associated with reduced survival in patients with head and neck squamous cell carcinoma (HNSCC). In vitro studies have demonstrated that aTreg cells can suppress tumor-associated antigen (TAA) effector T cell immune responses in HNSCC. Moreover, C-C chemokine receptor 4 (CCR4) was specifically expressed by aTreg cells in the peripheral blood of HNSCC patients. Using a RayBiotech human chemokine antibody array, we showed that monocyte chemoattractant protein-1 (MCP-1), an endogenous CCR4-binding ligand, was specifically upregulated in the HNSCC microenvironment compared to the other four CCR4-binding ligands. Blocking MCP-1/CCR4 signaling-induced aTreg cell recruitment using a CCR4 antagonist evoked antitumor immunity in mice, and lead to inhibition of tumor growth and prolonged survival. Therefore, blocking aTreg cell trafficking in tumors using CCR4-binding agents may be an effective immunotherapy for HNSCC.
INTRODUCTION
Head and neck squamous cell cancer (HNSCC) is the sixth most common type of cancer [1]. Despite new treatment modalities that can improve overall quality of life, survival rates have not improved in the past 30 years [2]. Progression and recurrence of HNSCC and other malignancies are associated with severe immune
dysfunction [3, 4]. Tumor-infiltrating FoxP3+CD25+CD4+
regulatory T (Treg) cells can promote local tumor growth through exerting immunosuppressive activities against tumor-associated antigen (TAA) T cell responses [3, 5–11].
Thus, tumor-infiltrating Treg cells are a major obstacle in
cancer immunotherapy [9, 10, 12–14].
Studies involving depletion of Tregs have shown that depletion of CD25+ T cells enhances antitumor immune
responses [15, 16]. However, similar studies have failed to demonstrate these effects [17–19]. The apparent confusion regarding the role of Treg cells in suppressing antitumor
immune responses might be explained as follows.
Activated, nonsuppressive CD4+ T cells also express
CD25, and interleukin (IL)-2 produced by these cells is
required for CD8+ cytotoxic T cell expansion. Depletion
of CD25+ T cells may also reduce the number of activated
CD4+ T cells [17]. Additionally, in some animal studies,
total depletion of Treg cells has triggered autoimmunity
[20–22]. Thus, we aimed to block Treg cell trafficking and
accumulation in the tumor microenvironment, which could
provide an attractive therapeutic strategy against immune suppression.
The Sakaguchi group demonstrated that human
FoxP3+CD25+CD4+ T cells can be divided into the following
three functionally distinct subsets on the basis of CD45RA,
Foxp3, and CD25 expression: (i) FoxP3loCD45RA+CD4+
resting Treg (rTreg) cells, which are CD25++, (ii)
FoxP3hiCD45RA–CD4+ activated Treg (aTreg) cells, which
are CD25+++, and (iii) cytokine-secreting FoxP3loCD45RA–
CD4+ non-Treg (nTreg) cells, which are CD25++ [23].
We recently reported an increase in aTreg cells, which are highly suppressive, and a decrease in rTreg cells in HNSCC patients. Although there was also an increase in nTreg cells, these cells did not have immune-suppressive activities [24, 25]. Thus, we postulated that preventing the accumulation of aTreg cells within a tumor could evoke and enhance antitumor immune responses.
Preventing the accumulation of circulating aTreg cells in a tumor site requires an understanding of the mechanisms that mediate the recruitment of these cells within HNSCC tissues. Chemokine receptors are one class of proteins that could direct Treg cell migration to tumor
sites by sensing a specific chemokine milieu [26].
In this study, we evaluated the clinical importance
of tumor-infiltrating aTreg cells in HNSCC patients. We found that the C-C chemokine receptor (CCR) 4 was
predominantly expressed on aTreg cells compared to rTreg
and nTreg cells, FoxP3–CD4+ T cell subsets, and other types
of immune cells, indicating that CCR4-binding agents could be used to selectively block aTreg cell trafficking. Additionally, we showed that MCP-1/CCR4 signaling induced aTreg cell trafficking in tumors. Blockade of aTreg cell trafficking augmented the antitumor immune response thereby preventing xenograft tumor growth and prolonging
mouse survival.
RESULTS
Accumulation of aTreg cells in HNSCC tissue accelerates disease progression and predicts poor survival
We first analyzed the prevalence of tumor-infiltrating
FoxP3hiCD45RA−CD4+ aTreg cells in 19 clinical HNSCC
specimens. The majority of tumor-infiltrating FoxP3+
T cells were FoxP3hiCD45RA−CD4+ aTreg cells (Fr. II)
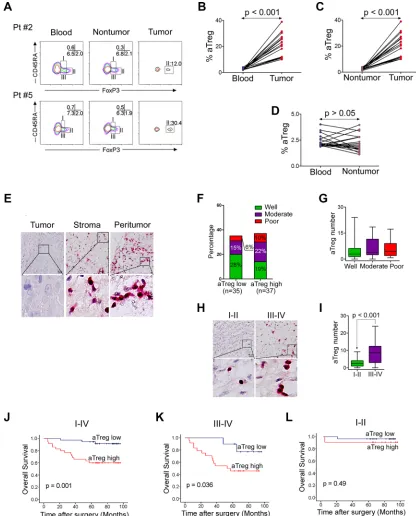
(Figure 1A). Moreover, the frequency of these aTreg cells in tumors was significantly higher than in PBMCs and adjacent nontumor tissues (P < 0.001) (Figure 1B–1D).
Because the various subtypes of HNSCC have
different etiologies and survival rates, we examined 72 patients with laryngeal squamous cell cancer (LSCC), the
most common type of HNSCC, in this study (Table 1).
Double immunohistochemical staining revealed
substantial infiltration of aTreg cells in the peritumoral area and stroma of tumors (Figure 1E). All
tumor-infiltrating FoxP3+ cells were CD25+ T cells, while 93.6
± 8.8% of CD25+ T cells were FoxP3+ cells in the tumor
tissue. The median level of aTreg cell infiltration was 3.75 (range: 0–24) in the whole population. When the median value was used as a cutoff to define low and high levels of aTreg cell infiltration, the percentage of tumor differentiation was indicated (Figure 1F). We did not find a correlation between the infiltration level of aTreg cells and pathological stage (Figure 1G). However, the level of aTreg cell infiltration in patients at early clinical
stages (I and II) was lower than that at late clinical stages (III and IV) (P < 0.001) (Figure 1H, 1I) (Supplementary Table 1).
We hypothesized that tumor-infiltrating aTreg cells
would adversely correlate with survival. In univariate analysis, the low level group was associated with a longer survival time (p = 0.001) (Figure 1J). Survival was still significantly different for the group at stages III and IV
(p = 0.036; median: 9.75) (Figure 1K), but not stages I
and II (P = 0.49; median: 2.50)(Figure 1L). Therefore, an increase in the number of tumor-infiltrating aTreg cells was a significant predictor of reduced survival in patients
with LSCC.
In a Cox multivariate analysis, only two variables influenced the overall survival probability: clinical stage
(p = 0.04; relative risk: 1.65) and the level of infiltration of
aTreg cells (p = 0.035; relative risk: 4.05; Supplementary Table 2). Differences in treatment modalities and other
factors known to correlate with survival were included in
this model and did not change the significance of these variables.
aTreg cells suppress TAA immunity in vitro
To evaluate the suppressive functions of aTreg cells
in TAA immunity, immature DCs were loaded with soluble
antigens from a cancer cell lysate (SNU899 laryngeal cancer cell line), and then co-cultured with autologous
lymphocytes, which induced specific T cell activation as expected (Supplementary Figure 1). This induction of
TAA CD4+ and CD8+ T cell proliferation was markedly
inhibited by allogeneic aTreg cells that were prepared as described previously [24, 25] (Figure 2A–2C). Moreover,
the frequencies of interferon (IFN)-γ+, IL-2+ and tumor
necrosis factor (TNF)-α+CD4+ T cells were reduced by
aTreg cells (Figure 2D–2F). The Th1 subset (IFN-γ+IL-2+
and IFN-γ+TNF-α+) decreased by more than 50% when
aTreg cells were added to the co-culture system (Figure 2G, 2H). We quantified the number of cytokine-secreting
cells per well in 96-well plates and determined that the
numbers of IFN-γ+, IL-2+, TNF-α+, IFN-γ+IL-2+, and
IFN-γ+TNF-α+ cells were significantly reduced in the presence
of aTreg cells (Figure 2I, P < 0.01 for all).
Finally, the cytotoxicity of antigen-loaded autologous immature DCs was assessed because the major histocompatibility complex (MHC) could be matched to
Figure 1: Phenotype and clinical implications of tumor-infiltrating Treg cells. (A–D) Predominant infiltration of aTreg cells
into HNSCC tissues. (A)CD4+ T cells from peripheral blood, adjacent nontumor sites, and tumor sites were fractionated into subpopulations based on the expression of CD45RA and FoxP3. The frequency of CD4+ T cells in each fraction was analyzed. Data from two representative patients are shown. (B–D) Comparison of the frequency of aTreg cells within peripheral blood, adjacent nontumor sites, and tumor sites
(n = 19). (E) Immunohistochemistry of aTreg cells in LSCC samples (n = 72). Representative images showing staining of aTreg cells within the tumor, stroma, and peritumor sites are shown. Brown: FoxP3; Red: CD25. Scale bars: 30 μm. The lower panels are magnified images of the boxed area in the corresponding upper panel. (F) Comparison of the percentage of differentiation of tumors with low levels of aTreg cell
infiltration compared to those with high levels. (G) Box plot showing quantitative evaluation of aTreg cell infiltration. Statistical differences between the three groups were analyzed using Kruskal-Wallis tests. (H–I)The level of aTreg cell infiltration in patients with early-stage
cells resulted in a decrease in the average percentage of
cytotoxicity from 42.3% to 12.5% (Figure 2J, 2K, P < 0.05),
indicating that aTreg cells blocked the protective effects of
T cells in the tumor. These data indicated that aTreg cells suppressed TAA effector T cell immunity in patients with HNSCC.
CCR4 is predominantly expressed on aTreg cells
To identify proteins involved in the recruitment of circulating aTreg cell to HNSCC tumors, we compared
the expression of CCR4, CCR5, CCR6, CCR7, and
C-X-C chemokine receptor (CXCR) 4 [3, 7, 26] in
circulating FoxP3+CD25+CD4+ Treg cells from HNSCC
patients (Supplementary Figure 2). We then focused
on the expression of these chemokine receptors on
FoxP3+CD25+CD4+ T cell subsets and FoxP3−CD4+ T
cells. The results showed that chemokine receptor-positive
T cells were present in both the FoxP3+ and FoxP3− T
cell fractions (Figure 3A). When FoxP3+ T cells were
classified into three subsets according to FoxP3 and
CD45RA expression [24, 25], only FoxP3hiCD45RA−
aTreg cells (Fr. II) predominantly expressed CCR4;
FoxP3loCD45RA+ rTreg cells (Fr. I) exhibited low CCR4
expression and FoxP3loCD45RA− non-Treg cells (Fr. III)
exhibited moderate expression. Among the FoxP3− cells,
some CD45RA−CD4+ memory and activated T cells (Fr.
IV) expressed CCR4, while CD45RA+CD4+ naive T cells
(Fr. V) did not (Figure 3B). Analysis of the expression of
four other chemokine receptors (CCR5, CCR6, CCR7, and CXCR4) revealed that the expression of these chemokine
receptors on the above CD4+ T cell fractions did not show
the same pattern as CCR4. Specifically, aTreg cells (Fr. II) and the four other fractions (Fr. I, III,IV, and V) exhibited low CCR5 and CCR6 expression (Figure 3B). Although high expression of CCR7 and CXCR4 was observed in aTreg cells, the other four fractions exhibited high expression (Figure 3B), indicating that CCR7 and CXCR4 could not be used for selective blockade of aTreg cell trafficking in tumors. Mean fluorescence intensity (MFI) and frequency analysis of multiple samples of peripheral blood mononuclear cells (PBMCs) from HNSCC patients showed
similar patterns of chemokine receptor expression in FoxP3+
subsets (Figure 3C, 3D). Moreover, PBMCs from healthy individuals showed similar patterns of CCR4 expression in
FoxP3+ subsets (Supplementary Figure 3).
To confirm that CCR4 blockade could be used to selectively prevent circulating aTreg cell trafficking, we analyzed the expression of CCR4 on various types of
immune cells. The results indicated that CD8+ T cells,
activated CD4+ T cells, natural killer (NK) cells, CD14+
monocytes/macrophages, dendritic cells (DCs), and B cells did not significantly express CCR4 (Supplementary Figure 4). Finally, we compared the expression of CCR4 on HNSCC tumor-infiltrating aTreg cells and matched
circulating aTreg cells from 18 HNSCC patients. These
[image:4.612.58.561.67.338.2]results demonstrated that tumor-infiltrating aTreg cells predominantly expressed CCR4, which was consistent
Table 1: Clinicopathological features of LSCC patients
No. cases %
Gender Male 68 94.40
Female 4 5.60
Age (year) < 61 35 48.61
≥ 61 37 51.39
Tumor grade G1 34 47.22
G2 27 37.50
G3 11 15.28
Tumor status T1–2 42 58.33
T3–4 30 41.67
Nodal status N0 58 80.56
N1–2 14 19.44
Stage (UICC 2008) I–II 38 52.78
III–IV 34 47.22
M stage M0 72 100.00
M1 0 0.00
with the expression pattern in circulating aTreg cells
(Supplementary Figure 5). Thus, inhibition of CCR4 blocked aTreg cell trafficking in HNSCC.
MCP-1 is highly expressed in the HNSCC microenvironment
CCR4 is a receptor for monocyte chemoattractant
protein-1 (MCP-1), regulated on activation, normal T
cell expressed and secreted (RANTES), macrophage inflammatory protein-1a (MIP-1a), thymus and activation regulated chemokine (TARC), and macrophage-derived
chemokine (MDC). We investigated whether the expression
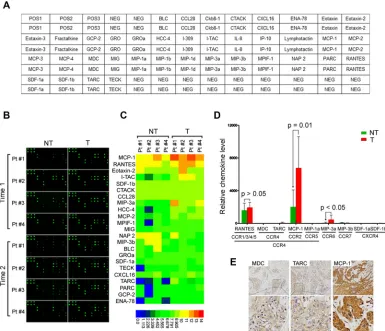
[image:5.612.74.534.217.620.2]one of these endogenous CCR4-binding ligands was specifically increased in the HNSCC microenvironment. We used antibody arrays (RayBiotech) to screen the levels of 38 chemoattractant factors (Figure 4A, 4B) in paired tumor and adjacent nontumor tissues from four HNSCC patients. Approximately 23 secreted factors were detected in both tumor tissues and adjacent nontumor tissues (Figure 4C). Interestingly, among the five chemoattractant ligands for CCR4, only MCP-1 was increased in tumor tissues compared with adjacent nontumor tissues, while RANTES, MIP-1a, TARC, and MDC were not. The expression of CCR5, CCR6, CCR7, and CXCR4 ligands was low or undetectable (Figure 4D). To confirm endogenous MCP-1
Figure 2: aTreg cells inhibit TAA immunity in vitro.(A–C)Inhibition of TAA T cell proliferation by aTreg cells. Antigen-loaded
mature DCs (TAA-mDCs) were added to autologous T cells in the presence of aTreg cells. Six days after the second stimulation, (A) CD4+ and (B) CD8+ T cell proliferation were assessed by flow cytometry. (C) Statistical comparisons were performed using Student’s t-tests.
Figure 3: CCR4 is predominantly expressed on aTreg cells in HNSCC patients. (A) CCR4, CCR5, CCR6, CCR7, and CXCR4 expression by subpopulation of FoxP3+ Treg cells in PBMCs from HNSCC patients.(B) The expression of CCR4, CCR5, CCR6, CCR7, and CXCR4 was evaluated in each fraction of CD4+ T cells. Representative data from 50 HNSCC patients are shown. (C) Mean fluorescence intensity (MFI, upper) and frequency (lower) of CCR4, CCR5, CCR6, CCR7, and CXCR4 expression by eachfraction of CD4+ T cells in PBMCs from HNSCC patients (n = 50). Statistical differences were analyzed using Kruskal-Wallis tests. *P < 0.05,
[image:6.612.108.505.47.639.2]expression within the HNSCC microenvironment,
tissue sections from 15 HNSCC biopsies were stained using antibodies specific for MCP-1 and two unique chemoattractant ligands (MDC and TARC) for CCR4 (Figure 4E). The immunohistochemistry data were consistent with that of the antibody array. Therefore, we postulated that HNSCC-circulating aTreg cells could be recruited to the tumor microenvironment by endogenous MCP-1 through binding to CCR4.
MCP-1/CCR4 signaling increases circulating aTreg cell trafficking in tumors
MCP-1 is a chemoattractant ligand for both CCR4 and CCR2. Therefore, we could not conclude that CCR4
was the only functional receptor in MCP-1-induced
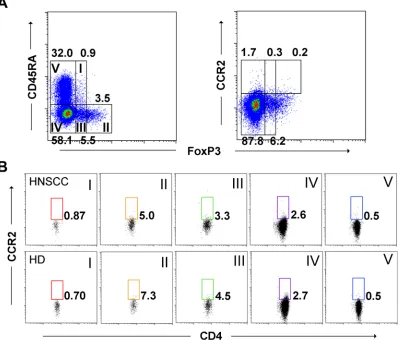
circulating aTreg cell recruitment. To elucidate the specific chemoattractant responsible for aTreg cell recruitment, we first analyzed CCR2 expression on circulating aTreg cells
from both HNSCC patients and healthy donors. CCR2+ T
cells were nearly absent in FoxP3+CD4+ T cell fractions,
indicating that HNSCC-circulating aTreg cells may be recruited to the tumor microenvironment by endogenous MCP-1 via binding to CCR4 but not CCR2 (Figure 5A, 5B).
We next examined whether the CCR4 on aTreg cells was functional. Freshly isolated circulating aTreg cells from HNSCC patients were analyzed in migration assays
(n = 3). The data showed that freshly isolated tumor
extracts induced significant migration of aTreg cells
in vitro (P < 0.01 versus control [media]). In addition,
both a monoclonal antibody against human MCP-1 and a CCR4 antagonist significantly blocked tumor
extract-induced aTreg cell migration (P < 0.01 for each). In
support of these results, recombinant MCP-1 induced significant aTreg cell migration (P < 0.01 versus control)
that was efficiently blocked by the anti-MCP-1 antibody
and CCR4 antagonist (P < 0.01 for each) (Figure 5C).
Thus, MCP-1 could increase aTreg cell trafficking via
binding to CCR4 in vitro and could recruit aTreg cells
[image:7.612.110.495.299.630.2]to tumors.
Figure 4: MCP-1 is increased in tumor tissues from HNSCC patients. (A) Map of antibodies against chemokines on the RayBiotech Human Chemokine Antibody Array (AAH-CHE-G1). (B) Cell lysates from tumor and adjacent nontumor tissues were first applied to the array. Bound chemokines were then recognized by a pool of anti-chemokine antibodies corresponding to the antibodies spotted on the array. Similar results were observed in two independent arrays.(C) Semiquantification of scanned antibody arrays. The levels were normalized to internal positive controls present in each membrane. Semiquantitative levels are represented in the heat map.
Figure 5: MCP-1/CCR4 signaling promotes aTreg cell migration. (A),(B)CCR2-positive T cells were scarcely present in fractions of FoxP3+CD4+ and FoxP3-CD4+ T cells.(A) CCR2 expression by subpopulation of FoxP3+ Treg cells in PBMCs from HNSCC
patients and healthy donors.(B) Expression of CCR2 in CD4+ T cell fractions. Representative data from 19 HNSCC patients and 12 healthy
donors are shown.(C) Migration of aTreg cells in response to a tumor extract or recombinant MCP-1. A specific anti-MCP-1 antibody or CCR4 antagonist significantly inhibited aTreg cell migration. Results are the mean ± SD. Statistical differences were analyzed by one-way
A CCR4 antagonist evokes and enhances antitumor immune responses in vivo
We next determined whether CCR4-binding treatment
could evoke and enhance antitumor immunity in vivo (n = 6
per group, C3H-HeN mice). After administration of a CCR4 antagonist, we observed inhibition of SCC-VII tumor growth
at day 33 (P < 0.01 for each, Figure 6A) and prolongation
of the overall survival time (P < 0.05 for each, Figure 6B) in the CCR4 antagonist-treated group compared to the control groups. One mouse in the CCR4 antagonist-treated group was still alive at the end of the observation period at day 50. The frequency of tumor-infiltrating aTreg cells was also lower in the CCR4 antagonist-treated group than in the PBS/ blank control groups (P < 0.05 for each), suggesting that
the CCR4 antagonist inhibited aTreg cell migration in vivo
(Figure 6C). The frequency of tumor-infiltrating CD4+ T
cells was higher in the CCR4 antagonist-treated group than in the control groups, but the difference was not statistically significant. The frequency of tumor-infiltrating CD8+ T
cells in the CCR4 antagonist-treated group was higher than
in the control groups (P < 0.05 for each, Figure 6D).We
next examined the cytokine profiles of tumor-infiltrating
lymphocytes following ex vivo stimulation, and found
that T cells in the CCR4 antagonist-treated group secreted significantly higher amounts of IFN-γ, IL-2, and TNF-α than
T cells in the control groups (P < 0.05 for each) (Figure 6E).
DISCUSSION
Accumulating evidence indicates that FoxP3+
Treg cells can suppress tumor-specific immunity,
which provides a clear rationale for development of
immunotherapies that can modulate the influence of
these regulatory cells [3, 17, 28]. Here, we investigated
the distribution of FoxP3+ T cell subsets in HNSCC
tissues. Intriguingly, our data showed that the majority
of tumor-infiltrating FoxP3+ T cells were aTreg cells.
Although there is a large amount of evidence that FoxP3+
T cells predominantly infiltrate tumor tissues [6, 7, 17,
29, 30], the detailed phenotypes of these FoxP3+ T cells
have not been characterized. Our finding of predominant aTreg cell infiltration revealed the phenotypes of such cells. Additionally, aTreg cell numbers were significantly
[image:9.612.60.554.334.628.2]higher in late-stage (III and IV) HNSCC tumor tissue than in early-stage tissue (I and II), and were inversely
correlated with patient prognosis. Given the clinical importance of tumor-infiltrating aTreg cells, inhibition of aTreg cell recruitment in HNSCC may be an effective
immunotherapeutic strategy.
We recently confirmed that aTreg cells suppress
proliferation of non-TAA T cells [24, 25]. However, there
has been no definitive demonstration of the role of aTreg
cells in TAA immunity. Our data showed that aTreg cells
from HNSCC patients inhibit TAA immunity, which
resulted in lower TAA-loaded cell cytotoxicity in vitro.
These findings provide a rationale for the development of
immunotherapies to control the effects of aTreg cells in HNSCC.
Since chemokine receptors have central roles in the recruitment of immunoregulatory cells [7, 17, 31, 32, 33], we focused on the expression of these receptors in aTreg
cells in order to identify a specific chemokine receptor that could be inhibited to block aTreg cell trafficking. The data indicated that aTreg cells predominantly expressed CCR4 compared with FoxP3+/−CD4+ T cell subsets and other types
of immune cells. This result was consistent with a previous
study, which showed that CCR4 was predominantly expressed in peripheral blood aTreg cells from melanoma patients [34]. These data strongly suggest that blockade of aTreg cells by therapeutics that bind CCR4 may be used to selectively prevent circulating aTreg cell trafficking.
Circulating FoxP3+ Treg cells express CCR4 and
migrate in response to TARC and MDC [35–38]. However,
it is unknown whether these chemoattractants are involved in aTreg cell homing to HNSCC tumors. Here, we showed
that TARC and MDC were not significantly expressed in
HNSCC tissues. In contrast, MCP-1, a chemoattractant
ligand for both CCR2 and CCR4, was highly expressed in HNSCC tissues compared to adjacent nontumor tissues. This finding indicated that MCP-1, but not TARC or MDC, was involved in aTreg cell trafficking in tumors via CCR2 and/or CCR4. CCR2 is expressed on blood lymphocytes such as monocytes, NK cells, and B cells [39–41]. However, whether aTreg cells expressed CCR2 was unclear. We observed low expression of CCR2 on
aTreg cells. In addition, we determined that circulating
aTreg cells, which highly express functional CCR4,
migrated toward MCP-1 in the tumor microenvironment. Our in vivo studies showed that inhibition of tumor growth and prolonged mouse survival could be attributed to inhibition of aTreg cell recruitment resulting in expansion of tumor infiltrating CD4+ and CD8+ T cells.
These data demonstrate that aTreg cells are involved in the progression of HNSCC via their suppressive effects on TAA immune responses. Therefore, therapeutics that
bind aTreg cells could be an effective immunotherapy for
HNSCC. Several recent clinical trials have shown that
depletion of CCR4-expressing FoxP3+CD4+ Treg cells by
anti-human CCR4 monoclonal antibody is a promising
approach to augment antitumor immune responses in
cancer patients [42, 43]. The above findings give us confidence that inhibiting CCR4-expressing aTreg cell
recruitment may be an effective strategy in HNSCC
immunotherapy.
In conclusion, our data suggest that a combination of a CCR4-binding therapeutic that can block aTreg cell trafficking in tumors, tumor antigen immunization, and monoclonal antibodies may enhance the clinical efficacy
of immunotherapies for HNSCC.
MATERIALS AND METHODS
Donor samplesPBMCs were obtained from healthy donors and
HNSCC patients who had not received any previous
oncological treatments. Tumor- and nontumor-infiltrating lymphocytes were obtained from tumor and adjacent nontumor tissues after surgical debulking. Informed consent was obtained from all participants prior to enrollment in the study. The study was approved by the Ethics Committee of The First Affiliated Hospital of Sun Yat-sen University,
Guangzhou, China (Approval No. 2012-349).
Preparation of infiltrating lymphocytes
Infiltrating lymphocyte suspensions were prepared by enzymatic digestion [44]. Dissected tumor or adjacent
nontumor tissues were minced into small pieces with a scalpel. Samples (0.25 g) were then immersed in 10 mL
of a digestion mixture [RPMI 1640 containing 5% fetal bovine serum, 0.5 mg/mL collagenase A, 0.2 mg/mL
hyaluronidase type V, and 0.02 mg/mL DNase I
(Sigma-Aldrich St. Louis, MO, USA)]. The samples were incubated
on a rotating platform at 37°C for 30 min and the resulting
cell suspensions filtered through 40-mm cell strainers (BD Biosciences, San Diego, CA, USA). Finally, lymphocyte suspensions were obtained using Ficoll-Hypaque (Haoyang Bio, Tianjing, China).
Cell lines and mice
The SNU899 LSCC cell line was provided by Professor Ja-Lok Ku (Seoul National University College of Medicine, South Korea). The mouse SCC VII OSCC cell line was provided by Professor Si-Xi Liu (West China Hospital,
China). Cells were cultured under standard conditions.
Eight-week old male C3H-HeN mice were purchased from Slac Laboratory Animal Co., Ltd. (Shanghai, China). All mice were housed under specific pathogen-free conditions. Experimental procedures were approved by
the Institutional Animal Studies Committee and conducted in accordance with Institutional Animal Care and Use Committee guidelines.
Preparation of DCs and TAA loading
CD14+ cells were isolated from PBMCs using
Germany). The cells were then seeded into a 6-well plate at
a density of 1.5 × 10⁶ cells/well and cultured as described
previously [45]. On day 6, soluble SNU899 lysate antigens prepared by four freeze-thaw cycles (−140°C/42°C/60°C) were added to DC cultures at a ratio of 3:1 (SNU899 cells: DCs). On day 7, maturation of DCs was induced by the addition of 1 μg/mL lipopolysaccharide (Sigma-Aldrich)
and the cells cultured for an additional 2 days. On day 9,
DC phenotype was evaluated by flow cytometry (Gallios Flow Cytometer, Beckman Coulter, Hercules, CA, USA) using anti-hCD1a-PE-Cy7, anti-hCD83-FITC, anti-hHLA-DR-eFluor 450, anti-hCD80-PE-Cy5, anti-hCD86-PE, and anti-hCD40-APC (eBioscience, San Diego, CA, USA) antibodies.
Intracellular cytokine secretion assay
After stimulation for 5 h with a cocktail of phorbol 12-myristate 13-acetate, ionomycin, and Golgi stop (brefeldin A and monensin) (eBioscience), cells were
stained for cell surface markers and intracellular cytokines
(IL-2, TNF-α, and IFN-γ) using anti-hTNF-α-Alexa Fluor 700, anti-hIL-2-PE-Cy7, and anti-hIFN-γ-APC-eFluor 780 antibodies as well as the Fixation/Permeabilization Buffer and Permeabilization Buffer from eBioscience.
In vitro TAA immunosuppression in the presence of aTreg cells
Antigen-loaded DCs were added to autologous T
cells as stimulators at a ratio of 1:20 in a round bottom
96-well microplate. The aTreg cells were prepared as
described previously [24, 25] and added to cultures of antigen-loaded DCs and T cells at a ratio of 1:4. A second identical stimulation by antigen-loaded DCs was
performed after 1 week. On day 13, CD4+ and CD8+ T
cell proliferation and cytokine production of CD4+ T cells
were assessed by flow cytometry using anti-hCD3-eFluor 450, anti-hCD4-FITC, anti-hCD8a-PE-Cy7, anti-hIFN-γ-APC-eFluor780, anti-hIL-2-PE-Cy7, and anti-hTNF-α-Alexa Fluor 700 antibodies (eBioscience). SNU899-derived, lysate-pulsed immature DCs were labeled with 5 µM 5,6-carboxyfluorescein diacetate succinimidyl ester (eBioscience) and mixed with T cells that had been cultured for 13 days at a ratio of 1:10 in 96-well microplates for 4 h
in a 5% CO2 atmosphere at 37°C. Cytotoxicity was assessed
by flow cytometry using APC-annexin V and 7-amino-actinomycin D (7-AAD) (BD Biosciences).
Identification of FoxP3+CD4+ T cell subsets To identify FoxP3+CD4+ T cell subsets, T cells
obtained from tumor tissues, adjacent non-tumor tissues, and blood were stained with anti-hCD3-eFluor 605NC, anti-hCD4-FITC, anti-hCD25-APC, anti-hCD45RA-eFluor 450, and anti-hFoxP3-PE antibodies (eBioscience).
Immunohistochemical analysis
The main clinical and pathological characteristics of
LSCC patients are presented in Supplementary Table 4.
Clinical staging and the anatomical site of the tumors were assessed according to the 6th edition of the Union for International Cancer Control (UICC 2008)
tumor-node-metastasis classification of malignant tumors. Detection of
FoxP3 (Ab22510, IgG1, 1:50 dilution, Abcam, Cambridge,
MA, USA) and CD25 (Ab61777, IgG, 1:100 dilution, Abcam) was performed on 4 μm-thick, paraffin-embedded sections of tissue samples with the indicated antibodies using a double staining kit (DS-0001, ZSGB-BIO, Beijing, China). For chemokine receptor ligand staining, sections
of tissue samples were stained with anti-MCP-1, -MDC,
or -TARC antibodies using an ABC kit (PK-4001, ZSGB-BIO).
Chemokine receptor expression profiling
The expression of CCR2, CCR4, CCR5, CCR6, CCR7, and CXCR4 on lymphocytes was analyzed by flow cytometry using eFluor 605NC or hCD3-eFluor 450, hCD4-FITC, hCD8-PE-Cy7, anti-hCD25-APC, anti-hCD45RA-eFluor 450, anti-hFoxP3-PE, anti-hCD14-FITC, anti-hCD19-PE-Cy7, hCD11c-Alexa Fluor 700, hCD16-PE, hCD56-APC, anti-hCCR6-PerCP-eFluor710, anti-hCCR7-APC-eFluor780, and anti-hCXCR4-PE-Cy7 antibodies (eBioscience). The anti-hCCR2-Alexa Fluor 647, anti-hCCR4-PerCP-Cy5.5, and anti-hCCR5-APC-Cy7 antibodies were purchased from BD Pharmingen (San Diego, CA, USA).
RayBiotech human chemokine antibody array
A Human Chemokine Antibody Array (RayBiotech, Inc, Norcross, GA, USA) was used according to the manufacturer’s instructions. After development, films were scanned and the images processed and quantified using the National Institutes of Health ImageJ software. The intensities were normalized to internal positive controls for
comparison.
Migration assay
Migration was assessed as described previously [31]
using 5 × 10⁴ aTreg cells. Human recombinant MCP-1
(0.5 μg/mL, R&D Systems, Minneapolis, MN, USA), a human anti-MCP-1 antibody (Monoclonal Mouse IgG1 Clone #24822, 15 μg/mL, R & D Systems), or tumor tissue extract were added to the lower chamber. The aTreg cells were preincubated with a CCR4 antagonist
(C27H41N5O2.2HCl, 0.14 μM, TOCRIS, Minneapolis, MN,
In vivo augmentation of antitumor immune responses by the CCR4 antagonist
Eighteen C3H-HeN mice were randomly and equally
divided into three groups and ear tagged prior to treatment. On day 0, 1 × 10⁵ tumor cells were injected subcutaneously
into the right flank. Either a CCR4 antagonist (87.5 μg) or saline were injected intraperitoneally three times per week for 3 weeks from day 5 after tumor cell injection. In parallel, a group of six mice was used as a blank control. Tumor size was measured every 3 days using fine calipers.
Tumor volumes were calculated as length × (width)2 × 0.52.
All mice were sacrificed 7 days after the last injection. After sacrifice, tumors were removed and single cell suspensions were prepared by enzymatic digestion. The types of tumor infiltrating cells were analyzed by flow cytometry using anti-mouse CD3-FITC, anti-mouse CD4-eFluor 450, anti-mouse CD8-Alexa Fluor 700, anti-mouse CD25-APC, anti-mouse IL-2-PE, anti-mouse IFN-γ-PE-Cy-5, anti-mouse TNF-α-PE-Cy7, anti-mouse FoxP3-PE, and anti-mouse CD45RA-FITC antibodies (Santa Cruz Biotechnology, Inc., Dallas, TX, USA), and a fixation/ permeabilization kit. All antibodies were purchased from eBioscience unless otherwise specified. An additional
three randomly divided groups of mice were used for
survival analysis. The observation period was 50 days.
Statistical analysis
Statistical analysis was performed with SPSS
Standard version 13.0 software (IBM, Chicago, IL, USA). Differences between groups were assessed using
Mann-Whitney U-tests, Student’s t-tests, or Kruskal-Wallis tests. Comparisons of aTreg cell infiltration levels between groups
were performed using the Wilcoxon matched-pairs
signed-ranks test. Survival variables were estimated using the Kaplan-Meier method and compared using log-rank tests. Multivariate analysis using the Cox proportional hazard model was used to determine the influence of each variable, when adjusted to the others, on overall survival. A P-value
of less than 0.05 was considered statistically significant.
ACKNOWLEDGMENTS
We thank Dr. Li-Min Zheng for helpful discussions
and for critically reviewing this manuscript.
CONFLICTS OF INTEREST
The authors declare that there are no conflicts of interest.
GRANT SUPPORT
This work was supported by grants from the National Natural Science Foundation of China (81271055, 81470674), Doctoral Foundation of Ministry
of Education of China (20120171110049), and Science and Technology Planning Project of Guangdong Province
(2014A020212141).
REFERENCES
1. Parkin DM, Bray F, Ferlay J, Pisani P. Global cancer statistics, 2002. CA Cancer J Clin. 2005; 55:74–108. 2. Forastiere AA, Ang KK, Brizel D, Brockstein BE, Burtness BA,
Cmelak AJ, Colevas AD, Dunphy F, Eisele DW, Goepfert H, Hicks WL Jr, Kies MS, Lydiatt WM, et al. Head and neck cancer. J Natl Compr Canc Netw. 2008; 6:646–695. 3. Zou W. Regulatory T cells, tumour immunity and
immunotherapy. Nat Rev Immunol. 2006; 6:295–307. 4. Alhamarneh O, Amarnath SM, Stafford ND, Greenman J.
Regulatory T cells: what role do they play in antitumor
immunity in patients with head and neck cancer? Head Neck.
2008; 30:251–261.
5. Khazaie K, von Boehmer H. The impact of CD4+CD25+ Treg on tumor specific CD8+ T cell cytotoxicity and cancer. Semin Cancer Biol. 2006; 16:124–136.
6. Sato E, Olson SH, Ahn J, Bundy B, Nishikawa H, Qian F, Jungbluth AA, Frosina D, Gnjatic S, Ambrosone C, Kepner J, Odunsi T, Ritter G, et al. Intraepithelial CD8+ tumor-infiltrating lymphocytes and a high CD8+/regulatory T cell ratio are associated with favorable prognosis in ovarian cancer. Proc Natl Acad Sci USA. 2005; 102:18538–18543. 7. Curiel TJ, Coukos G, Zou L, Alvarez X, Cheng P, Mottram P, Evdemon-Hogan M, Conejo-Garcia JR, Zhang L, Burow M, Zhu Y, Wei S, Kryczek I, et al. Specific recruitment of
regulatory T cells in ovarian carcinoma fosters immune privilege and predicts reduced survival. Nat Med. 2004;
10:942–949.
8. Yamaguchi T, Hirota K, Nagahama K, Ohkawa K, Takahashi T, Nomura T, Sakaguchi S. Control of immune responses by antigen-specific regulatory T cells expressing the folate receptor. Immunity. 2007; 27:145–159.
9. Liu Z, Kim JH, Falo LD Jr, You Z. Tumor regulatory T cells potently abrogate antitumor immunity. J Immunol. 2009; 182:6160–6167.
10. Wang RF. Regulatory T cells and innate immune regulation in tumor immunity. Springer Semin Imunopathol. 2006; 28:17–23. 11. Fietta AM, Morosini M, Passadore I, Cascina A, Draghi P,
Dore R, Rossi S, Pozzi E, Meloni F. Systemic inflammatory response and downmodulation of peripheral CD25+ Foxp3+
T-regulatory cells in patients undergoing radiofrequency
thermal ablation for lung cancer. Human Immunol. 2009; 70:477–486.
12. Ruter J, Barnett BG, Kryczek I, Brumlik MJ, Daniel BJ, Coukos G, Zou W, Curiel TJ. Altering regulatory T cell function in cancer immunotherapy: a novel means to boost the efficacy of cancer vaccines. Front Biosci (Landmark Ed). 2009; 14:1761–1770.
specifically enhances antigen-specific immune responses to cancer vaccines. Blood. 2008; 112:610–618.
14. Kosmaczewska A, Ciszak L, Potoczek S, Frydecka I. The significance of Treg cells in defective tumor immunity. Arch Immunol Ther EXp (Warsz). 2008; 56:181–191.
15. Rech AJ, Mick R, Martin S, Recio A, Aqui NA, Powell DJ Jr, Colligon TA, Trosko JA, Leinbach LI, Pletcher CH, Tweed CK, DeMichele A, Fox KR, et al. CD25 blockade depletes and
selectively reprograms regulatory T cells in concert with immunotherapy in cancer patients. Sci Transl Med. 2012;
4:134–162.
16. Dannull J, Su Z, Rizzieri D, Yang BK, Coleman D, Yancey D, Zhang A, Dahm P, Chao N, Gilboa E, Vieweg J. Enhancement of vaccine-mediated antitumor immunity in cancer patients after depletion of regulatory T cells. J Clin Invest. 2005; 115:3623–3633.
17. Nishikawa H, Sakaguchi S. Regulatory T cells in tumor immunity. Int J Cancer. 2010; 127: 759–767.
18. Litzinger MT, Fernando R, Curiel TJ, Grosenbach DW, Schlom J, Palena C. IL-2 immunotoxin denileukin diftitox
reduces regulatory T cells and enhances vaccine-mediated
T-cell immunity. Blood. 2007; 110:3192–3201.
19. Attia P, Maker AV, Haworth LR, Rogers-Freezer L, Rosenberg SA. Inability of a fusion protein of IL-2 and diphtheria toxin (Denileukin Diftitox, DAB389IL-2, ONTAK) to eliminate
regulatory T lymphocytes in patients with melanoma.
J Immunother. 2005; 28:582–592.
20. Sakaguchi S, Sakaguchi N, Asano M, Itoh M, Toda M.
Immunologic self-tolerance maintained by activated T cells expressing IL-2 receptor α-chains (CD25). Breakdown
of a single mechanism of self-tolerance causes various
autoimmune diseases. J Immunol. 1995; 155:1151–1164.
21. Sakaguchi S. Naturally arising CD4+ regulatory t cells for immunologic selftolerance and negative control of immune
responses. Annu Rev Immunol. 2004; 22:531–562. 22. Kim JM, Rasmussen JP, Rudensky AY. Regulatory T cells
prevent catastrophic autoimmunity throughout the lifespan
of mice. Nat Immunol. 2007; 8:191–197.
23. Miyara M, Yoshioka Y, Kitoh A, Shima T, Wing K, Niwa A, Parizot C, Taflin C, Heike T, Valeyre D, Mathian A, Nakahata T, Yamaguchi T, et al. Functional delineation and
differentiation dynamics of human CD4+ T cells expressing
the Foxp3 transcription factor. Immunity. 2009; 30:899–911. 24. Sun W, Li WJ, Wu CY, Zhong H, Wen WP. CD45RA-Foxp3high but not CD45RA+Foxp3low suppressive T
regulatory cells increased in the peripheral circulation of patients with head and neck squamous cell carcinoma and correlated
with tumor progression. J Exp Clin Cancer Res. 2014; 33:35. 25. Sun W, Li WJ, Fu QL, Wu CY, Lin JZ, Zhu XL, Hou WJ,
Wei Y, Wen YH, Wang YJ, Wen WP. Functionally distinct subsets of CD4+ regulatory T cells in patients with laryngeal
squamous cell carcinoma are indicative of immune
deregulation and disease progression. Oncol Rep. 2015; 33:354–362.
26. Campbell DJ, Koch MA. Phenotypical and functional specialization of FOXP3+regulatory T cells. Nat Rev Immunol. 2011; 11:119–130.
27. Nair SK, Heiser A, Boczkowski D, Majumdar A, Naoe M, Lebkowski JS, Vieweg J, Gilboa E. Induction of cytotoxic T
cell responses and tumor immunity against unrelated tumors
using telomerase reverse transcriptase RNA transfected dendritic cells. Nat Med. 2000; 6:1011–1017.
28. Dougan M, Dranoff G. Immune therapy for cancer. Annu Rev Immunol. 2009; 27:83–117.
29. Badoual C , Hans S, Rodriguez J, Peyrard S, Klein C, Agueznay Nel H, Mosseri V, Laccourreye O, Bruneval P, Fridman WH, Brasnu DF, Tartour E. Prognostic value of tumor-infiltrating CD4+ T-cell subpopulations in head and neck cancers. Clin Cancer Res. 2006; 12:465–472.
30. Mandapathil M, Szczepanski MJ, Szajnik M, Ren J, Lenzner DE, Jackson EK, Gorelik E, Lang S, Johnson JT,
Whiteside TL. Increased ectonucleotidase expression and activity in regulatory T cells of patients with head and neck
cancer. Clin Cancer Res. 2009; 15:6348–6357.
31. Parsonage G, Machado LR, Hui JW, McLarnon A, Schmaler T, Balasothy M, To KF, Vlantis AC, van Hasselt CA, Lo KW, Wong WL, Hui EP, Chan AT, et al. CXCR6 and CCR5 localize T lymphocyte subsets in nasopharyngeal carcinoma. Am J Pathol. 2012; 180:1215–1222.
32. Iellem A, Mariani M, Lang R, Recalde H, Panina-Bordignon P, Sinigaglia F, D’Ambrosio D. Unique chemotactic response profile and specific expression of chemokine receptors CCR4 and CCR8 by CD4(+)CD25(+) regulatory T cells. J Exp Med. 2001; 194:847–853.
33. Zou W, Machelon V, Coulomb-L’Hermin A, Borvak J, Nome F, Isaeva T, Wei S, Krzysiek R, Durand-Gasselin I, Gordon A, Pustilnik T, Curiel DT, Galanaud P, et al. Stromal-derived factor-1
in human tumors recruits and alters the function of plasmacytoid
precursor dendritic cells. Nat Med. 2001; 7:1339–1346. 34. Sugiyama D, Nishikawa H, Maeda Y, Nishioka M, Tanemura A,
Katayama I, Ezoe S, Kanakura Y, Sato E, Fukumori Y, Karbach J, Jäger E, Sakaguchi S. Anti-CCR4 mAb selectively depletes effector-type FoxP3+CD4+ regulatory T cells,
evoking antitumor immune responses in humans. Proc Natl
Acad Sci USA. 2013; 110:17945–17950.
35. Cavassani KA, Campanelli AP, Moreira AP, Vancim JO, Vitali LH, Mamede RC, Martinez R, Silva JS. Systemic and local characterization of regulatory T cells in a chronic fungal infection in humans. J Immunol. 2006; 177:5811–5818. 36. Yu K, Chen Z, Khatri I, Gorczynski RM. CCR4 dependent
migration of Foxp3+ Treg cells to skin grafts and draining
lymph nodes is implicated in enhanced graft survival in
CD200tg recipients. Immunol Lett. 2011; 141:116–122. 37. Yoshie O, Matsushima K. CCR4 and its ligands: from bench
to bedside. Int Immunol. 2015; 27:11–20.
CD4+CD25highFoxp3+ regulatory T cells bear functional skin-homing receptors. J Immunol. 2006; 177:4488–4494. 39. Sozzani S, Introna M, Bernasconi S, Polentarutti N, Cinque P,
Poli G, Sica A, Mantovani A. MCP-1 and CCR2 in HIV infection: regulation of agonist and receptor expression. J Leukoc Biol. 1997; 62:30–33.
40. Polentarutti N, Allavena P, Bianchi G, Giardina G, Basile A, Sozzani S, Mantovani A, Introna M. IL-2-regulated expression of the monocyte chemotactic protein-1 receptor (CCR2) in human NK cells: characterization of a predominant 3.4-kilobase transcript containing CCR2B and CCR2A sequences. J Immunol. 1997; 158:2689–2694.
41. Frade JM, Mellado M, del Real G, Gutierrez-Ramos JC, Lind P, Martinez-A C. Characterization of the CCR2 chemokine receptor: functional CCR2 receptor expression in B cells. J Immunol. 1998; 159:5576–5584.
42. Kurose K, Ohue Y, Wada H, Iida S, Ishida T, Kojima T, Doi T, Suzuki S, Isobe M, Funakoshi T, Kakimi K, Nishikawa H, Udono H, et al. Phase Ia Study of FoxP3+ CD4 Treg Depletion by Infusion of a Humanized Anti-CCR4 Antibody, KW-0761, in Cancer Patients. Clin Cancer Res. 2015; 21:4327–4336.
43. Duvic M, Pinter-Brown LC, Foss FM, Sokol L, Jorgensen JL, Challagundla P, Dwyer KM, Zhang X, Kurman MR, Ballerini R, Liu L, Kim YH. Phase 1/2 study of mogamulizumab, a defucosylated anti-CCR4 antibody, in
previously treated patients with cutaneous T-cell lymphoma.
Blood. 2015; 125:1883–1889.
44. Lee H, Lee H, Kwon Y, Lee JH, Kim J, Shin MK, Kim SH, Bae H. Methyl gallate exhibits potent antitumor activities by inhibiting tumor infiltration of CD4+CD25+ regulatory T cells. J Immunol. 2010; 185:6698–6705.