Research
Report
The Housing Corporation
and Communities and Local
Government Panel Survey 7
Prepared for: The Housing Corporation
and Communities and Local
Government Panel Survey 7
Prepared for: The Housing Corporation and Communities and Local Government
Prepared by: BMG Research
July 2008
Produced by BMG Research
© Bostock Marketing Group Ltd, 2008 www.bmgresearch.co.uk
Project:
Registered in England No. 2841970
Registered office:
7 Holt Court North Heneage Street West Aston Science Park Birmingham B7 4AX UK
Tel: +44 (0) 121 3336006
UK VAT Registration No. 580 6606 32
Birmingham Chamber of Commerce Member No. B4626
Market Research Society Company Partner
ESOMAR Member (The World Association of Research Professionals)
British Quality Foundation Member
Market Research Quality Standards Association (British Standards Institute) BS7911 for Market Research - Certificate No. FS76713
Table of Contents
1 Executive summary ... 4
1.1 Views on anti-social behaviour in the neighbourhood ... 4
1.1.1 Anti-social behaviour in the neighbourhood ... 4
1.2 Responsibility for dealing with anti-social behaviour ... 4
1.2.1 Anti-social behaviour in the neighbourhood ... 4
1.2.2 Anti-social behaviour near the home ... 5
1.3 Experiences of anti-social behaviour ... 5
1.3.1 Experience of Anti-social behaviour ... 5
1.3.2 To whom problems/issues were reported. ... 5
1.3.3 Satisfaction with the way in which the landlord dealt with the problem ... 6
1.3.4 Way in which the landlord dealt with the problem ... 6
1.3.5 Reasons for not reporting problems or issues to the landlord ... 6
1.3.6 Effectively dealing with anti-social behaviour ... 7
1.3.7 Dealing with social behaviour where tenants have had experience of anti-social behaviour ... 7
1.3.8 Satisfaction with the way the landlord deals with anti-social behaviour ... 7
1.3.9 Reasons for satisfaction with the way landlord deals with anti-social behaviour7 1.3.10 Reasons for dissatisfaction with the way landlord deals with anti-social behaviour ... 8
1.4 Policies on anti-social behaviour ... 8
1.4.1 Awareness of an anti-social behaviour policy ... 8
1.3.2 Level of resident involvement and consultation in drawing up an anti-social behaviour policy ... 8
1.4.2 Rating of anti-social behaviour policy ... 9
1.4.3 Whether or not landlord is compliant with own anti-social behaviour policy ... 9
2 Introduction ... 10
2.1 Background and method ... 10
2.1.1 A note on all LAs ... 11
3 Views on anti-social behaviour in the neighbourhood ... 12
3.1 Introduction ... 12
3.2.2 BME-related issues ... 14
3.2.3 Tracking over time ... 15
3.3 Responsibility for dealing with types of anti-social behaviour ... 16
3.3.1 Anti-social behaviour in the neighbourhood ... 16
3.3.2 Demographic variations – RSLs ... 17
3.3.3 Demographic variations – all LAs ... 17
3.3.4 Tracking over time ... 17
3.3.5 Anti-social behaviour near the home ... 18
3.3.6 Tracking over time ... 19
4 Experience of anti-social behaviour... 20
4.1 Introduction ... 20
4.2 Experience of ASB ... 21
4.3 To whom problems/issues were reported ... 22
4.4 Satisfaction with the way in which the landlord dealt with the problem ... 25
4.5 Way in which the landlord dealt with the problem ... 27
4.6 The way the problem was dealt with by satisfaction with the way in which the problem was dealt with ... 30
4.7 Reasons for not reporting problems or issues to the landlord ... 31
4.8 Effectively dealing with anti-social behaviour ... 33
4.8.1 Further analysis ... 34
4.8.2 Teenagers hanging around on the street ... 34
4.8.3 People using or dealing drugs ... 34
4.8.4 People being drunk or rowdy in public places ... 34
4.8.5 Further analysis ... 37
4.8.6 Teenagers handing around on the streets ... 37
4.8.7 ALMOs and retained LAs ... 37
4.9 Dealing with ASB where tenants have had experience of ASB (RSL tenants)... 39
4.10 Dealing with ASB where tenants have had experience of ASB (All LA tenants) .... 41
4.11 Satisfaction with the way the landlord deals with anti-social behaviour ... 43
4.11.1 Reasons for satisfaction with the way the landlord deals with ASB ... 45
4.11.2 Reasons for dissatisfaction with the way the landlord deals with ASB ... 47
4.12 What should be done to prevent ASB ... 49
5.2 Awareness of an ASB policy ... 50
5.3 Level of resident involvement and consultation in drawing up an ASB policy ... 52
5.4 Rating of ASB policy ... 54
5.5 Whether or not landlord is compliant with own ASB policy ... 56
6 Appendix – profile ... 58
Table of Figures
Figure 1 Anti-social behaviour in the neighbourhood - % very/fairly big problem (Q1) ... 12Figure 2 Responsibility for dealing with ASB in their neighbourhood (Q2a) ... 16
Figure 3 Responsibility for dealing with ASB near the home (Q2b) ... 18
Figure 4 Experience of anti-social behaviour (Q3) ... 21
Figure 5 Satisfaction with the way in which the landlord dealt with the problem (Q5) ... 25
Figure 6 Way in which landlord dealt with the problem (Q6) ... 28
Figure 7 Satisfaction with the way in which landlord deals with ASB (Q9) ... 43
Figure 8 Whether or not the landlord has made tenants aware that they have an ASB policy (Q12) ... 50
Figure 9 Whether or not residents were involved/consulted in developing ASB policy (Q13) ... 52
Figure 10 Rating of ASB policy (Q14) ... 54
Figure 11 Whether or not landlord is doing what is set out in ASB policy (Q15) ... 56
Table of Tables
Table 1 RSLs comparison with Panel Survey 1 (% very/fairly big problem) (Panel 1 – Q28; Panel 7 – Q1) ... 15Table 2 RSLs comparison with Panel Survey 1 (Panel 1 – Q29a; Panel 7 – Q2a) ... 17
Table 3 RSLs comparison with Panel Survey 1 (Panel 1 – Q29b; Panel 7 – Q2b) ... 19
Table 6 RSLs comparison with Panel Survey 1 (Panel 1 – Q31; Panel 7 – Q4) ... 24
Table 7 RSLs comparison with Panel Survey 1 (Panel 1 – Q32; Panel 7 – Q5) ... 26
Table 8 RSLs comparison with Panel Survey 1 (Panel 1 – Q33; Panel 7 – Q6) ... 29
Table 9 The way the problem was dealt with by satisfaction with the way in which the problem was dealt (Q6 ran by Q5) ... 30
Table 10 Reasons for not reporting problems or issues to the landlord (Q7) ... 31
Table 11 RSLs comparison with Panel Survey 1 (Panel 1 – Q34; Panel 7 – Q7) ... 32
Table 12 Agreement landlord deals effectively with ASB (RSL tenants) (Q8) ... 33
Table 13 Agreement landlord deals effectively with ASB (All LA tenants) (Q8)... 36
Table 14 RSLs comparison with Panel Survey 1 (% agree) (Panel 1 – Q35; Panel 7 – Q8) 38 Table 15 Experience of ASB by dealing effectively with ASB (RSL tenants) (Q3 by Q8) ... 40
Table 16 Experience of ASB by dealing effectively with ASB (all LA tenants) (Q3 by Q8) ... 42
Table 17 RSLs comparison with Panel Survey 1 (Panel 1 – Q36; Panel 7 – Q9) ... 44
Table 18 Reasons for satisfaction (very/fairly) with the way landlord deals with ASB (Q10) 45 Table 19 RSLs comparison with Panel Survey 1 (Panel 1 – Q37; Panel 7 – Q10) ... 46
Table 20 Reasons for dissatisfaction (very/fairly) with the way the landlord deals with ASB (Q10) ... 47
Table 21 RSLs comparison with Panel Survey 1 (Panel 1 – Q37; Panel 7 – Q10) ... 48
Table 22 What should be done to prevent ASB (top three)(Panel 1 – Q38; Panel 7 – Q11) 49 Table 23 RSLs comparison with Panel Survey 1 (Panel 1 – Q39; Panel 7 – Q12) ... 51
Table 24 RSLs comparison with Panel Survey 1 (Panel 1 – Q40; Panel 7 – Q13) ... 53
Table 25 RSLs comparison with Panel Survey 1 (Panel 1 – Q41; Panel 7 – Q14) ... 55
Table 26 RSLs comparison with Panel Survey 1 (Panel 1 – Q42; Panel 7 – Q15) ... 57
Table 27 RSLs comparison with Panel Survey 1 (Panel 1 – Q42; Panel 7 – Q15) Where provided a valid response ... 57
Table 28 Housing Corporation panel members profile... 58
1 Executive summary
1.1 Views on anti-social behaviour in the neighbourhood
1.1.1 Anti-social behaviour in the neighbourhood
All tenants were asked to indicate from a list of anti-social behaviour issues whether they thought these forms of anti-social behaviour were at a high (meaning a very big or fairly big problem) or a low (meaning not a very big problem or not a problem at all) level in their neighbourhood.
The most common form of anti-social behaviour indicated was rubbish or litter lying around, with over half of all tenants (52% of RSL tenants and 56% of all LA tenants) identifying this as either a very or fairly big problem in their area. The top three issues following this were:
teenagers hanging around on the street (36% of RSL tenants, 46% of all LA tenants) vandalism, graffiti & other deliberate damage to property or vehicles (34% of RSL
tenants, 40% of all LA tenants)
people using or dealing drugs (32% of RSL tenants, 41% of all LA tenants).
Perceptions of anti-social behaviour vary significantly across tenures, with RSL tenants consistently reporting lower levels of anti-social behaviour in their area compared to LA tenants. There are also significant variations amongst LA tenants in their perceptions of anti-social behaviour, with ALMO tenants reporting higher levels of anti-social behaviour than retained LA tenants for the majority of the issues identified in the survey. This variation is quite pronounced for some issues such as people using or dealing drugs, with 45% of ALMO tenants reporting this as a very or fairly big problem compared to 34% of retained LA tenants.
There have been few significant changes since these questions were asked in survey 1. There has been a 6% rise in RSL tenants reporting that rubbish or litter lying around is a very or fairly big problem in their area. There has also been a 6% fall in the number of RSL tenants identifying teenagers hanging around on the street as a problem in their area.
1.2 Responsibility for dealing with anti-social behaviour
1.2.1 Anti-social behaviour in the neighbourhood
There is a strong consensus amongst all tenants that the police should take overall responsibility for dealing with anti-social behaviour issues in the neighbourhood. On this point, no significant variation can be seen between tenure types with 59% of both RSL and ALMO tenants and 58% of retained LA tenants indicating that the police should take the lead on this issue.
tenants, however, were almost twice as likely to say that the local council should take responsibility as RSL tenants (19% of all LA tenants against 11% of RSL tenants).
1.2.2 Anti-social behaviour near the home
As with anti-social behaviour in the neighbourhood, a significant number of tenants felt that it was the police’s responsibility for dealing with anti-social behaviour near the home. However, there is a greater variation between tenure types in tenants expressing this opinion. 53% of RSL tenants believed the police should take responsibility for tackling the problem whereas 48% of ALMO and 41% of retained LA tenants felt this should be the case.
A significant number of LA tenants (25%) felt that the local council should be responsible for dealing with anti-social behaviour near the home. Breaking this figure down, 28% of retained LA tenants felt it was the local council’s responsibility as opposed to 22% of ALMO tenants.
1.3 Experiences of anti-social behaviour
1.3.1 Experience of Anti-social behaviour
All tenants were asked whether they or any members of their household have had experience of any of a list of neighbourhood problems in the last 12 months. The top three issues experienced by tenants were: rubbish or litter lying around (55% of RSL tenants, 60% of all LA tenants); teenagers hanging around on the street (41% of RSL tenants, 54% of all LA tenants) and vandalism, graffiti & other deliberate damage to property or vehicles (30% of RSL tenants, 40% of all LA tenants).
As with perceptions of anti-social behaviour, experiences varied significantly across tenure types. RSL tenants consistently reported lower rates of experiencing anti-social behaviour than LA tenants on all of the issues listed. Amongst LA respondents, ALMO tenants were, in general, more likely than retained LA tenants on to have experienced the anti-social behaviour issues identified in the list.
Since survey 1 was conducted in 2006, there has been a major increase in the number of RSL tenants reporting that they have experienced rubbish or litter lying around in their area. In 2006, 35% of RSL tenants reported that they had experienced this but in 2008, the figure has risen to 55%. 6% rises in the number of tenants having experienced people being drunk or rowdy in public places and people using or dealing drugs can also be observed. There has, however, been a 6% fall in the number of RSL tenants having experienced abandoned or burnt out cars in their area.
1.3.2 To whom problems/issues were reported.
It is notable, however, that a significant minority of both RSL and LA tenants did not report the problem. 31% of RSL tenants and 24% of all LA tenants did not report the problem or issue to anybody and, as a consequence of this, a significant amount of anti-social behaviour may be going unnoticed.
1.3.3 Satisfaction with the way in which the landlord dealt with the problem
All tenants who had reported incidents of anti-social behaviour to their landlord were asked to indicate their level of satisfaction or dissatisfaction with the way in which their landlord dealt with the problem. 38% of both RSL and all LA tenants reported that they were satisfied with the way in which their landlord dealt with the problem. However, breaking down the all LAs figure reveals a major difference in satisfaction levels: ALMO tenants were more than twice as likely to say they were satisfied than retained LA tenants (53% against 26%).
1.3.4 Way in which the landlord dealt with the problem
All tenants who had reported incidents of anti-social behaviour to their landlord were asked to indicate how their landlord dealt with the problem. The ways in which the landlord dealt with the problem varied significantly by tenure type. RSL tenants were almost equally dealt with by:
being told to keep an incident diary (25%)
being visited by representatives from the landlord (25%) letters being sent to the residents involved (24%)
the police being contacted (24%).
Higher proportions of all LA tenants had their problem dealt with by: being told to keep and incident diary (40%)
letters being sent to the residents involved (38%) the police being contacted (41%).
Whilst 32% of all LA tenants were visited by a representative of from their landlord, significant variation can be seen by tenure type. ALMO tenants were significantly more likely to be visited by a representative than retained LA tenants (54% of ALMO tenants against 22% of retained LA tenants).
Comparisons with survey 1 suggest an increase in the amount of action being taken by housing associations. The number of RSL tenants reporting that the residents involved were visited by representatives of the housing association increased by 19% and 18% more residents were told to keep an incident diary. 15% more tenants reported that the police were contacted.
1.3.5 Reasons for not reporting problems or issues to the landlord
reported, nothing was done. This view was more prevalent amongst ALMO tenants with 12% feeling nothing was done when incidents were reported.
1.3.6 Effectively dealing with anti-social behaviour
All tenants were asked to rate their level of agreement that their landlord deals effectively with various types of anti-social behaviour. Levels of agreement vary significantly by tenure type, with all LA tenants responding much more positively than RSL tenants. All LA tenants feel their landlords deal effectively with most types of anti-social behaviour and are particularly positive about landlord efforts to deal with abandoned or burnt out cars (balance score of +13%) and people being attacked or harassed because of the skin colour, ethnic origin or religion (balance score of +13%). RSL tenants, by contrast, are much more negative about their landlord’s performance. They express a negative opinion of their landlord’s effectiveness in dealing with most forms of anti-social behaviour. They are, however, positive about some aspects, such as the landlord’s effectiveness in dealing with noisy neighbours or loud parties (balance score of +8%)
1.3.7 Dealing with social behaviour where tenants have had experience of anti-social behaviour
Where tenants or a member of their household had experienced anti-social behaviour in the last 12 months, the level of agreement that their landlord deals effectively with anti-social behaviour was exceptionally low. On balance, both RSL and all LA tenants who had experienced anti-social behaviour were overwhelmingly negative about their landlord’s effectiveness in dealing with the issues. They were particularly negative about their landlords effectiveness on people using or dealing drugs (balance scores of -34% for RSL, -32% for all LA tenants) and people being insulted or intimidated in the street (balance scores of -30 for RSL tenants, -27% for all LA tenants).
1.3.8 Satisfaction with the way the landlord deals with anti-social behaviour
All tenants were asked to what extent they were satisfied with the way their landlords dealt with anti-social behaviour. Levels of satisfaction vary quite considerably across tenure types, with a higher proportion of all LA tenants being satisfied with their landlord’s efforts. 36% of all LA tenants indicate that they are satisfied with the way their landlord deals with anti-social behaviour, compared with 30% of RSL tenants. Interestingly, a higher proportion of all LA tenants were also dissatisfied with the way their landlord dealt with anti-social behaviour (28% of all LA tenants, 22% of RSL tenants). The cause of this is a high degree of ambivalence amongst RSL tenants about how their landlord deals with anti-social behaviour. 35% of RSL tenants were neither satisfied nor dissatisfied with their landlord’s efforts.
1.3.9 Reasons for satisfaction with the way landlord deals with anti-social behaviour
In addition to this, the responses of tenants suggest they are not experiencing significant problems, answering either that there is very little / no anti-social behaviour in the area (18% of RSL tenants, 10% of all LA tenants) or that they have never experienced a problem (13% of RSL tenants, 5% of all LA tenants). Whilst there has been little change over time, it is notable that the number of RSL tenants stating that there is very little / no anti-social behaviour in their area has increased by 12% since survey 1.
1.3.10 Reasons for dissatisfaction with the way landlord deals with anti-social behaviour
Tenants who indicated that they were dissatisfied with the way that their landlord deals with anti-social behaviour were asked to explain the reason for their dissatisfaction. The most common reason for dissatisfaction was that no action was taken by the landlord to resolve the problem (50% of RSL tenants, 31% of all LA tenants). Just over one tenth of all LA tenants (12%) felt that their landlord did not seem to care or was not interested in the problem, whereas only 5% of RSL tenants expressed this opinion. Since survey 1 in 2006, there has been a 15% drop in the number of RSL tenants who felt that their landlord did not seem to care or was not interested in the problem (20% in 2006, 5% in 2008). However, this decrease has been matched almost exactly by a 16% increase in RSL tenants claiming that no action was taken to resolve the problem (34% in 2006, 50% in 2008).
1.4 Policies on anti-social behaviour
1.4.1 Awareness of an anti-social behaviour policy
All tenants were asked whether their landlord had made them aware of whether or not they had a policy for dealing with anti-social behaviour problems. All LA tenants were slightly more likely to be aware that their landlord had a policy for dealing with anti-social behaviour (47% of all LA tenants, 43% of RSL tenants). Comparatively high proportions of tenants did not know whether their landlord had an anti-social behaviour policy or not (36% of RSL tenants, 34% of all LA tenants). ALMO tenants were the least likely not know about any policies (28%) although this figure is still relatively high.
1.3.2 Level of resident involvement and consultation in drawing up an anti-social behaviour policy
All tenants that indicated that they were aware of their landlord having an anti-social behaviour policy were asked whether or not, to the best of their knowledge, residents had been involved or consulted when it was developed. RSL tenants were slightly less likely to indicate that residents had been involved than all LA tenants (35% of RSL tenants, 39% of all LA tenants). When breaking down the all LA figure by organisation type, a significant difference can be seen, with 46% of ALMO tenants indicating involvement as opposed to only 32% of retained LA tenants.
consulted in drawing up the anti-social behaviour policy (26% in 2006 against 35% in 2008).
1.4.2 Rating of anti-social behaviour policy
Tenants who were aware of their landlord’s anti-social behaviour policy were asked to rate the policy. More than half of all tenants, regardless of tenure type, rated their landlord’s policy as being good (57% of RSL tenants, 54% of all LA tenants). Only a small proportion of tenants rated their landlord’s policy as poor (12% of RSL tenants, 19% of all LA tenants), with a noticeable variation amongst LA tenants. 22% of retained LA tenants rated their landlord’s policy as poor whilst only 13% of ALMO tenants felt the same way. Since the original survey in 2006, there has been a 7% decrease in RSL tenants rating their landlord’s policy as good (64% in 2006 against 57% in 2008).
1.4.3 Whether or not landlord is compliant with own anti-social behaviour policy
All tenants who were aware of their landlord’s anti-social behaviour policy were asked to identify to what extent they thought their landlord was doing what it set out in its’ own policy. Whilst the overall level of compliance is the same for both RSL and all LA tenants (68%), major differences can be seen by tenure type when the degree of compliance is examined. 33% of RSL tenants think that their landlord is in complete compliance with their own anti-social behaviour policy whereas only 17% of all LA tenants express this opinion.
2 Introduction
2.1 Background and method
This document outlines the results from a survey of the Residents Consultation Panel, conducted by BMG Research during April and May 2008. The panel is jointly owned by the Housing Corporation and the department of Communities and Local Government. It is the 7th full survey of RSL tenants, and the second 'joint' survey covering both RSL and local authority tenants.
Of the 2,425 questionnaires sent to panel members, 1,089 were completed and returned (a response rate of 45%). The fieldwork was carried out during April and May 2008, with an initial mailing and a reminder mailing to those panel members who had not returned a questionnaire.
The data report that has been produced sets out the findings of the survey in tables and analyses them according to the cross tabulations set out below (amongst others): Housing type (i.e. Local Authority – both retained and ALMOs; and RSLs - Housing
Association) Gender; Age;
Ethnicity (both broadly and by age); Employment Status;
Disability;
Family status; and. Geographical area.
The total sample (1,089) is subject to a maximum standard error of +/-3.0% at the 95% confidence level on an observed statistic of 50%. This means that if the total adult population had participated in the survey and a statistic of 50% was observed, we can be 95% confident that the true response lies between 47.0% and 53.0%.
Looking at the sub-groups, the confidence levels can be seen in the table below: Type of housing provider Sample size Confidence interval
RSLs 469 +/-4.5%
All LAs 617 +/-4.0%
ALMOs 256 +/-6.2%
The level of statistical significance on an observed statistic of 50% between sub-groups can also be seen below:
Housing providers Sample sizes Level of statistical significance
RSLs and All LAs 469and 616 r. +/-6.0%
ALMOs and Retained LAs 256 and 289 r. +/-8.4%
Panel survey 1 and Panel survey 7 (RSL
tenants only) 857 and 469 r. +/-5.6%
Where tables and graphics do not match exactly to the text in the report this occurs due to the way in which figures are rounded up (or down) when responses are combined. Results that differ in this way should not have a variance any larger than 1%.
Where a * is used, this denotes a figure of <0.5%.
Significance has been tested at the 95% confidence interval, therefore wherever a variation is described as ‘significant’, this is statistically significant at the 95% confidence level.
This report covers the results from this panel survey whereby Panel members were asked to respond to questions about the following areas:
Levels of anti-social behaviour (ASB) in neighbourhoods and experience of this; Perceived ownership of responsibility for dealing with such issues;
Tenants’ experiences when reporting ASB to the landlord; and Views on landlord’s ASB policies.
2.1.1 A note on all LAs
3 Views on anti-social behaviour in the neighbourhood
3.1 Introduction
This section will examine the types of anti-social behaviour that are perceived to be prevalent in local neighbourhoods amongst housing association tenants and all LA tenants. This section will also examine tenants’ views on where the responsibility for dealing with such anti-social behaviour lies.
3.2 Anti-social behaviour in the neighbourhood
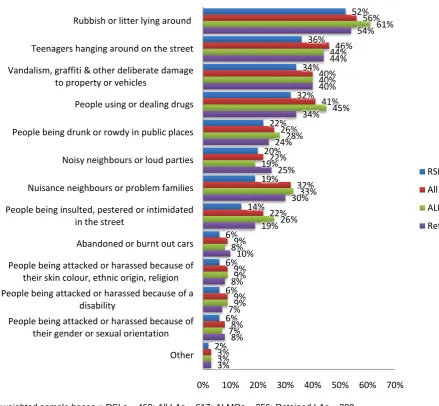
[image:16.595.82.522.349.755.2]All tenants were asked to indicate from a list of anti-social behaviour issues, whether or not they think forms of anti-social behaviour are at high (a very or fairly big problem) or low (not a very big problem or not a problem at all) levels in their local area. The figure (1) below indicates the proportion of tenants who indicated such issues are very/fairly big problems.
Figure 1 Anti-social behaviour in the neighbourhood - % very/fairly big problem (Q1)
52% 36% 34% 32% 22% 20% 19% 14% 6% 6% 6% 6% 2% 56% 46% 40% 41% 26% 22% 32% 22% 9% 9% 9% 8% 3% 61% 44% 40% 45% 28% 19% 33% 26% 8% 9% 9% 7% 3% 54% 44% 40% 34% 24% 25% 30% 19% 10% 8% 7% 8% 3%
0% 10% 20% 30% 40% 50% 60% 70% Rubbish or litter lying around
Teenagers hanging around on the street Vandalism, graffiti & other deliberate damage
to property or vehicles
People using or dealing drugs People being drunk or rowdy in public places Noisy neighbours or loud parties Nuisance neighbours or problem families People being insulted, pestered or intimidated
in the street
Abandoned or burnt out cars People being attacked or harassed because of
their skin colour, ethnic origin, religion People being attacked or harassed because of a
disability
People being attacked or harassed because of their gender or sexual orientation
Other
It can be seen from figure 1 that perceived levels of anti-social behaviour vary across tenant groups. For example, it can be seen that in general, RSL tenants are less likely to indicate local issues are a very/fairly big problem than all LA tenants. Indeed, this can be seen when looking at results for: nuisance neighbours or problem families, where around one in five (19%) RSL tenants consider this to be a very/fairly big problem in comparison with all LA tenants, where this proportion is nearly one in three, (32%).
The same pattern can be seen when examining two of the top four issues for ALMOs that tenants across the samples have identified as very or fairly big problems: rubbish and litter and people using or dealing drugs. This is worth commenting on, as this may be due to the fact that ALMO tenants tend to be located in inner city areas, and hence this may be driving perceptions of ASB more than tenure.
The top four issues that tenants have indicated are either a very or fairly big problem are as follows:
Rubbish or litter lying around (52% - RSLs; 56% - all LAs; 61% - ALMOs; and 54% - retained LAs);
Teenagers hanging around on the street (36% - RSLs; 46% - all LAs; 44% - ALMOs; and 44% - retained LAs);
Vandalism, graffiti and other deliberate damage to property (34% - RSLs; 40% - all LAs; 40% - ALMOs; and 40% - retained LAs); and
People using or dealing drugs (32% - RSLs; 41% - all LAs; 45% - ALMOs; and 34% - retained LAs).
3.2.1 Demographic analysis
There are no significant variations to speak of when looking at demographic variations for all LA tenants. However, when examining responses for RSL tenants for the four key issues highlighted above, the following can be seen:
RSL tenants significantly more likely to say that rubbish and litter is a problem are: Tenants with a disability (57%), in comparison with those without (45%);
Tenants with children in the household, compared with adult-only families (61% and 48% respectively); and
Asian tenants (79%), compared with White (50%) and Black (47%) tenants.
RSL tenants significantly more likely to say that teenagers hanging around the street is a problem are:
Tenants who are working (49%), in comparison with those who are not (31%); Tenants with children in the household, compared with adult-only families (54% and
32% respectively); and
BME tenants (58%), compared with Non-BME tenants (33%).
Tenants with children in the household, compared with adult-only families (45% and 31% respectively); and
BME tenants (50%), compared with Non-BME tenants (31%).
RSL tenants significantly more likely to say that people using or dealing drugs is a problem are:
Tenants with children in the household, compared with adult-only families (47% and 28% respectively); and
BME tenants (47%), compared with Non-BME tenants (30%).
3.2.2 BME-related issues
3.2.3 Tracking over time
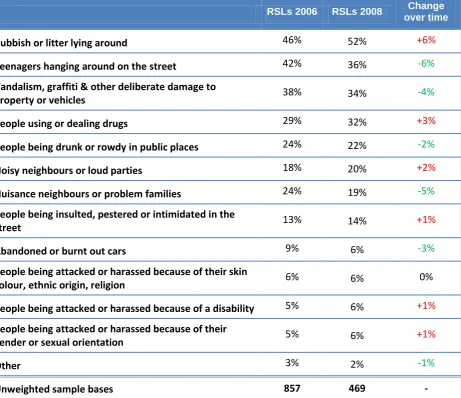
[image:19.595.78.540.166.564.2]The following table (1) shows comparisons with the panel survey 1 undertaken in 2006. There are no significant differences when comparing panel 1 with panel 7. Table 1 RSLs comparison with Panel Survey 1 (% very/fairly big problem) (Panel 1 – Q28; Panel 7 – Q1)
RSLs 2006 RSLs 2008 Change over time
Rubbish or litter lying around 46% 52% +6%
Teenagers hanging around on the street 42% 36% -6%
Vandalism, graffiti & other deliberate damage to
property or vehicles 38% 34% -4%
People using or dealing drugs 29% 32% +3%
People being drunk or rowdy in public places 24% 22% -2%
Noisy neighbours or loud parties 18% 20% +2%
Nuisance neighbours or problem families 24% 19% -5% People being insulted, pestered or intimidated in the
street 13% 14% +1%
Abandoned or burnt out cars 9% 6% -3%
People being attacked or harassed because of their skin
colour, ethnic origin, religion 6% 6% 0%
People being attacked or harassed because of a disability 5% 6% +1%
People being attacked or harassed because of their
gender or sexual orientation 5% 6% +1%
Other 3% 2% -1%
3.3 Responsibility for dealing with types of anti-social behaviour
3.3.1 Anti-social behaviour in the neighbourhood
All tenants were asked who they feel should have the overall responsibility for dealing with the types of anti-social behaviour listed in figure 2 in two situations: a) their neighbourhood; and b) near their home.
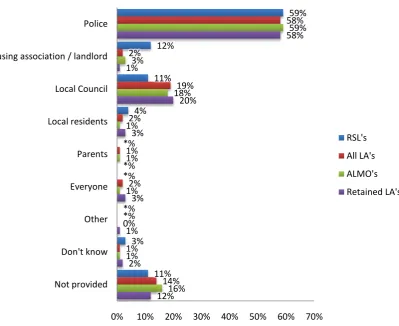
Considering firstly who should have responsibility in the neighbourhood, the general consensus is that the police should assume overall responsibility for anti-social behaviour issues, with around three in five tenants from each organisation type indicating this is the case.
Further to this, equal proportions of RSL tenants agree that their housing association or landlord (12%); or the local council (11%) should take responsibility for dealing with these issues.
[image:20.595.118.518.377.703.2]A higher proportion (19%) of all LA tenants (in comparison with RSL tenants) believes that dealing with ASB in their neighbourhood is the responsibility of the local council. Breaking this down by ALMOs and retained LAs, the distribution is almost equal (18% and 20% respectively).
Figure 2 Responsibility for dealing with ASB in their neighbourhood (Q2a)
Unweighted sample bases = RSLs – 469; All LAs – 617; ALMOs – 256; Retained LAs - 289 *denotes <0.5%
59% 12% 11% 4% *% *% *% 3% 11% 58% 2% 19% 2% 1% 2% *% 1% 14% 59% 3% 18% 1% 1% 1% 0% 1% 16% 58% 1% 20% 3% *% 3% 1% 2% 12%
0% 10% 20% 30% 40% 50% 60% 70% Police
3.3.2 Demographic variations – RSLs
For RSL tenants, some significant demographic variations can be seen when looking at where tenants feel responsibility should lie.
Tenants with children in the household are more likely to say that they think either the Police (61%) or the local Council (12%) should take responsibility, in comparison with households who do not have any children living there (50% and 5% respectively). In addition, Non-BME tenants are more likely to say that the Police should take responsibility, rather than BME tenants (61% and 43% respectively).
3.3.3 Demographic variations – all LAs
There are few variations when reviewing responses by all LA tenants, however tenants who are working (68%) are significantly more likely to say the Police should be held responsible than those who are not working (51%).
3.3.4 Tracking over time
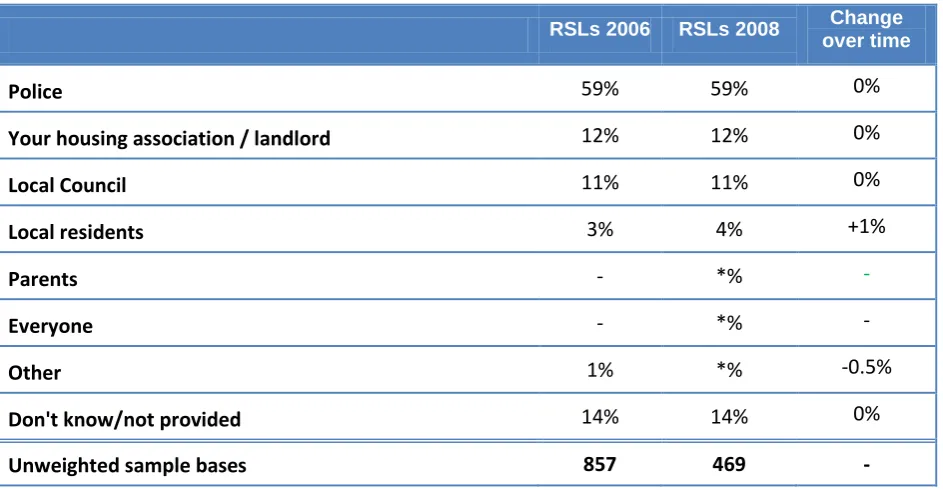
[image:21.595.68.540.369.614.2]The following table (2) shows comparisons with the panel survey 1 undertaken in 2006. There are no significant differences when comparing panel 1 with panel 7. Table 2 RSLs comparison with Panel Survey 1 (Panel 1 – Q29a; Panel 7 – Q2a)
RSLs 2006 RSLs 2008 Change over time
Police 59% 59% 0%
Your housing association / landlord 12% 12% 0%
Local Council 11% 11% 0%
Local residents 3% 4% +1%
Parents - *% -
Everyone - *% -
Other 1% *% -0.5%
Don't know/not provided 14% 14% 0%
3.3.5 Anti-social behaviour near the home
When considering anti-social behaviour near the home, once again the general consensus is that the police should assume overall responsibility for anti-social behaviour issues; however proportions vary slightly more than for ASB in the neighbourhood, with a greater contrast between the proportion of RSL tenants (53%) who believe it is the responsibility of the police, and all LA tenants, who are less likely to state this is the case (44%).
Further to this, a slightly higher proportion of RSL tenants agree that their housing association or landlord (13%); should take responsibility for dealing with these issues near the home rather than the local council (9%).
[image:22.595.130.532.306.681.2]Again, a higher proportion of LA tenants (25%) believe that ASB near the home is the responsibility of the local council, which can also be seen when separating out the ALMOs and retained LAs (22% and 28% respectively).
Figure 3 Responsibility for dealing with ASB near the home (Q2b)
Unweighted sample bases = RSLs – 469; All LAs – 617; ALMOs – 256; Retained LAs - 289 *denotes <0.5%
53% 13% 9% 5% *% *% *% 3% 15% 44% 4% 25% 5% 1% 2% *% 2% 17% 48% 3% 22% 6% 1% 1% *% 1% 19% 41% 5% 28% 5% 1% 3% *% 2% 15%
0% 10% 20% 30% 40% 50% 60% Police
Your housing association / landlord
3.3.6 Tracking over time
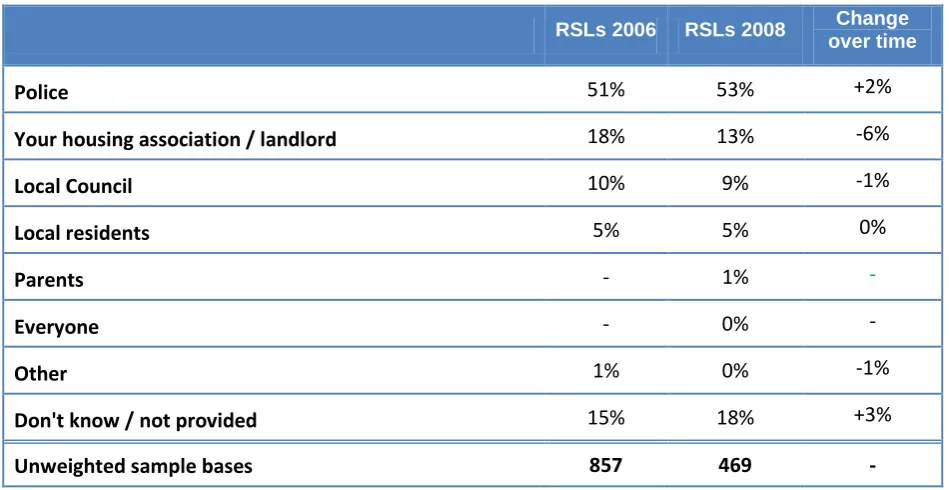
[image:23.595.65.540.150.395.2]The following table (3) shows comparisons with the panel survey 1 undertaken in 2006. There are no significant differences when comparing panel 1 with panel 7. Table 3 RSLs comparison with Panel Survey 1 (Panel 1 – Q29b; Panel 7 – Q2b)
RSLs 2006 RSLs 2008 Change over time
Police 51% 53% +2%
Your housing association / landlord 18% 13% -6%
Local Council 10% 9% -1%
Local residents 5% 5% 0%
Parents - 1% -
Everyone - 0% -
Other 1% 0% -1%
Don't know / not provided 15% 18% +3%
4 Experience of anti-social behaviour
4.1 Introduction
4.2 Experience of ASB
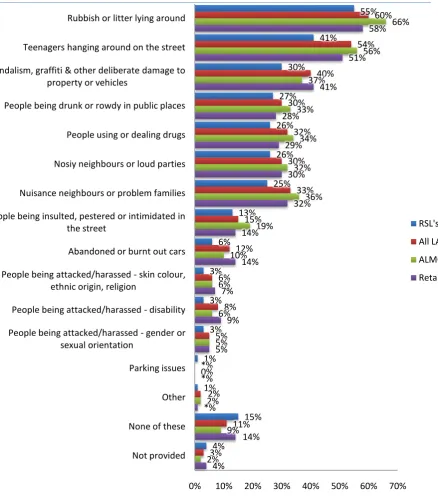
All tenants were asked whether, in the past 12 months, they or other members of their household have had experience of any of the neighbourhood problems listed (see figure 4). As the figure below shows, higher proportions of ALMO tenants have experienced neighbourhood problems over the last 12 months, rather than RSL tenants.
[image:25.595.93.532.246.743.2]The main top three issues across organisations can be described as follows: rubbish or litter lying around; teenagers hanging around on the street; and vandalism, graffiti and other deliberate damage to people’s property.
Figure 4 Experience of anti-social behaviour (Q3)
Unweighted sample bases = RSLs – 469; All LAs – 617; ALMOs – 256; Retained LAs - 289 *denotes <0.5%
55% 41% 30% 27% 26% 26% 25% 13% 6% 3% 3% 3% 1% 1% 15% 4% 60% 54% 40% 30% 32% 30% 33% 15% 12% 6% 8% 5% *% 2% 11% 3% 66% 56% 37% 33% 34% 32% 36% 19% 10% 6% 6% 5% 0% 2% 9% 2% 58% 51% 41% 28% 29% 30% 32% 14% 14% 7% 9% 5% *% *% 14% 4%
0% 10% 20% 30% 40% 50% 60% 70% Rubbish or litter lying around
Teenagers hanging around on the street Vandalism, graffiti & other deliberate damage to
property or vehicles
People being drunk or rowdy in public places People using or dealing drugs Nosiy neighbours or loud parties Nuisance neighbours or problem families People being insulted, pestered or intimidated in
the street
Abandoned or burnt out cars People being attacked/harassed - skin colour,
ethnic origin, religion
People being attacked/harassed - disability People being attacked/harassed - gender or
sexual orientation
Parking issues Other None of these Not provided
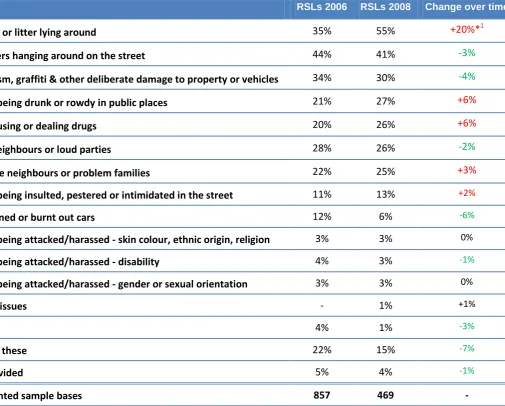
The following table (4) shows comparisons with the panel survey 1 undertaken in 2006. When examining the results for 2006 and 2008, it can be seen that there has been a significant increase in the proportion of tenants indicating that they have experienced rubbish and litter lying around in their neighbourhood over the last 12 months (+20% points). Table 1 highlights a large increase in the proportion of tenants who feel that rubbish and litter is a very or fairly big problem.
Table 4 RSLs comparison with Panel Survey 1 (Panel 1 – Q30; Panel 7 – Q3)
RSLs 2006 RSLs 2008 Change over time
Rubbish or litter lying around 35% 55% +20%*1
Teenagers hanging around on the street 44% 41% -3%
Vandalism, graffiti & other deliberate damage to property or vehicles 34% 30% -4%
People being drunk or rowdy in public places 21% 27% +6%
People using or dealing drugs 20% 26% +6%
Noisy neighbours or loud parties 28% 26% -2%
Nuisance neighbours or problem families 22% 25% +3%
People being insulted, pestered or intimidated in the street 11% 13% +2%
Abandoned or burnt out cars 12% 6% -6%
People being attacked/harassed - skin colour, ethnic origin, religion 3% 3% 0%
People being attacked/harassed - disability 4% 3% -1%
People being attacked/harassed - gender or sexual orientation 3% 3% 0%
Parking issues - 1% +1%
Other 4% 1% -3%
None of these 22% 15% -7%
Not provided 5% 4% -1%
Unweighted sample bases 857 469 -
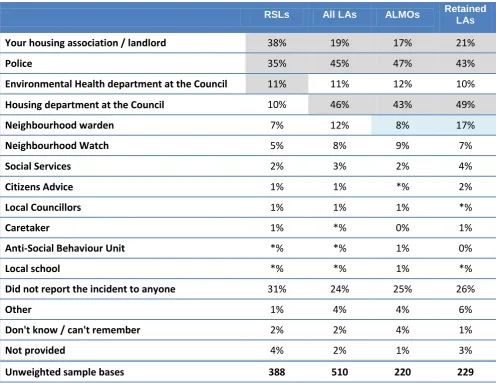
4.3 To whom problems/issues were reported
All tenants who have experienced issues or problems related to anti-social behaviour were then asked whether or not they had reported it, and if they had, to whom they had reported the issue or problem.
In comparison, the highest proportion of all LA tenants (46%) contacted the housing department at the Council, including almost half (49%) of retained LA tenants.
The Environmental Health department at the Council receives around one tenth of reports from each tenant group.
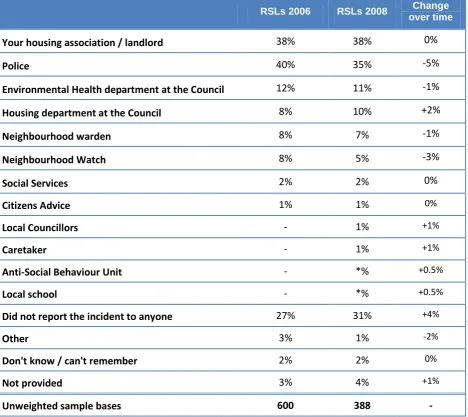
[image:27.595.67.564.200.583.2]Further to this, a higher proportion of RSL tenants (31%) did not report the incident or issue to anyone in comparison with all LA tenants (24%).
Table 5 Reporting issues and problems in the local neighbourhood2 (Q4)
RSLs All LAs ALMOs Retained LAs
Your housing association / landlord 38% 19% 17% 21%
Police 35% 45% 47% 43%
Environmental Health department at the Council 11% 11% 12% 10%
Housing department at the Council 10% 46% 43% 49%
Neighbourhood warden 7% 12% 8% 17%
Neighbourhood Watch 5% 8% 9% 7%
Social Services 2% 3% 2% 4%
Citizens Advice 1% 1% *% 2%
Local Councillors 1% 1% 1% *%
Caretaker 1% *% 0% 1%
Anti-Social Behaviour Unit *% *% 1% 0%
Local school *% *% 1% *%
Did not report the incident to anyone 31% 24% 25% 26%
Other 1% 4% 4% 6%
Don't know / can't remember 2% 2% 4% 1%
Not provided 4% 2% 1% 3%
Unweighted sample bases 388 510 220 229
The following table (6) shows comparisons with the panel survey 1 undertaken in 2006. There are no significant differences when comparing panel 1 with panel 7. Table 6 RSLs comparison with Panel Survey 1 (Panel 1 – Q31; Panel 7 – Q4)
RSLs 2006 RSLs 2008 Change over time
Your housing association / landlord 38% 38% 0%
Police 40% 35% -5%
Environmental Health department at the Council 12% 11% -1%
Housing department at the Council 8% 10% +2%
Neighbourhood warden 8% 7% -1%
Neighbourhood Watch 8% 5% -3%
Social Services 2% 2% 0%
Citizens Advice 1% 1% 0%
Local Councillors - 1% +1%
Caretaker - 1% +1%
Anti-Social Behaviour Unit - *% +0.5%
Local school - *% +0.5%
Did not report the incident to anyone 27% 31% +4%
Other 3% 1% -2%
Don't know / can't remember 2% 2% 0%
Not provided 3% 4% +1%
4.4 Satisfaction with the way in which the landlord dealt with the
problem
All tenants who had reported the incident or issue to their landlord were then asked to rate their level of satisfaction or dissatisfaction with the way in which their landlord dealt with the problem.
Results across the tenant groups show some variations. Interestingly, the same proportion of RSL tenants and all LA tenants (38% each) are satisfied with the way their report was dealt with. However, breaking this down by retained tenants and ALMO tenants, it can be seen that whilst over half (53%) of ALMO tenants are satisfied, this figure is just over a quarter (26%) for retained tenants, representing a significant difference.
[image:29.595.114.519.359.738.2]Further to this, around one in three (34%) RSL tenants are dissatisfied and a similar proportion of all LA tenants are dissatisfied (31%). Once again, disparity between ALMO and Retained tenants can be seen, with around one in five (19%) ALMO tenants dissatisfied, but almost double the amount of retained tenants is dissatisfied (37%).
Figure 5 Satisfaction with the way in which the landlord dealt with the problem (Q5)
Unweighted sample base = RSLs – 147; All LAs – 78; ALMOs – 34; Retained LAs - 38
11% 27% 21% 14% 20% 38% 34% 7% 18% 20% 19% 11% 20% 38% 31% 11% 23% 31% 25% 13% 6% 53% 19% 2% 10% 16% 18% 1% 36% 26% 37% 18%
0% 10% 20% 30% 40% 50% 60% Very satisfied
Fairly satisfied
Neither satisfied nor dissatisfied
The following table (7) shows comparisons with the panel survey 1 undertaken in 2006. There are no significant differences when comparing panel 1 with panel 7. Table 7 RSLs comparison with Panel Survey 1 (Panel 1 – Q32; Panel 7 – Q5)
RSLs 2006 RSLs 2008 Change over time
Very satisfied 16% 11% -5%
Fairly satisfied 21% 27% +6%
Neither satisfied nor dissatisfied 22% 21% -1%
Fairly dissatisfied 23% 14% -9%
Very dissatisfied 17% 20% +3%
Satisfied 37% 38% +1%
Dissatisfied 40% 34% -6%
Not provided 2% 7% +5%
4.5 Way in which the landlord dealt with the problem
All tenants who had contacted their landlord to report a local issue or incident were then asked to identify from a pre-determined list of options (see figure 6) how their landlord dealt with the problem.
The ways in which the landlord dealt with the problem differ by organisation type. Almost equal proportions of RSL tenants indicated that they were: ‘told to keep an incident diary’ (25%); ‘visited by representatives from the landlord’ (25%); ‘letters were sent to the residents involved’ (24%); and ‘the police were contacted’ (24%).
However, breaking all LA tenants down by ALMOs and Retained LAs, it can be seen that ALMO tenants are significantly more likely to have had a visit from representatives of their landlord than retained LA tenants (54% and 22% respectively).
[image:32.595.91.502.249.658.2]In terms of tenants who indicate that the problem was not dealt with, this is slightly higher for all LA tenants (29%), in comparison with RSL tenants (24%). However, when all LA tenants are separated out, it can be seen that for ALMO tenants, just 14% indicated the problem was not dealt with, whereas over two in five (45%) retained LA tenants indicated this was the case, a significant difference. However, caution is required due to low base.
Figure 6 Way in which landlord dealt with the problem (Q6)
Unweighted sample bases = RSLs – 147; All LAs – 78; ALMOs – 34; Retained LAs - 38
25% 25% 24% 24% 24% 10% 5% 3% 3% 7% 10% 40% 32% 29% 38% 41% 15% 4% 14% 13% 8% 7% 45% 54% 14% 53% 44% 26% 6% 6% 20% 2% 0% 43% 22% 45% 33% 41% 10% 4% 22% 11% 4% 10%
0% 10% 20% 30% 40% 50% 60% I was told to keep an incident diary
The residents involved were visited by representatives from the housing …
The problem was not dealt with Letters were sent to the residents
involved
The police were contacted The problem is being investigated at
the moment
The resident involved was evicted
I was referred to other agencies
Other
Don't know / can't remember
Not provided
The following table (8) shows comparisons with the panel survey 1 undertaken in 2006. There are no significant differences when comparing panel 1 with panel 7 at the 95.0% level.
When examining the variations across the last 2 years, it can be seen that there have been significant increases at the 98.0% level and above in relation to: tenants being told to keep an incident diary (+18% points); the nuisance residents being visited by their housing association or landlord (+19% points); the police being contacted (+15% points); and letters being sent to the residents involved (+10% points). All these results suggest an increase in action being taken by housing associations.
Table 8 RSLs comparison with Panel Survey 1 (Panel 1 – Q33; Panel 7 – Q6)
RSLs 2006 RSLs 2008 Change over time
I was told to keep an incident diary 7% 25% +18%*3
The residents involved were visited by representatives
from the housing association / landlord 6% 25% +19%*
4
The problem was not dealt with 25% 24% -1%
Letters were sent to the residents involved 14% 24% +10%*5
The police were contacted 9% 24% +15%*6
The problem is being investigated at the moment 5% 10% -5%
The resident involved was evicted 4% 5% +1%
I was referred to other agencies 4% 3% -1%
Other 6% 3% -3%
Don't know / can't remember 14% 7% -7%
Not provided 8% 10% +2%
Unweighted sample bases 214 147 -
3
*This variation is significant at the 99.9% level 4
*This variation is significant at the 99.9% level 5
4.6 The way the problem was dealt with by satisfaction with the way in
which the problem was dealt with
The following table (table 9) shows analysis of the way in which the problem was dealt with by satisfaction with the way the problem was dealt with. As can be seen, the base sizes are too low for all LAs to provide any significant differences. Looking at the results for RSLs, it can be seen that where the problem is not dealt with at all, tenants are significantly more likely to be dissatisfied (52%) than those satisfied (0%). Further to this, tenants are significantly more likely to be satisfied where:
Letters were sent to the residents involved (37% satisfied, in comparison with 17% dissatisfied);
The police were contacted (36% satisfied in comparison with 17% dissatisfied); and The residents involved were visited by representatives of the landlord (45% satisfied in
comparison with 15% dissatisfied).
These results point to the suggestion that where tenants can see tangible results from their landlord in terms of action against ASB, satisfaction tends to be higher.
Table 9 The way the problem was dealt with by satisfaction with the way in which the problem was dealt (Q6 ran by Q5)7
How the problem was dealt with
Satisfaction with the way in which the problem was dealt with
RSLs All LAs
Satisfied Dissatisfied Satisfied Dissatisfied
The problem was not dealt with 0% 52% 11% 59%
Letters were sent to the residents involved 37% 17% 56% 10%
The police were contacted 36% 17% 50% 32%
I was told to keep an incident diary 28% 28% 35% 41%
The residents involved were visited by representatives
from the housing association / landlord 45% 15% 51% 15%
The problem is being investigated at the moment 5% 16% 20% 5%
The resident involved was evicted 8% 3% 9% 0%
I was referred to other agencies 1% 4% 3% 27%
Other 6% 0% 19% 9%
Don't know / can't remember 5% 10% 3% 18%
Not provided 9% 4% 3% 0%
4.7 Reasons for not reporting problems or issues to the landlord
All tenants who indicated that they have not reported the incident or problem they have experienced in the last 12 months to their landlord were then asked the reasons for this. The main reason given by RSL tenants is that they believe the issue or problem is not the responsibility (13%) of the landlord. This is followed by around one in ten (9%) who indicated the problem was only minor and therefore not worth reporting and a similar proportion who indicated this is a matter for the police or other agencies (8%). For all LA tenants, the highest proportions indicated that it was a matter for the police or other agencies and that when they do report something; nothing is done about it (8% each). Breaking this down by ALMOs and Retained LAs, it can be seen that similar proportions consider the problem to be a matter for other agencies or police (10% and 7% respectively).
Table 10 Reasons for not reporting problems or issues to the landlord8 (Q7)
RSLs All LAs ALMOs Retained LAs
It is not their responsibility 13% 4% 4% 3%
Only a minor problem / not worth reporting 9% 6% 5% 7%
It was a matter for the police / other agencies 8% 8% 10% 7%
Not sure they could have done anything about it 7% 1% 2% 1%
When reported, nothing is done 7% 8% 12% 4%
Fear of reprisals / intimidation 4% 2% 2% 3%
I blamed the lack of facilities for the young 3% *% 1% 0%
Someone else did it before me 2% 1% 1% 2%
I didn't know who to contact 1% 1% 2% 1%
Needed proof / witnesses 1% 1% 1% *%
Dealt with it myself 2% *% 1% 0%
Lack of time / too busy *% *% 0% 1%
Language problems *% 0% - -
Incident happened outside of hours *% *% *% 0%
The situation needed dealing with straight away *% *% 0% *%
Didn’t want to get involved / not my business - 1% 2% *%
Other 2% 3% 3% 3%
Don't know / can't remember 10% 9% 6% 13%
Not provided 33% 55% 52% 56%
Unweighted sample bases 241 432 186 191
The following table (11) shows comparisons with the panel survey 1 undertaken in 2006. There are no significant differences when comparing panel 1 with panel 7.
[image:36.595.72.567.172.678.2]When examining the variations across the last 2 years, it can be seen that there have been only slight increases and decreases; therefore few inferences as to change in perceptions can be made.
Table 11 RSLs comparison with Panel Survey 1 (Panel 1 – Q34; Panel 7 – Q7)
RSLs 2006 RSLs 2008 Change over
time
It is not their responsibility 14% 13% -1%
Only a minor problem / not worth reporting 7% 9% +2%
It was a matter for the police / other agencies 9% 8% -1%
Not sure they could have done anything about it 7% 7% 0%
When reported, nothing is done 6% 7% +1%
Fear of reprisals / intimidation 2% 4% +2%
I blamed the lack of facilities for the young *% 3% +2.5%
Someone else did it before me 2% 2% 0%
I didn't know who to contact *% 1% +*%
Needed proof / witnesses - 1% +1%
Dealt with it myself - 2% +2%
Lack of time / too busy - *% +0.5%
Language problems - *% +0.5%
Incident happened outside of hours - *% +0.5%
The situation needed dealing with straight away - *% +0.5%
Didn’t want to get involved / not my business - - -
Other 7% 2% -5%
Don't know / can't remember 11% 10% -1%
Not provided 36% 33% -3%
4.8 Effectively dealing with anti-social behaviour
[image:37.595.36.580.167.714.2]All tenants were then asked to rate the level of agreement that their landlord deals effectively with various types of anti-social behaviour. The table (12) below shows levels of agreement and disagreement for RSL tenants.
Table 12 Agreement landlord deals effectively with ASB (RSL tenants) (Q8)
Strongly agree Tend to agree Nei-ther Tend to disagree Strongly
disagree Agree
Dis-agree Balance score9 Not provided Noisy neighbours or loud
parties 10% 14% 31% 10% 6% 24% 16% +8% 29%
Rubbish or litter lying
around 7% 15% 27% 13% 12% 22% 25% -3% 26%
Nuisance neighbours or
problem families 10% 13% 31% 10% 9% 22% 20% +2% 27%
Vandalism, graffiti & other deliberate damage to property or vehicles
6% 12% 32% 13% 10% 18% 23% -5% 27%
Teenagers hanging
around on the street 7% 8% 36% 12% 10% 15% 23% -8% 27%
People using or dealing
drugs 6% 9% 33% 13% 10% 15% 23% -8% 29%
People being attacked or harassed because of their skin colour, ethnic origin, religion
8% 7% 40% 6% 6% 15% 12% +3% 33%
People being drunk or
rowdy in public places 6% 8% 35% 11% 9% 14% 21% -7% 31%
Abandoned or burnt out
cars 8% 7% 38% 7% 8% 14% 15% -1% 33%
People being attacked or harassed because of a disability
7% 7% 40% 6% 7% 14% 13% +1% 33%
People being insulted, pestered or intimidated in the street
7% 6% 37% 9% 8% 13% 17% -4% 33%
People being attacked or harassed because of their gender or sexual orientation
7% 6% 40% 6% 7% 13% 13% - 34%
Unweighted sample base = 469
As the table on the previous page shows, RSL tenants indicate that their housing association exhibits success in dealing with noisy neighbours and loud parties (balance score of +8%); people being attacked or harassed because of their skin colour, ethnic origin or religion (+3%); and nuisance neighbours or problem families (+2%).
In terms of areas where tenants feel the housing association is less successful, the main areas are: teenagers hanging around on the street (balance score -8%); people using or dealing drugs (-8%); and people being drunk or rowdy in public places (-7%).
4.8.1 Further analysis
Concentrating on the areas where RSL tenants feel their landlord is less successful (teenagers hanging around the street; people using or dealing drugs; and people being drunk or rowdy in public places), the following paragraphs highlight the key findings amongst tenants who have:
Made a complaint to their landlord, other agencies or not made a complaint;
Are satisfied or dissatisfied with the way in which the complaint was dealt with; and Whether or not they are aware of ASB policy.
4.8.2 Teenagers hanging around on the street
Tenants significantly more likely to disagree their landlord is successful in tackling teenagers hanging around the streets are:
Tenants who have reported the incident to an agency other than their landlord (36%), in comparison with those who did not report the incident at all (21%);
Tenants who are dissatisfied with the way in which their landlord dealt with their ASB report, than those who are satisfied (40% and 18% respectively); and
Tenants who are unaware if their landlord has an ASB policy (35%), in comparison with those who are aware of an ASB policy (21%).
4.8.3 People using or dealing drugs
Tenants significantly more likely to disagree their landlord is successful in tackling people using or dealing drugs are:
Tenants who are dissatisfied with the way in which their landlord dealt with their ASB report, than those who are satisfied (41% and 20% respectively); and
Tenants who are unaware if their landlord has an ASB policy (34%), in comparison with those who are aware of an ASB policy (21%).
Of those tenants who disagree that their landlord is effective in dealing with people using or dealing drugs, three in ten (30%) made an ASB report to their landlord which is a slightly higher proportion than those who did not report the incident to anyone (25%), although this difference is not significant.
Tenants who are dissatisfied with the way in which their landlord dealt with their ASB report, than those who are satisfied (35% and 17% respectively); and
Tenants who are unaware if their landlord has an ASB policy (36%), in comparison with those who are aware of an ASB policy (16%).
The table below shows overall levels of agreement and disagreement for all LA tenants.
Table 13 Agreement landlord deals effectively with ASB (All LA tenants) (Q8)
Strongly agree Tend to agree Nei-ther Tend to disagree Strongly
disagree Agree
Dis-agree Balance score10 Not provided Rubbish or litter lying
around 14% 22% 18% 16% 13% 35% 28% +7% 18%
Vandalism, graffiti & other deliberate damage to property or vehicles
11% 19% 24% 13% 10% 30% 23% +7% 23%
Abandoned or burnt out
cars 9% 17% 33% 8% 6% 27% 14% +13% 26%
Nuisance neighbours or
problem families 10% 16% 29% 14% 10% 26% 24% +2% 21%
People being attacked or harassed because of their skin colour, ethnic origin, religion
12% 12% 38% 6% 6% 25% 12% +13% 25%
Noisy neighbours or loud
parties 10% 14% 28% 14% 10% 24% 24% - 24%
People being attacked or harassed because of a disability
12% 12% 39% 6% 6% 24% 13% +11% 25%
People using or dealing
drugs 10% 13% 27% 14% 13% 23% 27% -4% 23%
People being attacked or harassed because of their gender or sexual orientation
11% 12% 39% 6% 6% 23% 12% +11% 26%
Teenagers hanging
around on the street 9% 12% 29% 19% 12% 21% 31% -10% 19%
People being drunk or
rowdy in public places 9% 11% 34% 14% 9% 20% 23% -3% 23%
People being insulted, pestered or intimidated in the street
7% 12% 37% 11% 7% 20% 18% +2% 25%
Unweighted sample base = 617
As the table above shows, all LA tenants indicate that their landlord exhibits success in dealing with the majority of aspects, particularly abandoned or burnt our cars (balance score of +13%); people being attacked or harassed because of their skin colour, ethnic origin or religion (+13%); people being attacked or harassed because of their gender or sexual orientation (+11%); and people being attacked or harassed because of a disability (+11%).
In terms of areas where tenants feel their landlord is less successful, the main areas are: teenagers hanging around on the street (balance score -10%); and people being drunk or rowdy in public places (-3%), very similar to the aspects described by tenants.
4.8.5 Further analysis
Concentrating on the areas where all LA tenants feel their landlord is less successful (teenagers hanging around the street and people being drunk or rowdy in public places) the following paragraphs highlight the key findings amongst tenants who have: Made a complaint to their landlord, other agencies or not made a complaint;
Are satisfied or dissatisfied with the way in which the complaint was dealt with; and Whether or not they are aware of ASB policy.
4.8.6 Teenagers handing around on the streets
Tenants more likely to disagree their landlord is successful in tackling teenagers hanging around the streets are:
Tenants who are dissatisfied with the way in which their landlord dealt with their ASB report, than those who are satisfied (67% and 17% respectively); and
Tenants who are unaware if their landlord has an ASB policy (36%), in comparison with those who are aware of an ASB policy (16%), a significant difference.
4.8.7 ALMOs and retained LAs
Looking at the results for all LAs, by the sub-groups of ALMOs and retained LAs, some significant variations can be seen.
Concentrating on the areas where tenants tend to disagree that their landlord is effective:
Retained LA tenants are significantly more likely than ALMO tenants to disagree that their landlord is effective at dealing with teenagers hanging around on the streets (36% and 27% respectively);
Retained LA tenants are significantly more likely than ALMO tenants to disagree that their landlord is effective at dealing with vandalism and graffiti (29% and 19%
respectively); and
The following table (14) shows comparisons with the panel survey 1 undertaken in 2006. There are no significant differences when comparing panel 1 with panel 7. Table 14 RSLs comparison with Panel Survey 1 (% agree) (Panel 1 – Q35; Panel 7 – Q8)
RSLs 2006 RSLs 2008 Change
over time
Noisy neighbours or loud parties 18% 24% +6%
Rubbish or litter lying around 20% 22% +2%
Nuisance neighbours or problem families 19% 22% +3%
Vandalism, graffiti & other deliberate damage to
property or vehicles 18% 18% 0%
Teenagers hanging around on the street 12% 15% +3%
People using or dealing drugs 13% 15% +2%
People being attacked or harassed because of their
skin colour, ethnic origin, religion 12% 15% +3%
People being drunk or rowdy in public places 11% 14% +3%
Abandoned or burnt out cars 14% 14% 0%
People being attacked or harassed because of a
disability 12% 14% +2%
People being insulted, pestered or intimidated in
the street 10% 13% +3%
People being attacked or harassed because of their
gender or sexual orientation 11% 13% +2%
4.9 Dealing with ASB where tenants have had experience of ASB (RSL
tenants)
To examine whether or not RSL tenants think their landlord is effective in dealing with various forms of ASB, the following table (14) depicts those tenants who have had experience of the varying forms of ASB analysed by how effective they think their landlord is at dealing with that particular type of ASB.
Overall, higher proportions of tenants who have experienced the various forms of ASB are more likely to disagree than agree that their landlord is effective at dealing with ASB.
Where base sizes are large enough to give robust results (i.e. over 30 cases), it can be seen that high negative balance scores are achieved for how effective the landlord is at dealing with:
People using or dealing drugs (-34%);
People being insulted, pestered or intimidated in the street (-30%); and