http://wrap.warwick.ac.uk/
Original citation:
The LHCb Collaboration (Including: Gershon, T. J., Harrison, P. F., Latham, Thomas,
Poluektov, Anton, Whitehead, M. (Mark) and Williams, M. P.). (2011) Measurement of
J/Ψ production in pp collisions at s=7 TeV. The European Physical Journal C, Volume
71 (Number 5). Article number 1645.
Permanent WRAP url:
http://wrap.warwick.ac.uk/40030
Copyright and reuse:
The Warwick Research Archive Portal (WRAP) makes this work of researchers of the
University of Warwick available open access under the following conditions.
This article is made available under the Creative Commons Attribution- 3.0 Unported
(CC BY 3.0) license and may be reused according to the conditions of the license. For
more details see
http://creativecommons.org/licenses/by/3.0/
A note on versions:
The version presented in WRAP is the published version, or, version of record, and may
be cited as it appears here.
DOI 10.1140/epjc/s10052-011-1645-y
Regular Article - Experimental Physics
Measurement of
J/ψ
production in
pp
collisions at
√
s
=
7 TeV
The LHCb Collaboration
R. Aaij23, B. Adeva36, M. Adinolfi42, C. Adrover6, A. Affolder48, Z. Ajaltouni5, J. Albrecht37, F. Alessio6,37, M. Alexander47, P. Alvarez Cartelle36, A.A. Alves Jr.22, S. Amato2, Y. Amhis38, J. Amoraal23, J. Anderson39, R.B. Appleby50, O. Aquines Gutierrez10, L. Arrabito53,q, M. Artuso52, E. Aslanides6, G. Auriemma22,n,
S. Bachmann11, D.S. Bailey50, V. Balagura30,37, W. Baldini16, R.J. Barlow50, C. Barschel37, S. Barsuk7, A. Bates47, C. Bauer10, T. Bauer23, A. Bay38, I. Bediaga1, K. Belous34, I. Belyaev30,37, E. Ben-Haim8, M. Benayoun8,
G. Bencivenni18, R. Bernet39, M.-O. Bettler17,37, M. van Beuzekom23, S. Bifani12, A. Bizzeti17,i, P.M. Bjørnstad50, T. Blake49, F. Blanc38, C. Blanks49, J. Blouw11, S. Blusk52, A. Bobrov33, V. Bocci22, A. Bondar33, N. Bondar29,37, W. Bonivento15, S. Borghi47, A. Borgia52, E. Bos23, T.J.V. Bowcock48, C. Bozzi16, T. Brambach9, J. van den Brand24, J. Bressieux38, S. Brisbane51, M. Britsch10, T. Britton52, N.H. Brook42, H. Brown48, A. Büchler-Germann39,
A. Bursche39, J. Buytaert37, S. Cadeddu15, J.M. Caicedo Carvajal37, O. Callot7, M. Calvi20,k, M. Calvo Gomez35,o, A. Camboni35, P. Campana18, A. Carbone14, G. Carboni21,l, R. Cardinale19,j, A. Cardini15, L. Carson36,
K. Carvalho Akiba23, G. Casse48, M. Cattaneo37, M. Charles51, Ph. Charpentier37, N. Chiapolini39, X. Cid Vidal36, P.J. Clark46, P.E.L. Clarke46, M. Clemencic37, H.V. Cliff43, J. Closier37, C. Coca28, V. Coco23, J. Cogan6, P. Collins37, F. Constantin28, G. Conti38, A. Contu51, M. Coombes42, G. Corti37, G.A. Cowan38, R. Currie46, B. D’Almagne7, C. D’Ambrosio37, W. Da Silva8, P. David8, I. De Bonis4, S. De Capua21,l, M. De Cian39, F. De Lorenzi12,
J.M. De Miranda1, L. De Paula2, P. De Simone18, D. Decamp4, H. Degaudenzi38,37, M. Deissenroth11, L. Del Buono8, C. Deplano15, O. Deschamps5, F. Dettori15,e, J. Dickens43, H. Dijkstra37, M. Dima28, P. Diniz Batista1, S. Donleavy48, D. Dossett44, A. Dovbnya40, F. Dupertuis38, R. Dzhelyadin34, C. Eames49, S. Easo45, U. Egede49, V. Egorychev30, S. Eidelman33, D. van Eijk23, F. Eisele11, S. Eisenhardt46, L. Eklund47, D.G. d’Enterria35,p, D. Esperante Pereira36, L. Estève43, E. Fanchini20,k, C. Färber11, G. Fardell46, C. Farinelli23, S. Farry12, V. Fave38, V. Fernandez Albor36, M. Ferro-Luzzi37, S. Filippov32, C. Fitzpatrick46, F. Fontanelli19,j, R. Forty37, M. Frank37, C. Frei37, M. Frosini17,g, J.L. Fungueirino Pazos36, S. Furcas20, A. Gallas Torreira36, D. Galli14,d, M. Gandelman2, P. Gandini51, Y. Gao3, J.-C. Garnier37, J. Garofoli52, L. Garrido35, C. Gaspar37, N. Gauvin38, M. Gersabeck37, T. Gershon44, Ph. Ghez4, V. Gibson43, V.V. Gligorov37, C. Göbel54,r, D. Golubkov30, A. Golutvin49,30,37, A. Gomes2, H. Gordon51,
M. Grabalosa Gándara35, R. Graciani Diaz35, L.A. Granado Cardoso37, E. Graugés35, G. Graziani17, A. Grecu28, S. Gregson43, B. Gui52, E. Gushchin32, Yu. Guz34,37, T. Gys37, G. Haefeli38, S.C. Haines43, T. Hampson42,
S. Hansmann-Menzemer11, R. Harji49, N. Harnew51, P.F. Harrison44, J. He7, K. Hennessy48, P. Henrard5,
J.A. Hernando Morata36, E. van Herwijnen37, A. Hicheur38, E. Hicks48, W. Hofmann10, K. Holubyev11, P. Hopchev4, W. Hulsbergen23, P. Hunt51, T. Huse48, R.S. Huston12, D. Hutchcroft48, V. Iakovenko7,41, C. Iglesias Escudero36, P. Ilten12, J. Imong42, R. Jacobsson37, M. Jahjah Hussein5, E. Jans23, F. Jansen23, P. Jaton38, B. Jean-Marie7, F. Jing3, M. John51, D. Johnson51, C.R. Jones43, B. Jost37, F. Kapusta8, T.M. Karbach9, J. Keaveney12, U. Kerzel37, T. Ketel24, A. Keune38, B. Khanji6, Y.M. Kim46, M. Knecht38, S. Koblitz37, A. Konoplyannikov30, P. Koppenburg23, A. Kozlinskiy23, L. Kravchuk32, G. Krocker11, P. Krokovny11, F. Kruse9, K. Kruzelecki37, M. Kucharczyk25, S. Kukulak25, R. Kumar14,37, T. Kvaratskheliya30, V.N. La Thi38, D. Lacarrere37, G. Lafferty50, A. Lai15, R.W. Lambert37, G. Lanfranchi18, C. Langenbruch11, T. Latham44, R. Le Gac6, J. van Leerdam23, J.-P. Lees4, R. Lefèvre5, A. Leflat31,37, J. Lefrançois7, O. Leroy6, T. Lesiak25, L. Li3, Y.Y. Li43, L. Li Gioi5, M. Lieng9, M. Liles48, R. Lindner37, C. Linn11, B. Liu3, G. Liu37, J.H. Lopes2, E. Lopez Asamar35, N. Lopez-March38, J. Luisier38,
B. M’charek24, F. Machefert7, I.V. Machikhiliyan4,30, F. Maciuc10, O. Maev29, J. Magnin1, A. Maier37, S. Malde51, R.M.D. Mamunur37, G. Manca15,37,e, G. Mancinelli6, N. Mangiafave43, U. Marconi14, R. Märki38, J. Marks11, G. Martellotti22, A. Martens7, L. Martin51, A. Martín Sánchez7, D. Martinez Santos37, A. Massafferri1, Z. Mathe12, C. Matteuzzi20, M. Matveev29, V. Matveev34, E. Maurice6, B. Maynard52, A. Mazurov32, G. McGregor50,
T. Nakada38, R. Nandakumar45, J. Nardulli45, M. Nedos9, M. Needham46, N. Neufeld37, M. Nicol7, S. Nies9, V. Niess5, N. Nikitin31, A. Oblakowska-Mucha26, V. Obraztsov34, S. Oggero23, O. Okhrimenko41, R. Oldeman15,e, M. Orlandea28, A. Ostankov34, B. Pal52, J. Palacios39, M. Palutan18, J. Panman37, A. Papanestis45,
M. Pappagallo13,c, C. Parkes47,37, C.J. Parkinson49, G. Passaleva17, G.D. Patel48, M. Patel49, S.K. Paterson49,37, G.N. Patrick45, C. Patrignani19,j, C. Pavel-Nicorescu28, A. Pazos Alvarez36, A. Pellegrino23, G. Penso22,m, M. Pepe Altarelli37, S. Perazzini14,d, D.L. Perego20,k, E. Perez Trigo36, A. Pérez-Calero Yzquierdo35, P. Perret5, A. Petrella16,37,f, A. Petrolini19,j, B.Pie Valls35, B. Pietrzyk4, D. Pinci22, R. Plackett47, S. Playfer46, M. Plo Casasus36, G. Polok25, A. Poluektov44,33, E. Polycarpo2, D. Popov10, B. Popovici28, C. Potterat38, A. Powell51, T. du Pree23, V. Pugatch41, A. Puig Navarro35, W. Qian3, J.H. Rademacker42, B. Rakotomiaramanana38, I. Raniuk40, G. Raven24, S. Redford51, W. Reece49, A.C. dos Reis1, S. Ricciardi45, K. Rinnert48, D.A. Roa Romero5, P. Robbe7,37,a,
E. Rodrigues47, F. Rodrigues2, C. Rodriguez Cobo36, P. Rodriguez Perez36, G.J. Rogers43, V. Romanovsky34, J. Rouvinet38, T. Ruf37, H. Ruiz35, G. Sabatino21,l, J.J. Saborido Silva36, N. Sagidova29, P. Sail47, B. Saitta15,e, C. Salzmann39, A. Sambade Varela37, M. Sannino19,j, R. Santacesaria22, R. Santinelli37, E. Santovetti21,l, M. Sapunov6, A. Sarti18, C. Satriano22,n, A. Satta21, M. Savrie16,f, D. Savrina30, P. Schaack49, M. Schiller11, S. Schleich9, M. Schmelling10, B. Schmidt37, O. Schneider38, A. Schopper37, M.-H. Schune7, R. Schwemmer37, A. Sciubba18,m, M. Seco36, A. Semennikov30, K. Senderowska26, N. Serra23, J. Serrano6, B. Shao3, M. Shapkin34, I. Shapoval40,37, P. Shatalov30, Y. Shcheglov29, T. Shears48, L. Shekhtman33, O. Shevchenko40, V. Shevchenko30, A. Shires49, E. Simioni24, H.P. Skottowe43, T. Skwarnicki52, A.C. Smith37, K. Sobczak5, F.J.P. Soler47, A. Solomin42, P. Somogy37, F. Soomro49, B. Souza De Paula2, B. Spaan9, A. Sparkes46, E. Spiridenkov29, P. Spradlin51, F. Stagni37, O. Steinkamp39, O. Stenyakin34, S. Stoica28, S. Stone52, B. Storaci23, U. Straumann39, N. Styles46, M. Szczekowski27, P. Szczypka38, T. Szumlak26, S. T’Jampens4, V. Talanov34, E. Teodorescu28, H. Terrier23, F. Teubert37,
C. Thomas51,45, E. Thomas37, J. van Tilburg39, V. Tisserand4, M. Tobin39, S. Topp-Joergensen51, M.T. Tran38, A. Tsaregorodtsev6, N. Tuning23, A. Ukleja27, P. Urquijo52, U. Uwer11, V. Vagnoni14, G. Valenti14,
R. Vazquez Gomez35, P. Vazquez Regueiro36, S. Vecchi16, J.J. Velthuis42, M. Veltri17,h, K. Vervink37, B. Viaud7, I. Videau7, X. Vilasis-Cardona35,o, J. Visniakov36, A. Vollhardt39, D. Voong42, A. Vorobyev29, An. Vorobyev29, H. Voss10, K. Wacker9, S. Wandernoth11, J. Wang52, D.R. Ward43, A.D. Webber50, D. Websdale49, M. Whitehead44, D. Wiedner11, L. Wiggers23, G. Wilkinson51, M.P. Williams44,45, M. Williams49, F.F. Wilson45, J. Wishahi9,
M. Witek25, W. Witzeling37, S.A. Wotton43, K. Wyllie37, Y. Xie46, F. Xing51, Z. Yang3, G. Ybeles Smit23, R. Young46, O. Yushchenko34, M. Zavertyaev10,b, L. Zhang52, W.C. Zhang12, Y. Zhang3, A. Zhelezov11, L. Zhong3, E. Zverev31
1Centro Brasileiro de Pesquisas Físicas (CBPF), Rio de Janeiro, Brazil 2Universidade Federal do Rio de Janeiro (UFRJ), Rio de Janeiro, Brazil 3Center for High Energy Physics, Tsinghua University, Beijing, China 4
LAPP, Université de Savoie, CNRS/IN2P3, Annecy-Le-Vieux, France
5
Clermont Université, Université Blaise Pascal, CNRS/IN2P3, LPC, Clermont-Ferrand, France
6
CPPM, Aix-Marseille Université, CNRS/IN2P3, Marseille, France
7
LAL, Université Paris-Sud, CNRS/IN2P3, Orsay, France
8
LPNHE, Université Pierre et Marie Curie, Université Paris Diderot, CNRS/IN2P3, Paris, France
9
Fakultät Physik, Technische Universität Dortmund, Dortmund, Germany
10
Max-Planck-Institut für Kernphysik (MPIK), Heidelberg, Germany
11
Physikalisches Institut, Ruprecht-Karls-Universität Heidelberg, Heidelberg, Germany
12
School of Physics, University College Dublin, Dublin, Ireland
13
Sezione INFN di Bari, Bari, Italy
14
Sezione INFN di Bologna, Bologna, Italy
15
Sezione INFN di Cagliari, Cagliari, Italy
16Sezione INFN di Ferrara, Ferrara, Italy 17Sezione INFN di Firenze, Firenze, Italy
18Laboratori Nazionali dell’INFN di Frascati, Frascati, Italy 19
Sezione INFN di Genova, Genova, Italy
20
Sezione INFN di Milano Bicocca, Milano, Italy
21
Sezione INFN di Roma Tor Vergata, Roma, Italy
22
Sezione INFN di Roma Sapienza, Roma, Italy
23
Nikhef National Institute for Subatomic Physics, Amsterdam, Netherlands
24
Nikhef National Institute for Subatomic Physics and Vrije Universiteit, Amsterdam, Netherlands
25
Henryk Niewodniczanski Institute of Nuclear Physics Polish Academy of Sciences, Cracow, Poland
26
Faculty of Physics & Applied Computer Science, Cracow, Poland
27
Soltan Institute for Nuclear Studies, Warsaw, Poland
28
Horia Hulubei National Institute of Physics and Nuclear Engineering, Bucharest-Magurele, Romania
29
Petersburg Nuclear Physics Institute (PNPI), Gatchina, Russia
30
31Institute of Nuclear Physics, Moscow State University (SINP MSU), Moscow, Russia
32Institute for Nuclear Research of the Russian Academy of Sciences (INR RAN), Moscow, Russia 33Budker Institute of Nuclear Physics (BINP), Novosibirsk, Russia
34
Institute for High Energy Physics (IHEP), Protvino, Russia
35
Universitat de Barcelona, Barcelona, Spain
36
Universidad de Santiago de Compostela, Santiago de Compostela, Spain
37
European Organization for Nuclear Research (CERN), Geneva, Switzerland
38
Ecole Polytechnique Fédérale de Lausanne (EPFL), Lausanne, Switzerland
39
Physik-Institut, Universität Zürich, Zürich, Switzerland
40
NSC Kharkiv Institute of Physics and Technology (NSC KIPT), Kharkiv, Ukraine
41
Institute for Nuclear Research of the National Academy of Sciences (KINR), Kyiv, Ukraine
42
H.H. Wills Physics Laboratory, University of Bristol, Bristol, UK
43
Cavendish Laboratory, University of Cambridge, Cambridge, UK
44
Department of Physics, University of Warwick, Coventry, UK
45
STFC Rutherford Appleton Laboratory, Didcot, UK
46
School of Physics and Astronomy, University of Edinburgh, Edinburgh, UK
47
School of Physics and Astronomy, University of Glasgow, Glasgow, UK
48
Oliver Lodge Laboratory, University of Liverpool, Liverpool, UK
49Imperial College London, London, UK
50School of Physics and Astronomy, University of Manchester, Manchester, UK 51Department of Physics, University of Oxford, Oxford, UK
52
Syracuse University, Syracuse, NY, USA
53
CC-IN2P3, CNRS/IN2P3, Lyon-Villeurbanne, France
54
Pontifícia Universidade Católica do Rio de Janeiro (PUC-Rio), Rio de Janeiro, Brazil
Received: 2 March 2011 / Revised: 6 April 2011 / Published online: 19 May 2011
© CERN for the benefit of the LHCb collaboration 2011. This article is published with open access at Springerlink.com
Abstract The production ofJ/ψ mesons in proton–proton collisions at√s=7 TeV is studied with the LHCb detec-tor at the LHC. The differential cross-section for prompt
J/ψ production is measured as a function of theJ/ψ trans-verse momentum pT and rapidity y in the fiducial re-gionpT∈ [0;14]GeV/candy∈ [2.0;4.5]. The differential
ae-mail:robbe@lal.in2p3.fr
bP.N. Lebedev Physical Institute, Russian Academy of Science (LPI
RAS), Moscow, Russia
cUniversità di Bari, Bari, Italy
dUniversità di Bologna, Bologna, Italy
eUniversità di Cagliari, Cagliari, Italy
fUniversità di Ferrara, Ferrara, Italy
gUniversità di Firenze, Firenze, Italy
hUniversità di Urbino, Urbino, Italy
iUniversità di Modena e Reggio Emilia, Modena, Italy
jUniversità di Genova, Genova, Italy
kUniversità di Milano Bicocca, Milano, Italy
lUniversità di Roma Tor Vergata, Roma, Italy
mUniversità di Roma La Sapienza, Roma, Italy
nUniversità della Basilicata, Potenza, Italy
oLIFAELS, La Salle, Universitat Ramon Llull, Barcelona, Spain
pInstitució Catalana de Recerca i Estudis Avançats (ICREA),
Barcelona, Spain
qAssociated member
rAssociated to Universidade Federal do Rio de Janeiro (UFRJ),
Rio de Janeiro, Brazil
cross-section and fraction ofJ/ψfromb-hadron decays are also measured in the samepTandy ranges. The analysis is based on a data sample corresponding to an integrated lumi-nosity of 5.2 pb−1. The measured cross-sections integrated over the fiducial region are 10.52±0.04±1.40+−12..6420µb for promptJ/ψ production and 1.14±0.01±0.16 µb forJ/ψ
fromb-hadron decays, where the first uncertainty is statisti-cal and the second systematic. The promptJ/ψ production cross-section is obtained assuming noJ/ψ polarisation and the third error indicates the acceptance uncertainty due to this assumption.
1 Introduction
(NRQCD), where theccpair can be produced in a colour-octet state [8–10], can explain the shape and the magnitude of the measuredJ/ψ cross-section. However, they predict a substantial transverse component for the polarisation ofJ/ψ
mesons at largepT. This is in disagreement with the CDF
J/ψ polarisation measurement [11], casting doubt on the conclusion that the colour-octet terms dominate J/ψ pro-duction. More recent theoretical studies have considered the addition of the gg→J/ψ cc process to the CSM [12,13], or higher order corrections in αs: gg→J/ψ gg [14] and
gg→J/ψ ggg [15,16]. With these additions, the
discrep-ancy between theoretical predictions and experimental mea-surements significantly decreases. However, the agreement is still not perfect, leaving open the question of a complete description ofJ/ψ hadroproduction. The large rate ofJ/ψ
production at the Large Hadron Collider (LHC) opens the door to new analyses that extend the phase-space region ex-plored so far, such as that recently made by the CMS col-laboration [17]. In particular, the LHCb detector provides the possibility to extend the measurements to the forward rapidity region.
Three sources ofJ/ψ production in ppcollisions need to be considered when comparing experimental observables and theoretical calculations: direct J/ψ production, feed-downJ/ψ from the decay of other heavier prompt charmo-nium states likeχc1,χc2orψ (2S), andJ/ψ fromb-hadron decay chains. The sum of the first two sources will be called “promptJ/ψ” in the following. The third source will be ab-breviated as “J/ψ fromb”.
This paper presents the measurement of the differ-ential production cross-section of both prompt J/ψ and
J/ψ frombas a function of theJ/ψ transverse momentum and rapidity (y) with respect to the beam axis in the fiducial regionpT∈ [0;14]GeV/candy∈ [2.0;4.5]. The effect due to the unknownJ/ψ polarisation is estimated by providing results for the differential cross-sections for three extreme polarisation cases. The analysis of a larger data sample is needed to measure theJ/ψ polarisation over the kinematic range considered.
2 The LHCb detector, data sample and Monte Carlo simulation
The LHCb detector is a forward spectrometer described in detail in [18]. The detector elements are placed along the beam line of the LHC starting with the Vertex Locator (VELO), a silicon strip device that surrounds the pp inter-action region and is positioned with its sensitive area 8 mm from the beam during collisions. The VELO provides pre-cise measurements of the positions of the primarypp inter-action vertices and decay vertices of long-lived hadrons, and
contributes to the measurement of track momenta. Other de-tectors used to measure track momenta are a large area sili-con strip detector located before a 4 Tm dipole magnet and a combination of silicon strip detectors and straw drift cham-bers placed after it. Two Ring Imaging Cherenkov detectors are used to identify charged hadrons. Further downstream an Electromagnetic Calorimeter system (ECAL, Preshower— PRS—and Scintillating Pad Detector—SPD) is used for photon detection and electron identification, followed by a Hadron Calorimeter (HCAL). The muon detection consists of five muon stations (MUON) equipped with multi-wire proportional chambers, with the exception of the centre of the first station, which uses triple-GEM detectors. For the data included in this analysis all detector components were fully operational and in a stable condition and the main com-ponent of the dipole field was pointing upwards.
The LHCb trigger system consists of two levels. The first level (L0), implemented in hardware, is designed to reduce the LHC bunch crossing frequency of 40 MHz to a maxi-mum of 1 MHz, at which the complete detector is read out. The ECAL, HCAL and MUON provide the capability of first-level hardware triggering. The second level is a soft-ware trigger (High Level Trigger, HLT) which runs on an event-filter farm and is implemented in two stages. HLT1 performs a partial event reconstruction to confirm the L0 trigger decision, and HLT2 performs a full event reconstruc-tion to further discriminate signal events.
The study reported here uses data corresponding to an in-tegrated luminosity of 5.2 pb−1of ppcollisions produced by the LHC at a centre-of-mass energy of 7 TeV in Septem-ber 2010, with at maximum 1.6 MHz collision frequency. The data were collected using two L0 trigger lines: the single-muon line, which requires one muon candidate with apTlarger than 1.4 GeV/c, and the dimuon line, which re-quires two muon candidates withpTlarger than 0.56 GeV/c and 0.48 GeV/c, respectively. They provide the input candi-dates for the corresponding HLT1 lines: the first one con-firms the single-muon candidates from L0, and applies a harderpTselection at 1.8 GeV/c; the second line confirms the dimuon candidates and requires their combined mass to be greater than 2.5 GeV/c2. The HLT2 algorithm selects events having two opposite charged muon candidates with an invariant mass greater than 2.9 GeV/c2. For a fraction of the data, corresponding to an integrated luminosity of 3.0 pb−1, the HLT1 single muon line was pre-scaled by a factor of five. The trigger efficiency is measured indepen-dently for the pre-scaled data set and for the rest of the sam-ple, and the results subsequently combined.
during the 2010 running period of the LHC, in which the average number of visible interactions per bunch crossing was equal to 1.8 for the data used for this analysis, a factor of five above the design value, at a time when only one fifth of the event-filter farm was installed. The GEC were chosen to reject busy events with a large number of pile-up interac-tions with minimal loss of luminosity. The average number of reconstructed primary vertices in selected and triggered events after GEC is equal to 2.1.
The Monte Carlo samples used for this analysis are based on the PYTHIA 6.4 generator [19] configured with the parameters detailed in [20]. The EvtGen package [21] was used to generate hadron decays, in particularJ/ψ and
b-hadrons, and the GEANT4 package [22] for the detec-tor simulation. The prompt charmonium production pro-cesses activated in PYTHIAare those from the leading-order colour-singlet and colour-octet mechanisms. Theb-hadron production in PYTHIAis based on leading order 2→2 QCD processes: qq →qq, qq→qq, qq →gg, qg→qg,
gg→qq andgg→gg. QED radiative corrections to the decay J/ψ →μ+μ− are generated using the PHOTOS package [23].
3 J/ψselection
The analysis selects events in which at least one primary vertex is reconstructed from at least five charged tracks seen in the VELO.J/ψ candidates are formed from pairs of op-posite sign tracks reconstructed in the full tracking system. Each track must have pT above 0.7 GeV/c, have a good quality of the track fit (χ2/ndf<4) and be identified as a muon by ensuring that it penetrates the iron of the MUON system. The two muons are required to originate from a common vertex, and only candidates with aχ2probability of the vertex fit larger than 0.5% are kept. Some charged particles can be reconstructed as more than one track. Du-plicate tracks, which share too many hits with another track or are too close to another track, are removed.
J/ψ from b tend to be produced away from the pri-mary vertex and can be separated from promptJ/ψ, which are produced at the primary vertex, by exploiting the J/ψ
pseudo-proper time defined as
tz=
(zJ/ψ−zPV)×MJ/ψ
pz
, (1)
wherezJ/ψ andzPVare the positions along thez-axis (de-fined along the beam axis, and oriented from the VELO to the MUON) of the J/ψ decay vertex and of the primary vertex;pz is the measured J/ψ momentum in thez
direc-tion andMJ/ψthe nominalJ/ψ mass. Given thatb-hadrons
are not fully reconstructed, theJ/ψ momentum is used in-stead of the exact b-hadron momentum and thetz variable
provides a good estimate of theb-hadron decay proper time. For events with several primary vertices (68% of the events), the one which is closest to theJ/ψ vertex in thezdirection is selected.
4 Cross-section determination
The differential cross-section forJ/ψ production in a given (pT,y) bin is defined as
d2σ
dydpT=
N (J/ψ→μ+μ−)
L×tot×B(J/ψ→μ+μ−)×y×pT
, (2)
whereN (J/ψ →μ+μ−)is the number of observedJ/ψ → μ+μ− in bin (pT,y), tot the J/ψ detection efficiency in-cluding acceptance and trigger efficiency in bin (pT, y), Lthe integrated luminosity,B(J/ψ →μ+μ−)the branch-ing fraction of theJ/ψ →μ+μ− decay ((5.93±0.06)×
10−2 [24]), and y=0.5 andpT=1 GeV/c the y and
pT bin sizes, respectively. The transverse momentum is
defined as pT=
p2
x+p2y and the rapidity is defined as
y=12lnE+pz
E−pz where(E,p)is theJ/ψ four-momentum in
the centre-of-mass frame of the colliding protons.
In each bin of pT and y, the fraction of signal J/ψ from all sources,fJ/ψ, is estimated from an extended
un-binned maximum likelihood fit to the invariant mass distri-bution of the reconstructed J/ψ candidates in the interval
Mμμ∈ [2.95;3.30]GeV/c2, where the signal is described
by a Crystal Ball function [25, 26] and the combinato-rial background by an exponential function. The fraction of
J/ψ frombis then extracted from a fit to thetzdistribution.
As an example, Fig.1(left) shows the mass distribution together with the fit results for one specific bin (3< pT< 4 GeV/c, 2.5< y <3.0); the fit gives a mass resolution of 12.3±0.1 MeV/c2 and a mean of 3 095.3±0.1 MeV/c2, where the errors are statistical only. The mass value is close to the knownJ/ψ mass value of 3 096.916±0.011 MeV/c2
[24], reflecting the current status of the mass-scale calibra-tion; the difference between the two values has no effect on the results obtained in this analysis. Summing over all bins, a total signal yield of 565 000 events is obtained.
4.1 Determination of the fraction ofJ/ψ fromb
The fraction of J/ψ from b, Fb, is determined from the fits to the pseudo-proper time tz and the μ+μ− invariant
mass in each bin ofpT andy. The signal proper-time dis-tribution is described by a delta function attz=0 for the
Fig. 1 Dimuon mass distribution (left) and tz distribution (right), with fit results superimposed, for one bin (3< pT <4 GeV/c,
2.5< y <3.0). On the mass distribution, the solid red line is the total fit function, where the signal is described by a Crystal Ball func-tion, and the dashed blue line represents the exponential background
function. On thetzdistribution, the solid red line is the total fit function described in the text, the green dashed line is the promptJ/ψ contri-bution, the single-hatched area is the background component and the
cross-hatched area is the tail contribution
1. Two or more primary vertices are close to each other and a primary vertex is reconstructed with tracks belonging to the different vertices, at a position that is different from the true primary vertex position.
2. The primary vertex from which theJ/ψ originates is not found because too few tracks originating from the ver-tex are reconstructed, as confirmed by the simulation; the
J/ψ candidate is then wrongly associated with another primary vertex found in the event.
In the first case, the positions of the reconstructed and of the true primary vertices are correlated. This category of events is distributed aroundtz=0 for the prompt component, with
a width larger than thetzdistribution for correctly associated
primary vertices. The contribution of these events to thetz
distribution is included in the resolution function described below.
The long tail is predominantly composed of events in the second category. Since the tail distribution affects the mea-surement of theJ/ψ frombcomponent, a method has been developed to extract its shape from data. The method con-sists of associating aJ/ψ from a given event with the pri-mary vertex of the next event in theJ/ψ sample. This sim-ulates the position of an uncorrelated primary vertex with which the J/ψ is associated. The shape of the tail contri-bution to the signaltzdistribution is then obtained from the
distribution of
tznext=(zJ/ψ−z
next
PV)×MJ/ψ
pz
, (3)
whereznextPV is the position along the z-axis of the primary vertex of the next event. The primary vertex reconstruc-tion efficiency is assumed to be equal for promptJ/ψ and
J/ψ fromb. Given the high primary vertex reconstruction efficiency, 99.4%, the uncertainty related to this assumption is neglected.
The function describing thetzdistribution of the signal is
therefore
fsignal(tz;fp, fb, τb)
=fpδ(tz)+fb
e− tz τb
τb +
(1−fb−fp)htail(tz), (4)
where fp is the fraction of prompt J/ψ for which the primary vertex is correctly associated, fb the fraction of
J/ψ frombfor which the primary vertex is correctly associ-ated,τbtheb-hadron pseudo-lifetime andhtail(tz)the
proba-bility density function taken as the histogram shape obtained from the “next event” method and displayed in Fig.1(right). The overall fraction ofJ/ψfrombis defined asFb=fpf+bfb. This assumes that the fraction of J/ψ from b in the tail events is equal to the fraction measured with the events for which the primary vertex is correctly reconstructed.
The prompt andbcomponents of the signal function are convolved with a double-Gaussian resolution function
fresolution(tz;μ, S1, S2, β)
=√ β
2π S1σ
e− (tz−μ)2
2S12σ2 +√1−β
2π S2σ
e− (tz−μ)2
2S22σ2 .
(5)
The widths of the Gaussians are equal to the event-by-event
tzmeasurement errorsσ, multiplied by overall scale factors
S1andS2to take into account possible mis-calibration ef-fects onσ. The parameterμ is the bias of thetz
scale factor. For bins with low statistics, a single-Gaussian resolution function is used.
The background consists of random combinations of muons from semi-leptonic b andc decays, which tend to produce positivetz values, as well as of mis-reconstructed
tracks from decays in flight of kaons and pions which con-tribute both to positive and negative tz values. The
back-ground distribution is parameterised with an empirical func-tion based on the shape of thetzdistribution seen in theJ/ψ
mass sidebands. It is taken as the sum of a delta function and five exponential components (three for positivetz and
two for negative tz, the negative and positive exponentials
with the largest lifetimes having their lifetimesτL fixed to the same value), convolved with the sum of two Gaussian functions of widthsσ1andσ2and fractionsβand(1−β)
fbackground(tz)=
(1−f1−f2−f3−f4) δ(tz)
+θ (tz)
f1
e− tz τ1
τ1 +
f2 e− tz τ2 τ2
+θ (−tz)f3
e tz τ3
τ3 +
f4
e−|tzτL|
2τL
⊗
β
√
2π σ1
e− tz2
2σ12 +√1−β
2π σ2
e− t2z
2σ22
,
(6)
whereθ (tz)is the step function. All parameters of the
back-ground function are determined independently in each bin ofpTandy, but for bins with low statistics the number of exponential components is reduced. The parameters are ob-tained from a fit to thetzdistribution of theJ/ψ mass
side-bands defined asMμμ∈ [2.95;3.00] ∪ [3.20;3.25]GeV/c2,
and are fixed for the final fit.
The function used to describe the tz distribution in the
final fit is therefore
f (tz;fp, fb, fJ/ψ, μ, S1, S2, β, τb)
=fJ/ψ
fpδ(tz)+fb
e− tz τb
τb
⊗fresolution(tz;μ, S1, S2, β)
+1−fb−fp
htail(tz)
+1−fJ/ψ
fbackground(tz). (7)
The total fit function is the sum of the products of the mass andtzfit functions for the signal and background. Four bins
ofpTandy, which contain less than 150 signalJ/ψ events as determined from the mass fit, are excluded from the anal-ysis.
As an example, Fig.1 (right) represents thetz
distribu-tion for one specific bin (3< pT<4 GeV/c, 2.5< y <3.0) with the fit result superimposed. The RMS of thetz
resolu-tion funcresolu-tion is 53 fs and the fracresolu-tion of tail events to the number ofJ/ψ signal is(0.40±0.01)%. As a measure of the fit quality, a χ2 is calculated for the fit function using a binned event distribution. The resulting fit probability for the histogram of Fig.1(right) is equal to 87% and similar good fits are seen for the other bins.
4.2 Luminosity
The luminosity was measured at specific periods during the data taking using both Van der Meer scans [27] and a beam-profile method [28]. Two Van der Meer scans were per-formed in a single fill. The analysis of these scans yields consistent results for the absolute luminosity scale with a precision of 10%, dominated by the uncertainty in the knowledge of the LHC proton beam currents. In the sec-ond approach, six separate periods of stable running were chosen, and the beam-profiles measured using beam-gas and beam-beam interactions. Using these results, correcting for crossing angle effects, and knowing the beam currents, the luminosity in each period is determined following the analy-sis procedure described in [29]. Consistent results are found for the absolute luminosity scale in each period, with a pre-cision of 10%, also dominated by the beam current uncer-tainty. These results are in good agreement with those of the Van der Meer analysis. The knowledge of the absolute lumi-nosity scale is used to calibrate the number of VELO tracks, which is found to be stable throughout the data-taking pe-riod and can therefore be used to monitor the instantaneous luminosity of the entire data sample. The integrated lumi-nosity of the runs considered in this analysis is determined to be 5.2±0.5 pb−1.
4.3 Efficiency calculation
A simulated sample of inclusive, unpolarisedJ/ψ mesons is used to estimate the total efficiencytot in each bin of
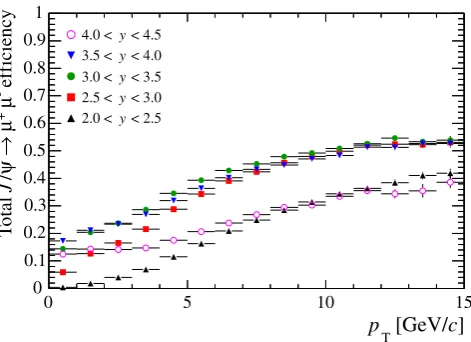
pT and y. The total efficiency is the product of the geo-metrical acceptance, the detection, reconstruction and selec-tion efficiencies, and the trigger efficiency. It is displayed in Fig.2, including both promptJ/ψ andJ/ψ fromb. The efficiencies are assumed to be equal for prompt J/ψ and
J/ψ frombin a given(pT, y)bin because neither the trig-ger nor the selection makes use of impact parameter or de-cay length information. This assumption is confirmed with studies based on simulation.
Fig. 2 TotalJ/ψ efficiency, as a function ofpTin bins ofy
assum-ing thatJ/ψare produced unpolarised. The efficiency is seen to drop somewhat at the edges of the acceptance
candidate is not well described by the Monte Carlo simula-tion; it is therefore evaluated from data by using an indepen-dent trigger, which accepts events having at least one track reconstructed in either the VELO or the tracking stations. By comparing the number of such triggered signalJ/ψ can-didates before and after GEC, an efficiency of(93±2)% is determined from data.
4.4 Effect of theJ/ψ polarisation on the efficiency
The efficiency is evaluated from a Monte Carlo simulation in which theJ/ψ is produced unpolarised. However, studies show that non-zeroJ/ψ polarisation may lead to very differ-ent total efficiencies. In this analysis, the efficiency variation is studied in the helicity frame [30,31].
The angular distribution of theμ+from theJ/ψ decay is
d2N
d cosθdφ ∝1+λθcos
2θ+λ
θ φsin 2θcosφ
+λφsin2θcos 2φ, (8)
whereθis defined as the angle between the direction of the
μ+momentum in theJ/ψ centre-of-mass frame and the di-rection of theJ/ψ momentum in the centre-of-mass frame of the colliding protons, andφis the azimuthal angle mea-sured with respect to the production plane formed by the mo-menta of the colliding protons in theJ/ψ rest frame. When
λφ=0 andλθ φ=0, the valuesλθ= +1,−1,0 correspond
to fully transverse, fully longitudinal, and no polarisation, respectively, which are the three default polarisation scenar-ios considered in this analysis.
The polarisation significantly affects the acceptance and reconstruction efficiencies. The relative efficiency change for promptJ/ψ varies between 3% and 30% depending on
pTandy, when comparing to the unpolarised case. There-fore, the measurement of the differential promptJ/ψ cross-section will be given for the three default polarisations and a separate uncertainty due to the polarisation will be assigned to the integrated cross-section.
Three other polarisation configurations were studied, cor-responding to(λθ, λφ, λθ φ)=(+1,0,−1),(0,1/
√
2,−1/2)
and(0,−1/√2,−1/2); these do not produce variations of the measured prompt cross-sections larger than those ob-tained with the default(±1,0,0)scenarios, except in some of the bins with 4< y <4.5 where the variations are up to 25% larger.
The Monte Carlo simulation includes polarisation ofJ/ψ
frombas measured at BABARforB0andB+decays [32]. The simulation shows that the polarisation that theJ/ψ ac-quires inb decays is largely diluted when using as helic-ity quantisation axis theJ/ψ momentum in the laboratory frame instead of theJ/ψ momentum in the b-hadron rest frame, which is the natural polarisation axis. The effect of the J/ψ from b polarisation on the J/ψ acceptance and reconstruction efficiencies is less than 0.5%; therefore, no systematic uncertainty is assigned to theJ/ψ fromb cross-section measurement from the unknownJ/ψ polarisation.
5 Systematic uncertainties
The different contributions to the systematic uncertainties affecting the cross-section measurement are discussed in the following and summarised in Table1.
Due to the finitepT andy resolutions, J/ψ candidates can be assigned to a wrongpT bin (inter-bin cross-feed in Table1). According to Monte Carlo simulations, the aver-agepTresolution is 12.7±0.2 MeV/cand theyresolution is(1.4±0.1)×10−3. The effect of they resolution is neg-ligible compared to the bin width ofy=0.5. The effect of thepTresolution is estimated by recomputing the efficiency tables after smearing thepTvalues with a Gaussian distri-bution ofσ=20 MeV/c. The maximum relative deviation observed is 0.5% and this is the value used as systematic uncertainty for the differential cross-section measurement. The effect on the total cross-section is much smaller and is ignored.
The influence of the choice of the fit function used to de-scribe the shape of the dimuon mass distribution is estimated by fitting theJ/ψ invariant mass distribution with the sum of two Crystal Ball functions. The relative difference of 1% in the number of signal events is taken as systematic uncer-tainty.
A fraction ofJ/ψ events have a lower mass because of the radiative tail. Based on Monte Carlo studies, 2% of the
Table 1 Summary of systematic uncertainties
Source Systematic uncertainty (%)
Correlated between bins
Inter-bin cross-feed 0.5
Mass fits 1.0
Radiative tail 1.0
Muon identification 1.1
Tracking efficiency 8.0
Trackχ2 1.0
Vertexing 0.8
GEC 2.0
B(J/ψ→μ+μ−) 1.0
Luminosity 10.0
Uncorrelated between bins
Bin size 0.1 to 15.0
Trigger 1.7 to 4.5
Applied only toJ/ψfrombcross-sections, correlated between bins
GEC efficiency onBevents 2.0
tzfits 3.6
Applied only to the extrapolation of thebbcross-section
bhadronisation fractions 2.0
B(b→J/ψ X) 9.0
fitted signal yields are therefore corrected by 2%, and an uncertainty of 1% is assigned to the cross-section measure-ments.
To cross-check and assign a systematic uncertainty to the Monte Carlo determination of the muon identification efficiency, the single track muon identification efficiency is measured on data using a tag-and-probe method. This method reconstructsJ/ψ candidates in which one muon is identified by the muon system (“tag”) and the other one (“probe”) is identified selecting a track depositing the en-ergy of minimum-ionising particles in the calorimeters. The absolute muon identification efficiency is then evaluated on the probe muon, as a function of the muon momentum. The ratio of the muon identification efficiency measured in data to that obtained in the Monte Carlo simulation is convolved with the momentum distribution of muons from
J/ψ to compute a correction factor to apply on simulation-based efficiencies. This factor is found to be 1.024±0.011 and is consistent with being constant over the full J/ψ
transverse momentum and rapidity range; the error on the correction factor is used as a systematic uncertainty. The residual misalignment between the tracking system and the muon detectors is accounted for in this systematic uncer-tainty.
Tracking studies have shown that the Monte Carlo simu-lation reproduces the track-finding efficiency in data within 4%. A systematic uncertainty of 4% for each muon is
there-fore assigned, resulting in a total systematic uncertainty of 8% due to the knowledge of the track reconstruction ef-ficiency [33]. The effects of the residual misalignment of the tracking system are included in this systematic uncer-tainty.
The selection includes a requirement on the track fit qual-ity, which may not be reliably simulated. A systematic un-certainty of 0.5% is assigned per track, which is the relative difference between the efficiency of this requirement in the simulation and data.
Similarly, for the cut on the J/ψ vertex χ2 probabil-ity, a difference of 1.6% is measured between the cut effi-ciency computed in data and simulation. The Monte Carlo efficiency is corrected for this difference and a systematic uncertainty of 0.8% (half of the correction) is assigned.
The unknown J/ψ transverse momentum and rapidity spectra inside the bins affect the efficiency values used to extract the cross-section, because an average value of the efficiency is computed in each bin. This effect is important close to the edges of the fiducial region. To take into account possible efficiency variations inside the bins, each bin is di-vided into four sub-bins (two bins inpTand two bins iny) and the relative deviation between the bin efficiency and the average of the efficiencies in the sub-bins is taken as a sys-tematic uncertainty.
The trigger efficiency can be determined using a trigger-unbiased sample of events that would still be triggered if the
J/ψ candidate were removed. The efficiency obtained with this method in each (pT, y) bin is used to check the effi-ciencies measured in the simulation. The systematic uncer-tainty associated with the trigger efficiency is the difference between the trigger efficiency measured in the data and in the simulation. The largest uncertainties are obtained for the high rapidity bins.
The statistical error on the GEC efficiency (2%) is taken as an additional systematic uncertainty associated with the trigger. This efficiency is extracted from data as explained in Sect.4.3; it is essentially the efficiency of the GEC on promptJ/ψ. In the simulation, a 2% difference is seen be-tween the promptJ/ψ and theJ/ψ frombefficiency, which is used as an additional systematic uncertainty, applied only to theJ/ψ frombcross-section measurement.
Uncertainties related to thetzfit procedure are taken into
account by varying the central value of the prompt J/ψ
component, μ, which is found to be different from zero. This shift could be due to an improper description of the background for events close totz=0. The impact of such a
shift is studied by fixingμat two extreme values,μ= −3 fs andμ=3 fs and repeating thetz fit. The relative variation
of the number ofJ/ψ fromb, 3.6%, is used as a systematic uncertainty.
The extrapolation to the full polar angle to obtain the
inclusive b-hadron decays to J/ψ measured at LEP, i.e.,
B(b→J/ψ X)=(1.16±0.10)% [34–36]. The underlying
assumption is that the b-hadron fractions inpp collisions at√s=7 TeV are identical to those seen in Z→bb de-cays. However, theb hadronisation fractions may differ at hadronic machines. To estimate the systematic uncertainty due to possibly different fractions, the B(b→J/ψ X) is computed by taking as input for the calculation the frac-tions measured at the Tevatron [37,38] and assuming the partial widths ofBu,Bd,Bs andbtoJ/ψ Xto be equal.
The relative difference between the estimates of the branch-ing fractions based on the fragmentation functions measured at LEP and at the Tevatron, 2%, is taken as systematic
uncer-tainty, which only affects the extrapolation of thebb cross-section.
6 Results
The measured double-differential cross-sections for prompt
J/ψ andJ/ψ fromb in the various (pT, y) bins, after all corrections and assuming no polarisation, are given in Ta-bles2and3, and displayed in Figs.3and4. The results for full transverse and full longitudinal polarisation of theJ/ψ
[image:11.595.54.546.261.471.2]in the helicity frame are given in Tables4 and5, and dis-played in Fig.5.
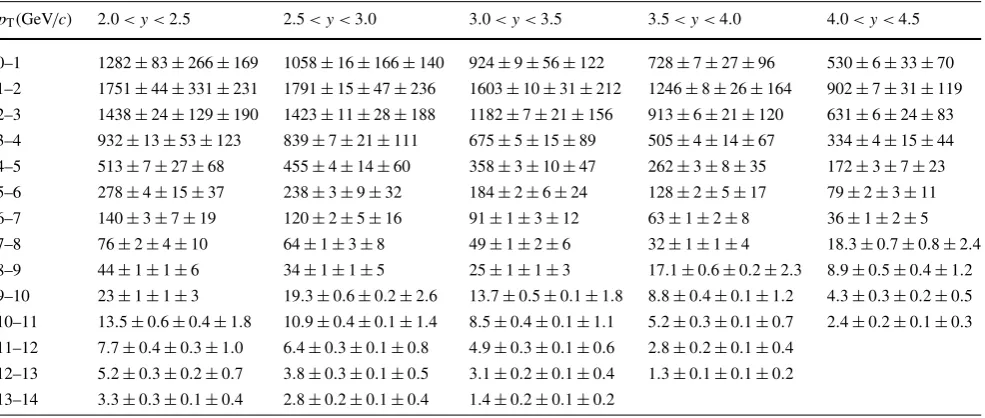
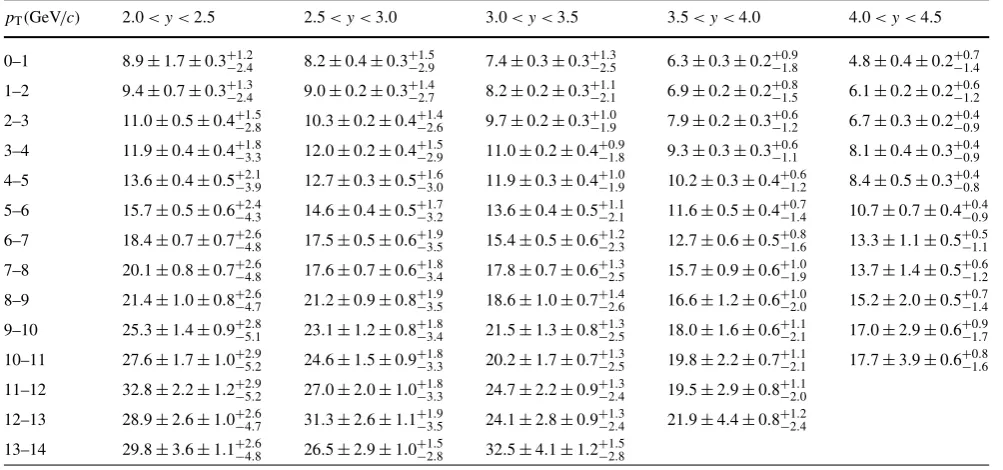
Table 2 ddp2σ
Tdyin nb/(GeV/c) for promptJ/ψin bins of theJ/ψtransverse momentum and rapidity, assuming no polarisation. The first error is
statistical, the second is the component of the systematic uncertainty that is uncorrelated between bins and the third is the correlated component
pT(GeV/c) 2.0< y <2.5 2.5< y <3.0 3.0< y <3.5 3.5< y <4.0 4.0< y <4.5
0–1 1091±70±226±144 844±13±133±111 749±7±46±99 614±6±23±81 447±5±28±59 1–2 1495±38±282±197 1490±12±39±197 1376±8±26±182 1101±7±23±145 807±7±28±107 2–3 1225±20±109±162 1214±9±24±160 1053±7±19±139 839±6±19±111 588±6±22±78 3–4 777±11±44±103 719±6±18±95 611±5±14±81 471±4±13±62 315±4±14±42 4–5 424±6±22±56 392±3±12±52 325±3±9±43 244±3±7±32 163±3±6±22 5–6 230±4±12±30 206±2±8±27 167±2±5±22 119±2±5±16 76±2±3±10 6–7 116±2±6±15 104±1±4±14 82±1±3±11 59±1±2±8 34±1.1±1.4±4.5 7–8 64±1±3±8 57±1±3±7 44±1±1±6 29±1±1±4 17±0.7±0.8±2.3 8–9 37±1±1±5 31±1±1±4 23±1±1±3 15.9±0.5±0.1±2.1 8.5±0.5±0.4±1.1 9–10 19.3±0.7±0.5±2.6 17.4±0.5±0.2±2.3 12.6±0.4±0.1±1.7 8.2±0.4±0.1±1.1 4.1±0.3±0.2±0.5 10–11 11.6±0.5±0.3±1.5 9.8±0.4±0.1±1.3 7.8±0.3±0.1±1.0 4.9±0.3±0.1±0.6 2.2±0.2±0.1±0.3 11–12 6.7±0.4±0.2±0.9 5.9±0.3±0.1±0.8 4.5±0.3±0.1±0.6 2.6±0.2±0.1±0.3
12–13 4.6±0.3±0.2±0.6 3.5±0.2±0.1±0.5 2.9±0.2±0.1±0.4 1.2±0.1±0.1±0.2 13–14 2.9±0.3±0.1±0.4 2.6±0.2±0.1±0.3 1.3±0.2±0.1±0.2
Table 3 dpd2σ
Tdy in nb/(GeV/c) forJ/ψfrombin bins of theJ/ψtransverse momentum and rapidity. The first error is statistical, the second is the
component of the systematic uncertainty that is uncorrelated between bins and the third is the correlated component
pT(GeV/c) 2.0< y <2.5 2.5< y <3.0 3.0< y <3.5 3.5< y <4.0 4.0< y <4.5
0–1 107±23±22±15 75±4±12±10 60±2±4±8 41±2±2±6 22±2±1±3 1–2 156±11±30±22 147±4±4±20 123±3±2±17 82±2±2±11 52±2±2±7 2–3 151±6±14±21 140±3±3±19 113±2±2±16 71±2±2±10 42±2±2±6 3–4 105±4±6±15 98±2±2±14 75±2±2±10 48±1±1±7 28±1±1±4 4–5 67±2±3±9 57±1±2±8 44±1±1±6 28±1±1±4 15.0±1.0±0.6±2.1 5–6 43±2±2±6 35±1±1±5 26±1±1±4 15.6±0.7±0.7±2.2 9.0±0.7±0.3±1.3 6–7 26±1±1±4 22±1±1±3 14.9±0.6±0.5±2.1 8.6±0.4±0.3±1.2 5.2±0.5±0.2±0.7 7–8 16.1±0.7±0.8±2.2 12.1±0.5±0.6±1.7 9.4±0.4±0.3±1.3 5.5±0.3±0.2±0.8 2.8±0.3±0.1±0.4 8–9 10.1±0.6±0.3±1.4 8.2±0.4±0.8±1.1 5.3±0.3±0.1±0.7 3.2±0.3±0.1±0.4 1.5±0.2±0.1±0.2 9–10 6.5±0.4±0.2±0.9 5.2±0.3±0.1±0.7 3.4±0.2±0.1±0.5 1.8±0.2±0.1±0.2 0.8±0.2±0.1±0.1 10–11 4.4±0.3±0.1±0.6 3.2±0.2±0.1±0.4 2.0±0.2±0.1±0.3 1.2±0.2±0.1±0.2 0.5±0.1±0.1±0.1 11–12 3.3±0.3±0.1±0.4 2.2±0.2±0.1±0.3 1.5±0.2±0.1±0.2 0.6±0.1±0.1±0.1
[image:11.595.51.545.506.714.2]Fig. 3 Differential production
cross-section for promptJ/ψas a function ofpTin bins ofy,
assuming that promptJ/ψare produced unpolarised. The errors are the quadratic sums of the statistical and systematic uncertainties
Fig. 4 Differential production
cross-section forJ/ψfrombas a function ofpTin bins ofy.
The errors are the quadratic sums of the statistical and systematic uncertainties
The integrated cross-section for promptJ/ψ production in the defined fiducial region, summing over all bins of the analysis, is
σ (promptJ/ψ , pT<14 GeV/c,2.0< y <4.5)
=10.52±0.04±1.40+−12..6420µb, (9)
where the first uncertainty is statistical and the second sys-tematic. The result is quoted assuming unpolarisedJ/ψ and the last error indicates the uncertainty related to this as-sumption. The integrated cross-section for the production of
J/ψ frombin the same fiducial region is
σ (J/ψ fromb, pT<14 GeV/c,2.0< y <4.5)
=1.14±0.01±0.16 µb, (10)
where the first uncertainty is statistical and the second sys-tematic.
Table 4 d2σ
dpTdy in nb/(GeV/c) for promptJ/ψ in bins of the J/ψ
transverse momentum and rapidity, assuming fully transversely po-larisedJ/ψ. The first error is statistical, the second is the component
of the systematic uncertainty that is uncorrelated between bins and the third is the correlated component
pT(GeV/c) 2.0< y <2.5 2.5< y <3.0 3.0< y <3.5 3.5< y <4.0 4.0< y <4.5
0–1 1282±83±266±169 1058±16±166±140 924±9±56±122 728±7±27±96 530±6±33±70 1–2 1751±44±331±231 1791±15±47±236 1603±10±31±212 1246±8±26±164 902±7±31±119 2–3 1438±24±129±190 1423±11±28±188 1182±7±21±156 913±6±21±120 631±6±24±83 3–4 932±13±53±123 839±7±21±111 675±5±15±89 505±4±14±67 334±4±15±44 4–5 513±7±27±68 455±4±14±60 358±3±10±47 262±3±8±35 172±3±7±23 5–6 278±4±15±37 238±3±9±32 184±2±6±24 128±2±5±17 79±2±3±11 6–7 140±3±7±19 120±2±5±16 91±1±3±12 63±1±2±8 36±1±2±5 7–8 76±2±4±10 64±1±3±8 49±1±2±6 32±1±1±4 18.3±0.7±0.8±2.4 8–9 44±1±1±6 34±1±1±5 25±1±1±3 17.1±0.6±0.2±2.3 8.9±0.5±0.4±1.2 9–10 23±1±1±3 19.3±0.6±0.2±2.6 13.7±0.5±0.1±1.8 8.8±0.4±0.1±1.2 4.3±0.3±0.2±0.5 10–11 13.5±0.6±0.4±1.8 10.9±0.4±0.1±1.4 8.5±0.4±0.1±1.1 5.2±0.3±0.1±0.7 2.4±0.2±0.1±0.3 11–12 7.7±0.4±0.3±1.0 6.4±0.3±0.1±0.8 4.9±0.3±0.1±0.6 2.8±0.2±0.1±0.4
[image:13.595.50.547.369.580.2]12–13 5.2±0.3±0.2±0.7 3.8±0.3±0.1±0.5 3.1±0.2±0.1±0.4 1.3±0.1±0.1±0.2 13–14 3.3±0.3±0.1±0.4 2.8±0.2±0.1±0.4 1.4±0.2±0.1±0.2
Table 5 dpd2σ
Tdy in nb/(GeV/c) for promptJ/ψ in bins of the J/ψ
transverse momentum and rapidity, assuming fully longitudinally po-larisedJ/ψ. The first error is statistical, the second is the component
of the systematic uncertainty that is uncorrelated between bins and the third is the correlated component
pT(GeV/c) 2.0< y <2.5 2.5< y <3.0 3.0< y <3.5 3.5< y <4.0 4.0< y <4.5
0–1 839±54±174±111 601±9±94±79 543±5±33±72 468±4±21±62 341±4±21±45 1–2 1157±29±219±153 1114±9±29±147 1073±7±21±142 892±5±18±118 667±6±23±88 2–3 945±16±84±125 938±7±19±124 865±5±16±114 721±5±16±95 517±5±20±68 3–4 583±8±33±77 559±4±14±74 514±4±11±68 415±3±12±55 282±4±13±37 4–5 315±4±16±42 307±3±9±41 274±2±8±36 215±2±7±28 148±2±6±20 5–6 171±3±9±23 163±2±6±22 140±2±4±19 104±1±4±14 69±2±3±9
6–7 87±2±5±12 83±1±3±11 70±1±3±9 51±1±2±7 31±1±1±4
7–8 48±1±2±6 46±1±2±6 38±1±1±5 26±1±1±3 15.8±0.6±0.7±2.1 8–9 29±1±1±4 25±1±1±3 19.8±0.5±0.1±2.6 13.9±0.5±0.1±1.8 7.6±0.4±0.3±1.0 9–10 14.9±0.5±0.4±2.0 14.5±0.4±0.2±1.9 10.8±0.4±0.1±1.4 7.1±0.3±0.1±0.9 3.6±0.3±0.2±0.5 10–11 9.1±0.4±0.3±1.2 8.3±0.3±0.1±1.1 6.7±0.3±0.1±0.9 10–11 4.3±0.2±0.1±0.6 2.0±0.2±0.1±0.3 11–12 5.3±0.3±0.2±0.7 5.0±0.3±0.1±0.7 4.0±0.2±0.1±0.5 2.3±0.2±0.1±0.3
12–13 3.7±0.2±0.1±0.5 3.0±0.2±0.1±0.4 2.5±0.2±0.1±0.4 1.0±0.1±0.1±0.1 13–14 2.3±0.2±0.1±0.3 2.3±0.2±0.1±0.3 1.2±0.1±0.1±0.2
20% larger than those of promptJ/ψ mesons. For eachJ/ψ
source, the meanpTand RMS are observed to decrease with increasingy.
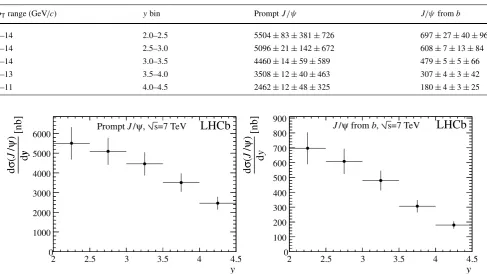
Table 7 and Fig. 6 show the differential cross-sections dσ
dy integrated over pT, both for unpolarised prompt J/ψ
andJ/ψ fromb. For the two production sources, the cross-sections decrease significantly between the central and for-ward regions of the LHCb acceptance.
6.1 Fraction ofJ/ψ fromb
Table 8 and Fig. 7 give the values of the fraction of
J/ψ fromb in the different bins assuming that the prompt
In Fig.7, only the statistical and systematic uncertainties are displayed, added quadratically, but not the uncertainties associated with the prompt J/ψ polarisation. The fraction of J/ψ from b increases as a function of pT. For a con-stantpT, the fraction ofJ/ψ frombdecreases with increas-ingy, indicating thatb-hadrons are produced more centrally than promptJ/ψ.
Fig. 5 Differential production cross-section for promptJ/ψas a func-tion ofpTin bins ofy, assuming full transverse (top) or full
longitudi-nal (bottom)J/ψpolarisation. The errors are the quadratic sums of the statistical and systematic uncertainties
6.2 Cross-section extrapolation
Using the LHCb Monte Carlo simulation based on PYTHIA 6.4 [19] and EvtGen [21], the result quoted in (10) is extrap-olated to the full polar angle range
σ (pp→bbX)
=α4π
σ (J/ψ fromb, pT<14 GeV/c,2.0< y <4.5)
2B(b→J/ψ X) ,
(11)
where α4π =5.88 is the ratio of J/ψ from b events
in the full range to the number of events in the region 2.0< y <4.5 andB(b→J/ψ X)=(1.16±0.10)% is the average branching fraction of inclusiveb-hadron decays to
J/ψ measured at LEP [34–36]. The result is
σ (pp→bbX)=288±4±48 µb, (12)
where the first uncertainty is statistical and the second sys-tematic. The systematic uncertainty includes the uncertain-ties on thebfractions (2%) and onB(b→J/ψ X). No ad-ditional uncertainty has been included for the extrapolation factorα4π estimated from the simulation. The above result
is in excellent agreement withσ (pp→bbX)=284±20± 49 µb obtained frombdecays intoD0μνX[33]. The extrap-olation factorα4πhas also been estimated using predictions
made in the framework of fixed-order next-to-leading log (FONLL) computations [39,40], and found to be equal to
α4FONLLπ =5.21.
7 Comparison with theoretical models
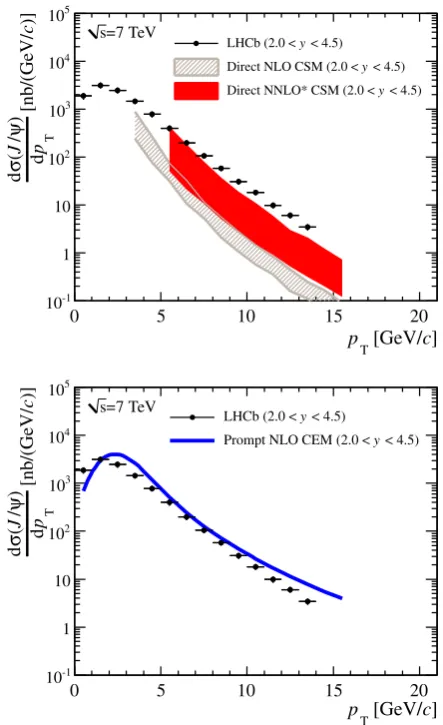
Figure8compares the LHCb measurement of the differen-tial promptJ/ψ production with several recent theory pre-dictions in the LHCb acceptance region:
– top, left: direct J/ψ production as calculated from NRQCD at leading-order inαs (LO, filled orange
[image:14.595.53.289.163.502.2]uncer-tainty band) [41] and next-to-leading order (NLO), with
Table 6 MeanpTand RMS for promptJ/ψ(assumed unpolarised) andJ/ψfromb. The first uncertainty is statistical, the second systematic and
the third for promptJ/ψthe uncertainty due to the unknown polarisation
pTrange PromptJ /ψ J/ψfromb
(GeV/c) ybin pT(GeV/c) RMSpT(GeV/c) pT(GeV/c) RMSpT(GeV/c)
0–14 2.0–2.5 2.51±0.03±0.10+−00..0201 1.80±0.01±0.04+−00..0002 3.06±0.09±0.11 2.22±0.02±0.04
0–14 2.5–3.0 2.53±0.01±0.06+−00..0604 1.74±0.01±0.01+−00..0202 3.04±0.02±0.05 2.12±0.01±0.01
0–14 3.0–3.5 2.46±0.01±0.02+−00..0705 1.68±0.01±0.01+−00..0201 2.93±0.02±0.02 2.03±0.01±0.01
0–13 3.5–4.0 2.38±0.01±0.02+−00..0705 1.61±0.01±0.01+−00..0101 2.82±0.02±0.02 1.92±0.02±0.01
[image:14.595.51.544.600.713.2]Table 7 ddσy in nb for promptJ/ψ(assumed unpolarised) andJ/ψfromb, integrated overpT. The first uncertainty is statistical, the second is the
component of the systematic uncertainty that is uncorrelated between bins and the third is the correlated component
pTrange (GeV/c) ybin PromptJ /ψ J/ψfromb
0–14 2.0–2.5 5504±83±381±726 697±27±40±96
0–14 2.5–3.0 5096±21±142±672 608±7±13±84
0–14 3.0–3.5 4460±14±59±589 479±5±5±66
0–13 3.5–4.0 3508±12±40±463 307±4±3±42
0–11 4.0–4.5 2462±12±48±325 180±4±3±25
Fig. 6 Differential production cross-section as a function ofyintegrated overpT, for unpolarised promptJ/ψ(left) andJ/ψfromb(right). The
[image:15.595.51.289.403.573.2]errors are the quadratic sums of the statistical and systematic uncertainties
Fig. 7 Fraction ofJ/ψfrombas a function ofpT, in bins ofy
colour-octet long distance matrix elements determined from HERA and Tevatron data (hatched green uncertainty band) [42], summing the colour-singlet and colour-octet contributions;
– top, right: direct production as calculated from a NNLO
colour-singlet model (CSM, filled red uncertainty band) [16,43]. The notation NNLOdenotes an evaluation that is not a complete next-to-next leading order
computa-tion and that can be affected by logarithmic correccomputa-tions, which are however not easily quantifiable. Direct produc-tion as calculated from NLO CSM (hatched grey uncer-tainty band) [12,14] is also represented;
– bottom, left: promptJ/ψ production as calculated from NRQCD at NLO, including contributions from χc and
ψ (2S) decays, summing the singlet and colour-octet contributions [44];
– bottom, right: promptJ/ψ production as calculated from a NLO colour-evaporation model (CEM), including con-tributions fromχcandψ (2S)decays [45].
It should be noted that some of the theoretical models com-pute the directJ/ψ production, whereas the prompt J/ψ
measurement includesJ/ψ fromχcdecays and, to a smaller
extent,ψ (2S)decays. However, if one takes into account the feed-down contribution, which has been estimated to be of the order of 30% averaging over several experimental mea-surements at lower energies [46], a satisfactory agreement is found with the theoretical predictions.
de-Fig. 8 Comparison of the LHCb results for the differential prompt
J/ψ production for unpolarised J/ψ (circles with error bars) with: (top, left) direct J/ψ production as predicted by LO and NLO NRQCD; (top, right) directJ/ψproduction as predicted by NLO and
[image:16.595.304.526.51.414.2]NNLOCSM; (bottom, left) promptJ/ψ production as predicted by NLO NRQCD; (bottom, right) promptJ/ψproduction as predicted by NLO CEM. A more detailed description of the models and their refer-ences is given in the text
Fig. 9 Comparison of the
LHCb results for the differential
J/ψfrombproduction for unpolarisedJ/ψ(circles with
error bars) withJ/ψfromb
production as predicted by FONLL (hatched orange
uncertainty band). A more
[image:16.595.225.500.488.680.2]