University of Warwick institutional repository: http://go.warwick.ac.uk/wrap
This paper is made available online in accordance with
publisher policies. Please scroll down to view the document
itself. Please refer to the repository record for this item and our
policy information available from the repository home page for
further information.
To see the final version of this paper please visit the publisher’s website.
Access to the published version may require a subscription.
Author(s): P.K. Biswas, M.R. Lees, A.D. Hillier, R.I. Smith,
W.G. Marshall and D.McK. Paul
Article Title:
Structure and superconductivity of two different phases of
Re_{3}W
Year of publication: 2011
Link to published article:
http://dx.doi.org/10.1103/PhysRevB.84.184529
Publisher statement: Biswas, P. K., et al. (2011). Structure and
superconductivity of two different phases of Re_{3}W. Physical Review
B (Condensed Matter and Materials Physics), 84(18), article 184529.
.
Structure and superconductivity of two different phases of Re
3W
P.K. Biswas,1,∗ M.R. Lees,1 A.D. Hillier,2 R.I. Smith,2 W.G. Marshall,2 and D.McK. Paul1 1
Physics Department, University of Warwick, Coventry, CV4 7AL, United Kingdom 2
ISIS Facility, Science and Technology Facilities Council, Rutherford Appleton Laboratory, Chilton, Oxfordshire, OX11 0QX, U.K.
(Dated: November 8, 2011)
Two superconducting phases of Re3W have been found with different physical properties. One
phase crystallizes in a non-centrosymmetric cubic (α-Mn) structure and has a superconducting
transition temperature,Tc, of 7.8 K. The other phase has a hexagonal centrosymmetric structure and
is superconducting with aTcof 9.4 K. Switching between the two phases is possible by annealing the
sample or remelting it. The properties of both phases of Re3W have been characterized by powder
neutron diffraction, magnetization, and resistivity measurements. The temperature dependence of the lower and the upper critical fields have been measured for both phases. These are used to determine the penetration depths and the coherence lengths for these systems.
PACS numbers: 74.25.Ha, 74.25.fc, 74.25.Op, 74.70.Ad
I. INTRODUCTION
The discovery of superconductivity in the non-centrosymmetric (NCS) heavy fermion CePt3Si1has
re-sulted in a period of intense theoretical and experimental investigation into the physics of non-centrosymmetric su-perconducting materials. The lack of inversion symme-try in the crystal structure of this type of material along with strong spin-orbit (SO) coupling can lead to a mixing of spin-singlet and spin-triplet pair states2. These NCS
materials exhibit unusual magnetic properties including suppressed paramagnetic limiting or high upper critical fields3,4 as seen in CePt
3Si,1 CeRhSi3,5 and CeIrSi36,
the appearance of superconductivity with antiferromag-net order in CePt3Si,7, and superconductivity at the
bor-der of ferromagnetism in UIr8.
One recent focus of the work on non-centrosymmetric superconductors has been to investigate the properties of transition-metal compounds that have a significant spin-orbit coupling. Here, the complications of thef-electron heavy fermions, such as the strong electron correlations and the possibility of magnetically mediated supercon-ductivity, are expected to be absent. The intermetallic Re3W belongs in this category as it contains heavy atoms
with atomic numbers 75 and 74 for Re and W respec-tively. Superconductivity in Re3W was first reported in
the 1960’s. The material was shown to have anα-Mn or A12 structure9,10, although it is worth noting that the
au-thors of this early work did not comment on the fact that theα-Mn structure is non-centrosymmetric. Since then, very little experimental work has been done on Re3W.
Recent penetration depth measurements carried out on the NCS phase of Re3W by RF tunnel diode resonator
and point-contact spectroscopy suggested that Re3W is
a weakly coupled isotropic s-wave superconductor11–13.
In this paper, we report on the synthesis of two dif-ferent superconducting phases of Re3W. One phase has
a centrosymmetric (CS) crystal structure, whereas the other has a non-centrosymmetric structure. Switching from the CS to the NCS phase is achieved by
anneal-ing the sample, while remeltanneal-ing the NCS sample in an arc furnace returns the sample to the CS structure. The ease with which one can switch between the two phases of Re3W has allowed us to investigate and compare the
properties of a CS and a NCS superconducting system using a single material without changes in stoichiometry. We characterize the properties of both phases of Re3W
using neutron diffraction, magnetization, M, and resis-tivity, ρ, measurements. We present the temperature dependence of the lower critical field,Hc1, and the upper critical field, Hc2, of both materials and also calculate the penetration depths and coherence lengths for these systems.
II. SAMPLE PREPARATION
Samples of the centrosymmetric phase of Re3W were
prepared by melting together a stoichiometric mixture of Re lumps (99.99%) and W pieces (99.999%) in an arc furnace on a water-cooled copper hearth using tung-sten electrodes in a high-purity Ar atmosphere. After the initial melt, the buttons were turned and remelted several times to ensure homogenity. Samples of the non-centrosymmetric phase were made by annealing the as-grown samples for 5 days at 1500◦C in a high-purity Ar
atmosphere. The unannealed samples of Re3W are hard
but malleable. The samples become brittle after anneal-ing.
III. RESULTS AND DISCUSSION
A. Powder neutron diffraction studies
Time-of-flight powder neutron diffraction data were collected on the GEM diffractometer at the ISIS Facil-ity, Rutherford Appleton Laboratory, UK14. The data
2
0 2 4
0.50 0.75 1.00 1.25 1.50 1.75
0 1
Cubic structure Re
3
W (annealed) (a)
a b c
I
n
t
e
n
s
i
t
y
(
a
r
b
i
t
r
a
r
y
u
n
i
t
s
)
Hexagonal structure Re
3
W (unannealed)
d (Å) (b)
a b
c
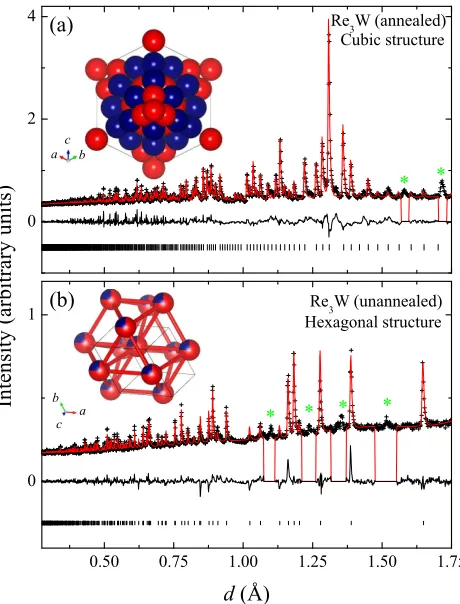
FIG. 1: (Color online) Neutron diffraction patterns as a
func-tion ofd-spacing collected at 295 K for the annealed and
unan-nealed samples of Re3W. The experimental data (crosses)
are shown along with the calculated pattern obtained from a Rietveld refinement of the structure and a difference curve. The ticks indicate positions of the nuclear Bragg peaks. The green asterisks mark the positions of impurity peaks. The Ri-etveld refinement shows that the annealed sample has a non-centrosymmetric cubic structure while the unannealed sample has a centrosymmetric hexagonal structure. Insets show the crystal structures of the two phases, with the Re atoms shown in red (light gray) and the W atoms shown in blue (dark gray).
angle coverage, with the diffraction patterns collected in the highest resolution backscattering detector bank (av-erage 2θ= 154◦) used for structure refinement. Crystal
structures were refined by the Rietveld method using the EXPGUI graphical interface for the GSAS package15,16.
Fig. 1 shows the diffraction patterns collected at 295 K from the annealed and unannealed samples of Re3W. The
Rietveld refinement shows that the annealed sample has a NCS cubic (α-Mn) structure with the NCS space group
I¯43m and cubic unit cell edge a = 9.5987(7) ˚A (see Fig. 1(a)). The diffraction pattern of the unannealed sample shows that this sample has a hexagonal structure with the CS space group P63/mmcand lattice parame-tersa= 2.770(3) ˚A andc= 4.5207(6) ˚A (see Fig. 1(b)). The diffraction patterns of both phases of Re3W
con-tain some peaks (denoted by asterisks) that cannot be indexed, and these regions were excluded during the
fi-TABLE I: Lattice parameters of the non-centrosymmetric and
centrosymmetric phases of Re3W determined from a
struc-tural refinement using the GSAS package of powder neutron diffraction data collected at 295 K.
NCS Re3W CS Re3W
Structure Cubic Hexagonal
Space group I¯43m P63/mmc
a (˚A) 9.5987(7) 2.770(3)
c (˚A) 4.5207(6)
Vcell (˚A3) 884.37(2) 30.04(5)
Rp 0.049 0.077
wRp 0.0697 0.1
TABLE II: Atomic position parameters of the
non-centrosymmetric and non-centrosymmetric phases of Re3W
deter-mined from a structural refinement using the GSAS package of powder neutron diffraction data collected at 295 K
NCS Re3W
Atom site x y z Occ. Uiso(˚A2)
Re 2a 0 0 0 0.99(4) 0.070(5)
W 8c 0.3192(3) 0.3192(3) 0.3192(3) 1.00 0.0068(7)
W 24g 0.3605(1) 0.3605(1) 0.0455(1) 0.21(2) 0.0090(3)
Re 24g 0.3605(1) 0.3605(1) 0.0455(1) 0.78(1) 0.0090(3)
Re 24g 0.0910(1) 0.0910(1) 0.2825(1) 1.00 0.0089(2)
CS Re3W
Atom x y z Occ. Uiso(˚A2)
Re 2c 0.3333 0.6667 0.25 0.75 0.0025(1)
W 2c 0.3333 0.6667 0.25 0.25 0.0025(1)
nal stages of structure refinement. Insets of 1(a) and (b) show the crystal structures of the NCS and the CS phases of Re3W. For the CS phase of Re3W, both the Re
and the W atoms share the same site leading to a ran-dom distribution of Re and W within the material. For the NCS phase, the refinement indicates that Re and the W atoms occupy preferred crystallographic sites and are therefore distributed in a more orderly fashion within the material. The refined composition of the NCS phase is Re3.45W indicating there is still some uncertainty in the
site occupation. Crystallographic parameters of the two phases of Re3W are shown in Tables I and II.
B. Magnetization and resistivity measurements
[image:3.595.62.292.53.355.2] [image:3.595.318.567.328.477.2]2 4 6 8 10 12 -1.0
-0.8 -0.6 -0.4 -0.2 0.0
ZFC FC
T
c
= 7.8 K
T
c
= 9.4 K
d
c
Temperature (K) NCS Re
3
W
CS Re
3
W = 20 Oe
FIG. 2: (Color online) Temperature dependence of the mag-netic susceptibility for the non-centrosymmetric and the
cen-trosymmetric Re3W measured in zero-cooled and
field-cooled mode in an applied magnetic field of 20 Oe.
Quantum Design Magnetic Property Measurement Sys-tem (MPMS) magnetometer. The Sys-temperature depen-dence of the dc magnetic susceptibility, χdc(T), shows that the NCS Re3W sample has a superconducting
tran-sition temperature, Tonset
c , of 7.8 K [see Fig. 2] with
a transition width ∆Tc = 0.21 K. For CS Re3W, the
onset of the transition is around 9.4 K with a much broader transition of ∆Tc= 0.50 K. Comparable transi-tion widths are observed in the resistivity measurements (see below). This suggests, as expected, that the an-nealed NCS phase of Re3W is more ordered than the
unannealed CS phase. At 2 K, the zero-field-cooled (ZFC) dc susceptibility approaches a value of -1 (∼100% shielding effect) for both the samples, while the field-cooled (FC) signal shows a flux exclusion (Meissner ef-fect) of ∼5% for the NCS phase and ∼7% for the CS phase.
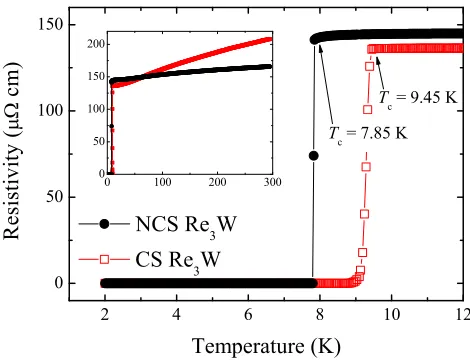
The ac electrical resistivity was measured as a function of temperature,ρ(T), for both phases of Re3W via a
stan-dard four-probe method using a Quantum Design Phys-ical Property Measurement System (PPMS) [see Fig. 3]. The NCS Re3W shows a superconducting transition
(on-set) at 7.85 K (∆Tc = 0.05 K) while the CS Re3W has
a transition at 9.45 K (∆Tc = 0.32 K). The zero-field onset transition temperatures determined from the resis-tivity measurements are slightly higher than those ob-tained from the magnetization measurements performed in 20 Oe. The resistivity curves between 2 to 295 K show metallic behavior for the CS phase of Re3W, whereas it
is almost temperature independent aboveTc in the NCS phase of Re3W [see the inset of Fig. 3]. The relative
resistance ratio, ρ(295 K)/ρ(10 K) and the room tem-perature resistivity are 1.15(1) and 1.7µΩm for the NCS phase and 1.52(1) and 2.1µΩm for the CS phase indicat-ing that both samples are poor metals. The NCS phase
2 4 6 8 10 12
0 50 100 150
0 100 200 300 0
50 100 150 200
T
c
= 7.85 K
NCS Re
3 W
CS Re
3 W
R
e
s
i
s
t
i
v
i
t
y
(
c
m
)
Temperature (K) T
c
= 9.45 K
FIG. 3: (Color online) Low-temperature ac electrical
resistiv-ity of the NCS and the CS phases of Re3W. The inset shows
the electrical resistivity of both phases up to room tempera-ture.
is the more brittle of the two materials and any extrin-sic factors such as microscopic cracks in the sample are more likely to play a role in this material. Given that the room temperature resistivity of the NCS sample is lower than the CS phase we suggest that cracks are not the reason for the high normal-state resistivity. The poor conductivity is more likely to result from a combination of strong electronic scattering and a large temperature independent residual resistivity due to structural disor-der (while the NCS annealed phase is structurally more ordered than the CS phase, the NCS phase still retains a degree of Re/W disorder). We have calculated the mean free path, ltr, based on the BCS approach17 using the
room temperature resistivity data. The calculations yield
lN CS
tr = 0.277 nm andlCStr = 0.224 nm. These values are
comparable with size of the crystallographic unit cells and given the coherence lengths,ξ, derived below, indi-cate that both phases of Re3W are in the dirty limit.
Figs. 4(a) and (b) show the low-field virgin magne-tization data for the NCS and CS phases of Re3W at
1.8 K and figures 5(a) and (b) show the full magnetiza-tion versus applied magnetic field loops collected in the superconducting state at 1.8 K. For the NCS sample the rawM(H) data contain a significant paramagnetic con-tribution. This contribution has been removed from the data shown in Fig. 5(a) by measuring an M(H) curve above Tc at 10 K (see inset of Fig. 5(a)). The signal for the CS sample contains a small linear susceptibility
χdc= 3.53×10⁻³emu/mol (see inset of Fig. 5(b)) that
has been subtracted from the data shown in figure 5(b). For the NCS sample, the value of Hp (complete pene-tration of the magnetic field) is 152 Oe while in the CS sample, Hp > 2500 Oe. For the NCS phase of Re3W
[image:4.595.63.297.50.226.2] [image:4.595.322.557.52.232.2]4
-400 -300 -200 -100 0
0.0 0.5 1.0 1.5 2.0 2.5
-10000 -5000 0
NCS Re
3
W
M
a
g
n
e
t
i
z
a
t
i
o
n
(
e
m
u
/
m
o
l
)
(a)
H
p
= 152 Oe
Applied field (kOe)
(b) CS Re
3
W
FIG. 4: (Color online) (a) and (b) Virgin magnetization curves measured at 1.8 K for the non-centrosymmetric and
centrosymmetric phases of Re3W.
down to 10 kOe. We presume that the magnetization will remain reversible up to the upper critical field, esti-mated from the resistance measurements presented below to be 113 kOe. In contrast, the magnetization of the CS sample only becomes reversible in magnetic fields above 40 kOe (with Hc2(T) ≈ 130 kOe). For lower fields the hysteresis loops of the CS sample contain a number of large magnetic-flux jumps, while no jumps are observed for the annealed samples. These flux jumps occur at lower temperatures (T ≤4 K) and at applied fields be-low ∼20 kOe. The number and magnitude of the flux jumps vary from loop to loop and become less frequent as the field sweeping rate,dH/dt, is decreased (data not shown). At 5 K with (dH/dt≤10 Oe/s) no flux jumps are observed and at higher temperatures (5 K< T < Tc) the flux jumps disappear.
The M(H) curves show that both Re3W phases
ex-hibit reversible behavior below Tc over a large region of the H-T phase diagram. These data indicate that the bulk pinning is stronger in the CS phase of Re3W than
the NCS phase, and that the flux jumps are due to ther-momagnetic instabilities induced by the motion of
vor--600 -300 0 300 600
-40-20 0 20 40
-500 -250 0 250 500
-40 -20 0 20 40
-14000 -7000 0 7000 14000
-40-20 0 20 40
-10 0 10 (a)
NCS Re
3
W
10 K
(b) CS Re
3
W
M
a
g
n
e
t
i
z
a
t
i
o
n
(
e
m
u
/
m
o
l
)
Applied Field (kOe)
12 K
FIG. 5: (Color online) (a) and (b) Magnetization hysteresis
loops at 1.8 K for the NCS and CS phases of Re3W. The
insets show theM(H) curves for the samples aboveTc.
tices into the superconductor combined with the sudden redistribution of the vortices within the sample18. The
symmetry of the loops suggests that surface barriers do not play an important role in determining the form of the magnetisation loops in this material. Further studies are underway to investigate the different pinning mecha-nisms in the two different phases of Re3W.
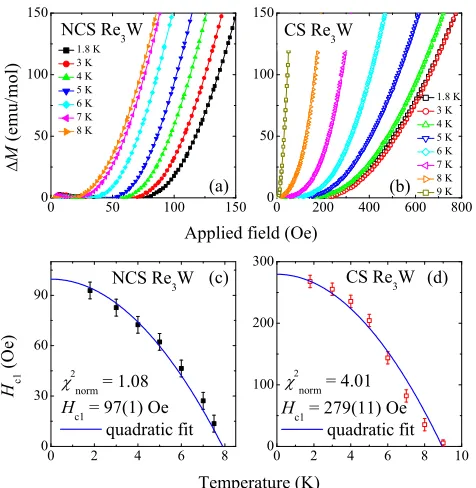
The value of the lower critical field, Hc1, was deter-mined by measuring the field of first deviation from the initial slope of the magnetization curve. To this end, a linear fit to the data between 0 to 10 Oe was made. The deviation from linearity, ∆M, was then calculated by subtracting this fit from the magnetization curves and plotted as a function of applied field [see Figs. 6 (a) and (b)]. The temperature dependence of Hc1 for the two phases of Re3W are obtained by using the
cri-terion ∆M = 10−4 emu/mol and plotted in Figs. 6
(c) and (d). Demagnetizing effects are taken into ac-count in estimating the Hc1 values. The values deter-mined for both the samples are fitted using the expres-sionHc1(T) =Hc1(0)
1−(T /Tc)2 , whereHc1(0) is the
[image:5.595.61.297.54.391.2] [image:5.595.326.560.57.385.2]0 50 100 150 0
50 100 150
0 200 400 600 800
0 50 100 150
0 2 4 6 8
0 30 60 90
0 2 4 6 8 10
0 100 200 300 1.8 K 3 K 4 K 5 K 6 K 7 K 8 K M ( e m u / m o l )
Applied field (Oe) NCS Re 3 W (a) 1.8 K 3 K 4 K 5 K 6 K 7 K 8 K 9 K CS Re 3 W (b) quadratic fit H c 1 ( O e ) H c1
= 97(1) Oe NCS Re 3 W (c) norm = 1.08 norm = 4.01 quadratic fit Temperature (K) H c1
= 279(11) Oe CS Re
3
W (d)
FIG. 6: (Color online) (a) and (b) Deviation, ∆M, from the
linear virgin magnetization as a function of applied field deter-mined at different temperatures for the NCS and CS phases
of Re3W. (c) and (d)Hc1as a function of temperature for the
NCS and CS phases of Re3W. The solid lines are fits to the
data using the expressionHc1(T) =Hc1(0)
1−(T /Tc)2 .
equation fits the data well for the NCS phase, whereas the model provides a poor fit to the data of the CS phase. The fits yieldHc1(0) of 97(1) and 279(11) Oe for the NCS and the CS samples respectively.
Resistivity measurements as a function of temperature were made in magnetic fields up to 90 kOe on both the NCS and the CS samples of Re3W [see Fig. 7 (a) and
(b)]. In the normal state just above Tc, both phases exhibit a small (∼ 0.6%) positive magnetoresistance in a magnetic field of 90 kOe. The temperature depen-dence of the upper critical field, Hc2(T), of the NCS and the CS samples, determined from the onset of the resistive transitions (defined by a 1% drop of the resis-tivity), are shown in Fig. 7 (c) and (d). For the NCS sam-ple, the temperature dependence ofHc2 is nearly linear close to Tc withdHNCS
c2 /dT =−23.0(2) kOe/K and can
be described using the Werthamer-Helfand-Hohenberg (WHH) model19,20. In fitting the data to the WHH
relations we calculated the Maki parameter, α = 1.41, compared with a value of 1.22 estimated from the gra-dientdHNCS
c2 /dT nearTc. The WHH fit yields Hc2NCS =
125(1) kOe atT = 0 K. The temperature dependence of
Hc2for the CS sample clearly shows a difference in behav-ior compared to the NCS sample with deviations from the conventional WHH dependence. The data has a positive curvature with temperature near Tc and is linear there-after. A similar behavior is observed in polycrystalline
0 40 80 120 160
0 2 4 6 8
0 50 100 150
0 2 4 6 8 10
R e s i s t i v i t y ( c m ) NCS Re 3 W (a) CS Re 3 W (b) 0 kOe 10 kOe 20 kOe 30 kOe 40 kOe 50 kOe 60 kOe 70 kOe 80 kOe 90 kOe norm = 1.12 NCS Re 3 W H c 2 ( k O e ) Temperature (K) (c) H c2
(0) = 125(1) kOe
norm = 1.93 CS Re 3 W (d) H c2
(0) = 147(3) kOe
FIG. 7: (Color online) (a) and (b) Temperature variation of the resistivity in a set of magnetic fields from 0 to 90 kOe for
the NCS and CS phases of Re3W. (c) and (d) Temperature
dependence of the upper critical fields of the NCS and CS
phases of Re3W. The solid line in Fig. 7(c) is a fit to the data
using the WHH model. The solid line in Fig. 7(d) is a fit to
the data usingHc2(T) =Hc2(0)(1−(T /Tc)3/2)3/2.
borocarbides21, MgB
222,23, and Nb0.18Re0.8224. A
rea-sonable fit to the data for the CS sample can be obtained using the expressionHc2(T) =Hc2(0)(1−(T /Tc)3/2)3/2
giving HCS
c2 (0) = 147(3) kOe25. A simple linear
extrap-olation of the lower temperature data toT = 0 K gives
HCS
c2 (0) = 178(5) kOe withdHc2CS/dT =−21(1) kOe/K.
A similar analysis of the data for the NCS sample gives
HNCS
c2 (0) = 153(1) kOe. While the temperature
depen-dence of Hc2 for the two phases is clearly different, the values ofHc2 atT = 0 K are comparable. The analysis presented above shows thatHc2(0) appears to be slightly higher in the CS phase. Measurements at higher fields and lower temperatures are required to reveal to what extent Pauli limiting plays a role in determiningHc2(0) in these materials.
The coherence length, ξ, can be calculated using the Ginzburg-Landau (GL) relation ξ = (Φ◦/2πHc2)
1/2,
where Φ◦ = 2.068×10−
15 Wb is the flux quantum26.
WithHNCS
c2 (0) = 125(1) kOe for NCS Re3W, the
esti-matedξNCS(0) is 5.13(2) nm. For CS Re
3W, the value
of ξCS(0) is deduced to be 4.73(5) nm from HCS c2 (0) =
147(3) kOe. Combiningξ and the standard expression
Hc1 = Φ0
4πλ2
lnλξ + 0.1227, we estimate the magnetic
penetration depth, λNCS(0) = 257(1) nm and λCS(0) =
141(11) nm for the NCS and CS phases of Re3W
respec-tively. The value ofλNCS(0) is in good agreement with
the value of 300(10) nm reported by Zuevet al.11. We
used the values ofλ(0) andξ(0) to calculate the GL pa-rameter κ = λ/ξ. They yield κNCS(0) = 50(1) for the
NCS phase andκCS= 30(3) for the CS phase of Re 3W.
[image:6.595.322.557.51.221.2] [image:6.595.59.297.54.298.2]6
TABLE III: Measured and derived superconducting and transport parameters of the non-centrosymmetric and
cen-trosymmetric phases of Re3W.
NCS Re3W CS Re3W
Tonset
c (K) 7.80±0.05 9.40±0.05
Hc1(0) (Oe) 97±1 279±11
Hc2(0) (kOe) 125±1 147±3
λ(0) (nm) 257±1 141±11
ξ(0) (nm) 5.13±0.02 4.73±0.05
κ(0) 50±1 30±3
ρ(295 K)(µΩm) 1.7 2.1
ltr (nm) 0.277 0.224
are listed in Table III.
IV. SUMMARY
In summary, we have shown that there are two different phases of Re3W. One phase is non-centrosymmetric with
an α-Mn structure and is superconducting with a Tc of 7.8 K. The other phase is centrosymmetric with a hexag-onal structure and is also superconducting with a Tc of 9.4 K. Switching between the two phases is made possi-ble by annealing (CS to NCS) or remelting (NCS to CS) the samples. The full hysteresis loops of the CS sample of Re3W show giant flux jumps, while no jumps are
ob-served for the NCS sample. The temperature dependence of Hc2 of the NCS phase for Re3W can be fitted using
the WHH model which yieldsHNCS
c2 (0) = 125(1) kOe. In
contrast, Hc2(T) of the CS phase of Re3W is linear at
lower temperature and has a positive curvature nearer to
Tc. A fit to the data gives HCS
c2(0) = 147(3) kOe. Using
GL relations, the penetration depths are estimated to be
λNCS= 257(1) nm andλCS= 141(11) nm and the
coher-ence lengths are calculated to beξNCS= 5.13(1) nm and ξCS= 4.73(1) nm atT = 0 K. Our results compare well
with unpublished work12 on the NCS phase of Re 3W.
To the best of our knowledge, Re3W is the first system
of its kind which can exist as either a centrosymmet-ric or a non-centrosymmetcentrosymmet-ric superconducting material. This, and similar systems if they exist, offer a good op-portunity to study the interplay between the structure, spin-orbit coupling, and the superconducting properties of intermetallic systems.
Acknowledgments
This work was supported by the Engineering and Phys-ical Sciences Research Council (EPSRC) and the Science and Technology Facilities Council (STFC). Xpress Ac-cess neutron beam time on GEM was provided by the UK Science and Technology Facilities Council (STFC). PKB would like to thank the Midlands Physics Alliance Graduate School (MPAGS) for a studentship. The Quan-tum Design MPMS magnetometer and PPMS used in this research were obtained through the Science City Ad-vanced Materials project: Creating and Characterizing Next Generation Advanced Materials project, with sup-port from Advantage West Midlands (AWM) and part funded by the European Regional Development Fund (ERDF).
1 E. Bauer, G. Hilscher, H. Michor, C. Paul, E. W. Scheidt,
A. Gribanov, Y. Seropegin, H. No¨el, M. Sigrist, and
P. Rogl, Phys. Rev. Lett.92, 027003 (2004).
2 L. P. Gor’kov and E. I. Rashba, Phys. Rev. Lett.
87, 037004 (2001).
3 P. A. Frigeri, D. F. Agterberg, A. Koga, and M. Sigrist,
Phys. Rev. Lett.92, 097001 (2004).
4 V. P. Mineev, Phys. Rev. B71, 012509 (2005).
5 N. Kimura, K. Ito, K. Saitoh, Y. Umeda, H. Aoki, and
T. Terashima, Phys. Rev. Lett.95, 247004 (2005).
6 I. Sugitani, Y. Okuda, H. Shishido, T. Yamada,
A. Thamizhavel, E. Yamamoto, T. D. Matsuda, Y. Haga, T. Takeuchi, R. Settai, et al., Journal of the Physical
So-ciety of Japan75, 043703 (2006).
7 N. Metoki, K. Kaneko, T. D. Matsuda, A. Galatanu,
T. Takeuchi, S. Hashimoto, T. Ueda, R. Settai, Y. O-nuki,
and N. Bernhoeft, J. Phys.: Condens. Matter 16, L207
(2004).
8 T. Akazawa, H. Hidaka, H. Kotegawa, T. C. Kobayashi,
T. Fujiwara, E. Yamamoto, Y. Haga, R. Settai, and
Y. ¯Onuki, Journal of the Physical Society of Japan 73,
3129 (2004).
9 J. K. Hulm and R. D. Blaugher, J. Phys. Chem. Solids19,
134 (1961).
10 R. D. Blaugher, A. Taylor, and J. K. Hulm, IBM J. Res.
Dev.6, 116 (1962).
11 Y. L. Zuev, V. A. Kuznetsova, R. Prozorov, M. D.
Van-nette, M. V. Lobanov, D. K. Christen, and J. R.
Thomp-son, Phys. Rev. B76, 132508 (2007).
12 V. A. Kuznetsova, Ph.D. thesis, University of Tennessee
(2007).
13 Y. Huang, J. Yan, Y. Wang, L. Shan, Q. Luo, W. Wang,
and H.-H. Wen, Supercond. Sci. Technol. 21, 075011
(2008).
14 P. Day, J. E. Enderby, W. G. Williams, L. C. Chapon,
A. Hannon, P. G. Radaelli, and A. K. Soper, Neutron News
15, 19 (2004).
15 B. H. Toby, Journal of Applied Crystallography 34, 210
(2001).
16 A. C. Larson and R. B. Von Dreele, Los Alamos National
17 T. P. Orlando, E. J. McNiff, S. Foner, and M. R. Beasley,
Phys. Rev. B19, 4545 (1979).
18 R. G. Mints and A. L. Rakhmanov, Rev. Mod. Phys.53,
551 (1981).
19 N. R. Werthamer, E. Helfand, and P. C. Hohenberg, Phys.
Rev.147, 295 (1966).
20 E. Helfand and N. R. Werthamer, Phys. Rev.
147, 288
(1966).
21 S. V. Shulga, S.-L. Drechsler, G. Fuchs, K.-H. M¨uller,
K. Winzer, M. Heinecke, and K. Krug, Phys. Rev. Lett.
80, 1730 (1998).
22 I. Shigeta, T. Abiru, K. Abe, A. Nishida, and Y.
Mat-sumoto, Physica C392–396, 359 (2003).
23 Y. Takano, H. Takeya, H. Fujii, H. Kumakura, T. Hatano,
K. Togano, H. Kito, and H. Ihara, Appl. Phys. Lett.78,
2914 (2001).
24 A. B. Karki, Y. M. Xiong, N. Haldolaarachchige,
S. Stadler, I. Vekhter, P. W. Adams, D. P. Young, W. A.
Phelan, and J. Y. Chan, Phys. Rev. B83, 144525 (2011).
25 R. Micnas, J. Ranninger, and S. Robaszkiewicz, Rev. Mod.
Phys.62, 113 (1990).
26 E. H. Brandt, Phys. Rev. B37, 2349 (1988).
27 M. Tinkham,