I
IMPROVING CUSTOMER SATISFACTION
THROUGH PERSONALIZATION
Master thesis
Enschede, November 27, 2015
AUTHOR
Asjen van den Berg
Study Programme Business Information Technology Faculty of Electrical Engineering, Mathematics and Computer Science
Student no. 1006444
Email [email protected]
GRADUATION COMMITTEE
Dr. Hans Moonen
Department Industrial Engineering and Business Information Systems
Email [email protected]
Dr. Marten van Sinderen
Department Computer Science
Email [email protected]
Jos Hendrix
Department Business Systemen
Email [email protected]
Robin van Veen
Department Business Systemen
III
FOREWORD
Whatever you do, work at it with all your heart, as working for the Lord, not for men (Col. 3:23, NIV)
Dear reader,
You are currently reading the result of eight months of research work, which concludes my Master Business Information Technology. Unfortunately, this version of the thesis is not personalized. If it was, this thesis would suit exactly to your needs, whether you are an interested family member or friend, an employee of NS, one of my supervisors or somebody wanting to apply personalization in his or her company.
As is the case in the majority of graduation assignments, the first phase of the research described in this thesis was very foggy and cost a lot of effort. The field of personalization is very broad and a lot of research directions were possible. Also, it was challenging to determine a balance between scientific rigour and practical application. When that balance was found, the work progressed much faster and became more enjoyable as well. In the end, I can look back on a satisfying journey towards the result you are currently reading: my Master’s thesis.
This would not have been possible without the support and feedback of my supervisors. Hans and Marten, thanks to you for being critical and challenging me to think a few steps ahead, even though sometimes it was hard to find a timeslot in which we could meet. Jos and Robin, thank you for showing and explaining me the ins and outs of the NS environment and helping me to apply my research at NS. I am grateful for the numerous colleagues at NS that helped me by giving feedback and using their expertise to validate my theories. Also, I greatly enjoyed the contact with my colleagues from VM. The daily lunch walks through Utrecht enabled a fresh start of the afternoon and the atmosphere was very positive!
Finally, I want to thank my family and friends, in particular my wife Annet, for supporting me. Hopefully you will enjoy the reading!
V
EXECUTIVE SUMMARY
From the owner of the grocery shop around the corner to the search results of Google: personalization is found in all facets of society. In this thesis, personalization is applied on the online services of the Dutch Railways (NS), in order to improve the customer satisfaction regarding those services. More specifically, personalization is used to reduce customer effort, which is an indicator of customer satisfaction.
Using a literature study and real-world case studies, background information about personalization is retrieved and summarized. A design science approach is used to redesign two online services, in order to reduce customer effort. The redesign is demonstrated and validated to estimate its effects on customer effort, and analyzed to determine its impact on the IT landscape of NS. Finally, findings from both literature and the redesign analysis are synthesized to define generic impact factors of personalization on the IT of a company.
The literature study and case studies led to several conclusions about the effects and methods of personalization. Furthermore, literature regarding personalization was found in some ways to be subjective and biased, which leads to recommendations with respect to future scientific research.
The main conclusion is that NS should personalize its online services through layered authentication, by which services can be offered at three authentication levels. At each authentication level, the services have specific characteristics and the customer is encouraged to increase his authentication level. For users that are not logged in, services should be simple and accessible. For users that have created and are logged into their account, services should be fluent and personal by remembering personal customer information and previous behaviour. When customers have connected their OV-chipkaart to their account, services should be extensive and pro-active: customers that have fully authenticated themselves can receive the most personalized services.
Expert validation is used to conclude that the usage of layered authentication lowers the customer effort regarding the redesigned online services. Also, the redesign will cause customers to transfer from using offline channels to using online channels for the services of NS. Thirdly, the layered authentication approach will result in a higher percentage of customers being identified online, which positively affects the possibilities of NS to personalize customer interactions. Because experts were not able to precisely guess to which extent the redesign would improve the current situation, the conclusions cannot be quantified, which is a limitation of the redesign validation. The impact on NS’s IT of the changes caused by introducing layered personalization is analysed at two levels: an architectural and a processual level. A baseline and target architecture are designed and a gap analysis is done. The biggest change at the architectural level consists of introducing an Identity and Access Management (IAM) system, which identifies and authenticates customers across all online channels and provides channels with customer information so that they can authorize those customers. At a processual level, many small changes are identified to adapt business processes to the usage of layered authentication. Most changes are related to the front-end systems, which take care of the customer dialogue in multiple service variants.
The generic impact of personalization on the IT of a company is summarized by four factors. Firstly, when applying personalization, companies need data integration and analytics capabilities because customer data is the basis of personalization. Secondly, identity and access management is needed to consistently recognize customers in order to provide personalized services. Thirdly, the service architecture of a company needs to be adaptable to be able to handle changes in channels, services or available customer data. Fourthly, applying personalization increases the complexity of a company’s IT landscape, which can be reduced using several techniques.
VI
TABLE OF CONTENTS
1 Introduction ... 1
1.1 Introduction to Personalization ... 2
1.2 Nederlandse Spoorwegen ... 2
1.3 Research motivation ... 3
1.4 Scope and focus ... 4
1.5 Definition of personalization ... 5
1.6 Related terms ... 5
1.7 Research questions ... 6
1.8 Structure thesis ... 6
2 Nederlandse Spoorwegen ... 7
2.1 Goals NS ... 8
2.2 Services and channels NS ... 9
2.3 Statistics about service usage and customers ... 9
2.4 Problem definition ... 13
2.5 Organization chart NS ... 14
3 Research methodology ... 16
3.1 Design problems and knowledge questions ... 17
3.2 Literature study ... 17
3.3 Case studies ... 19
3.4 Design science study ... 19
3.5 Generalization of personalization impact on IT ... 21
3.6 Summary ... 21
4 Effects of personalization ... 22
4.1 Ideal types of personalization ... 23
4.2 User experience and customer satisfaction ... 23
4.3 Revenue ... 24
4.4 Negative effects ... 25
4.5 Experiences from practice ... 25
4.6 Conclusion ... 27
5 Applying personalization ... 29
5.1 Personalized elements ... 29
5.2 Learning method ... 30
5.3 Initiating actor ... 30
5.4 Specificity ... 31
VII
5.6 Personalization process ... 33
5.7 Complexity of personalization ... 33
5.8 Experiences from practice ... 35
5.9 Conclusion ... 36
6 Redesign process ... 38
6.1 Redesign objectives ... 38
6.2 Personas ... 38
6.3 Service selection ... 39
6.4 Theory of Initial and Regular Effort ... 41
6.5 Gap identification using initial and regular effort ... 43
7 Redesign ... 46
7.1 Redesign: personalizing authentication for the online services ... 46
7.2 Redesign: refund because of delay ... 51
7.3 Redesign: travel history and card information ... 53
7.4 Summary of redesign ... 54
8 Redesign demonstration and evaluation ... 56
8.1 Hypotheses ... 56
8.2 Demonstration and validation methods ... 56
8.3 Evaluation results ... 58
8.4 Conclusion ... 60
9 Redesign impact on IT ... 62
9.1 Architecture ... 62
9.2 Processes ... 69
9.3 Validation ... 74
9.4 Conclusion ... 74
10 Generic impact of personalization on IT ... 76
10.1 Need for data integration and analysis ... 77
10.2 Identity and Access Management ... 80
10.3 Need for adaptability ... 82
10.4 Complexity reduction... 83
10.5 Validation ... 85
10.6 Conclusion ... 85
11 Conclusions and Discussion ... 87
11.1 Answers to research questions ... 87
11.2 Main conclusions ... 91
11.3 Research methodology and limitations ... 91
VIII
11.5 Future developments ... 93
11.6 Recommendations for science ... 95
11.7 Recommendations for practice ... 96
Appendix A Glossary ... 108
Appendix B Persona descriptions ... 109
Appendix C Overview central services NS ... 111
Appendix D Consulted Experts ... 112
Appendix E HTML Mockups ... 113
IX
LIST OF TABLES
Table 1 – Service examples at online and offline channels ... 9
Table 2 – Statistics about customer satisfaction and effort per channel (MarketResponse, 2015) ... 13
Table 3 – Keywords used in literature search ... 19
Table 4 – Summary of answering research questions ... 21
Table 5 – Personalization effects found in case studies ... 26
Table 6 – Personalization applications found in case studies... 36
Table 7 – The Persona Matrix ... 39
Table 8 – Personalization suitability of services ... 40
Table 9 – Services and authentication categories ... 50
X
LIST OF FIGURES
Figure 1 – Needscope personas (van Hagen, 2009) ... 4
Figure 2 – Types and amounts of travellers ... 10
Figure 3 – Statistics regarding customer contacts in 2014 (Nederlandse Spoorwegen, 2014a) ... 10
Figure 4 – Visits to Mijn NS in 2014 (Internal documents NS) ... 11
Figure 5 – Customer call statistics (Internal documents Customer Service) ... 11
Figure 6 – Filed claims in case of delay in 2014 (Internal documents Customer Service)... 12
Figure 7 – Customer satisfaction rates per channel (MarketResponse, 2015) ... 12
Figure 8 – Organization Chart of relevant stakeholders ... 14
Figure 9 – High-level research methodology model ... 17
Figure 10 – Literature search method... 18
Figure 11 – Design Science Research Methodology process (Peffers et al., 2008) ... 20
Figure 12 – Personalization Ideal Types (Fan & Poole, 2006), annotations made by author thesis... 23
Figure 13 – Summary of found effects of personalization ... 27
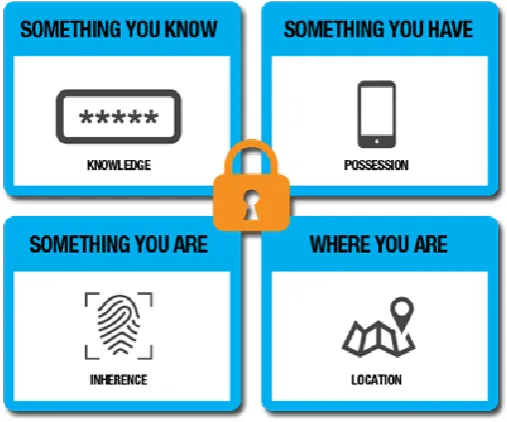
Figure 14 – Authentication factors (Onegini, 2015) ... 29
Figure 15 – BI&A categories (H. Chen et al., 2012) ... 31
Figure 16 – Generic personalization process model (Vesanen & Raulas, 2006) ... 33
Figure 17 – RichRelevance Personalization Maturity Model (RichRelevance, 2013) ... 34
Figure 18 – Example mapping of service ... 41
Figure 19 – Relationship between privacy-sensitiveness and effort levels ... 42
Figure 20 – Relationship between user and channel characteristics and effort levels ... 42
Figure 21 – Comparing current and desired situation for selected services ... 44
Figure 22 – Overview of relevant customer data attributes ... 48
Figure 23 – Layered authentication levels ... 48
Figure 24 – Summary of services at authentication levels ... 49
Figure 25 – Variants of refund in case of delay service for authentication levels ... 52
Figure 26 – Functionality available at card authentication levels ... 54
Figure 27 – Screenshot from HTML wireframe ... 57
Figure 28 – High-level architecture AS IS view ... 62
Figure 29 – Generic service process ... 63
Figure 30 – Comparison of scenarios in steps 1 – 3 ... 64
Figure 31 – Heterogeneous mash IAM architecture (Milenković et al., 2012) ... 64
Figure 32 – Federated IAM Architecture (Milenković et al., 2012) ... 65
Figure 33 – Comparison of scenarios in step 4 ... 65
Figure 34 – Overview of advantages centralization and decentralization ... 66
Figure 35 – High-level architecture TO BE view ... 67
Figure 36 – New and existing architecture elements in TO BE architecture ... 67
Figure 37 – AS IS Customer authentication process ... 70
Figure 38 – TO BE Customer authentication process ... 70
Figure 39 – Generic, AS IS and TO BE processes of Refund in case of Delay service ... 72
Figure 40 – Generic, AS IS and TO BE processes of Travel history and card information service ... 73
Figure 41 – Use of information sources for generalized impact... 76
Figure 42 – The 7-S Framework by McKinsey (Bryan, 2008) ... 76
Figure 43 – Dimensions of a broad KYC program (Shepard & Fernandez, 2015) ... 77
Figure 44 – Generic components of BI Architecture (Chaudhuri et al., 2011) ... 78
Figure 45 – Relationship between BI architecture and personalization (based on Chaudhuri et al., 2011) ... 78
Figure 46 – Technologies related to different types of analytics (H. Chen et al., 2012) ... 79
Figure 47 – SOA – Before and After (Tridens, 2014) ... 82
XI
Figure 49 – A non-optimal way to partition business functions (Sessions, 2011) ... 85
Figure 50 – Summary of found effects of personalization ... 87
Figure 51 – Layered authentication levels ... 90
Figure 52 – Example of MaaS-application (MaaS.fi, 2015) ... 94
Figure 53 – Basic characteristics of EdgeRank algorithm (Constine, 2014) ... 96
Figure 54 – Summary of answers to question 1 of online questionnaire ... 117
Figure 55 – Summary of answers to question 2 of online questionnaire ... 117
Figure 56 – Summary of answers to question 3 of online questionnaire ... 117
Figure 57 – Summary of answers to question 4 of online questionnaire ... 118
Figure 58 – Summary of answers to question 5 of online questionnaire ... 118
Figure 59 – Summary of answers to question 6 of online questionnaire ... 118
Figure 60 – Summary of answers to question 7 of online questionnaire ... 119
2
1
INTRODUCTION
In this chapter, the research is introduced. First, the concept of personalization and the situation of NS are introduced. Then, the research motivation and scope are stated. After this, the definition of personalization is given, related terms are clarified and the research questions are stated. Finally, an overview is given of the remainder of this thesis.
1.1 INTRODUCTION TO PERSONALIZATION
Personalization, the tailoring of products and services to make them more relevant for the customer, has received a lot of attention in the past few years. US marketing professionals identify personalization as the most important future area to their company’s marketing moving forward (Marketing Charts, 2014). Consumers also appreciate personalization: “The majority of consumers want to be recognized and expect personalized experiences across channels and devices” (MyBuys, 2014). The popularity is rising because the possibilities of data collection, analysis and personalization are increasing rapidly. With Big Data technologies, companies suddenly have the possibility to analyze every customer contact and draw conclusions from it in a systematic way. Kurt Schlegel, research vice-president at Gartner, said that “offering customers a highly personalized level of service will be among the key trends of 2014 for many firms when it comes to determining their big data strategies” (Kognitio, 2014).
In the good old days of the local grocery shop around the corner, analog personalization was already present: when a regular customer would walk in, the shop owner would recognize him, greet him and, possibly, tell him about the new magazine he knew the customer would like. If the regular customer would then go to the bar next door, the bar keeper would pour a whisky on the rocks – his favorite drink, without him needing to ask for it. Later, manufacturers used mass customization to produce products at a large scale, while still offering varying products to account for differences between their customers (Gilmore & Pine II, 1997). While in the beginning of the 20th century, Henry Ford stated that “any customer can have a car painted any colour that he wants so long as it is black”, currently, almost every detail of a car can be adapted to a customer’s desires.
In the digital age, personalization is applied even more often. Google analyzes search history and the search data of similar customers to offer personalized search results to each customer (Hannak et al., 2013). AirBnB offers the searching customer the rooms and houses he will most likely accept. Recently, they have introduced a new feature which also takes into account the renter’s preference in the sorting algorithm. If the customer is a 21-year old guy from Germany and the renter has often rejected those kinds of people before, the house of that renter will be placed lower in the search results because of that (Ifrach, 2015). At numerous other services, like LinkedIn, Bol.com, Facebook, Spotify and Amazon, recommendations are personalized so that your past preferences are taken into account when recommending things to buy or people to connect with.
1.2 NEDERLANDSE SPOORWEGEN
The Dutch Railways (Dutch: Nederlandse Spoorwegen, abbrev. NS) are responsible for a large part of the passenger train transport in the Netherlands: in 2013, the passengers of NS travelled more than 16 billion kilometers together (Nederlandse Spoorwegen, 2013). This is around 70 percent of the total Dutch public transport and almost 90 percent of the passenger transport by train (Kennisinstituut voor Mobiliteitsbeleid, 2015). All shares of NS are owned by the Dutch Government, but it is still a private company: NS was never nationalized. In the second half of the 20th century, NS received substantial subsidies from the Dutch Government because they were declared to be a company of national importance, especially in the years after the Second World War. However, more recently, the government decided there should be market competition in the rail sector and currently, the subsidies are not granted anymore.
3
the train journey. There are many channels NSC can use to contact customers, such as the website, a smartphone application, customer service via telephone, post or the service shops and ticket machines at railway stations. Business Systemen is divided into two sections: one section is responsible for the central services of NS, like the website, customer service via telephone or analog mail etc. Central services are services that are centrally deployed: the website is centrally hosted, the help desk is in one certain place. Another section is responsible for the decentral services, like the vending machines and service desks at the railway stations and the travel information at the stations and inside the trains.
This research is requested by the part of Business Systemen that is concerned with the central services of NS Commercie, and therefore, this research will focus on those central services.
An overview of the central services of NS can be found in Appendix C. More information about the different departments involved in this research can be found in section 2.5.
1.3 RESEARCH MOTIVATION
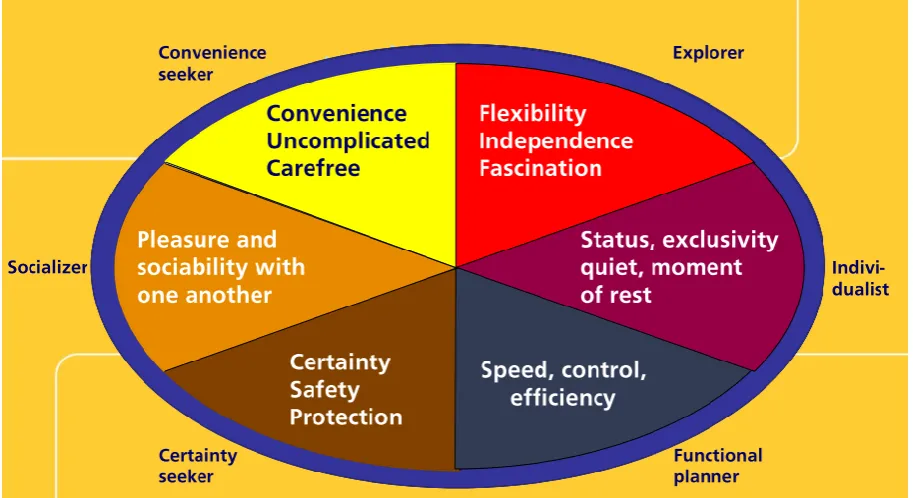
Customers are not very satisfied with the services NS is offering. For example, the website of NS is currently rated a 5.8 out of 10 by its visitors, compared to a rating of 7.6 out of 10 for Customer Service via telephone (MarketResponse, 2015). Also, when compared with a benchmark for American insurance and bank websites, the website of NS scores a lot lower than the average, which is 8.0 out of 10 (The American Customer Satisfaction Index, 2014). Results of research about personalization indicate that customers perceive personalized services as more useful (Liang, Chen, Du, Turban, & Li, 2012). Personalization could be a way to improve the customer satisfaction of the central services of NS, but research is needed to confirm this and identify best ways to do this. Personalization offers a lot of opportunities to distinguish between (types of) customers and serve them in a way they would like to be served. It is especially relevant for NS, because NS has a heterogeneous group of customers, from all ages, with different travelling patterns and motivation, having different levels of digital literacy (van Hagen, 2009).
4
Figure 1 – Needscope personas (van Hagen, 2009)
However, the majority of personalization effort regarding the central services is incidental: there is no overarching vision on personalization. Also, there are a lot of ideas being brought up by NS employees, but there is not much insight into how those ideas would affect IT, nor is clear what the improvement effects of those ideas are on the goals NS has. There is a lot of buzz regarding personalization, but not much is currently done to actually implement it.
Therefore, research is needed into the application of personalization on the central services of NS. First, more knowledge is needed about how personalization can affect customer satisfaction and what other effects it has. Second, it is currently not clear how personalization can be applied and what can actually be personalized. Third, personalization can have a lot of impact on the IT of a company: those two subjects are thoroughly linked. McKinsey researchers state that IT makes personalization possible (Bughin, Chui, & Manyika, 2013). Research is needed into which changes into IT architecture and processes are needed to facilitate personalization.
1.4 SCOPE AND FOCUS
A well-defined research scope prevents the research becoming too broad in order to ensure enough depth. However, the research need not be too specific in order to ensure added research value: the research should be applicable to other situations as well.
The research scope is made more specific by choosing reduction of customer effort as an indicator for the increase of customer satisfaction, which is the final goal of applying personalization. Personalization is shown to reduce customer effort (Liang, Lai, & Ku, 2007). Customer effort is a reliable and accurate measure of customer satisfaction (Dixon, Freeman, & Toman, 2010).
5
Knowledge will be gained on a theoretical, abstract, level by discussing the application of personalization on companies in general, as well as on more concrete, by showing how personalization can be applied in the situation of NS.
1.5 DEFINITION OF PERSONALIZATION
Personalization is used in a number of different research and applied fields, such as e-commerce, computer science, architecture, information science and social sciences (Fan & Poole, 2006; Vesanen, 2005). It has been an upcoming field in the past fifteen years. Definitions of personalization vary widely, dependent on the field and research goal of the authors defining personalization (Fan & Poole, 2006).
A general definition of personalization is given by the Personalization Consortium [document itself not available anymore, but cited by (Adolphs & Winkelmann, 2010; Fan & Poole, 2006; Koutsabasis et al., 2008; Liang et al., 2007; Vesanen, 2005)]: "Personalization is the combined use of technology and customer information to tailor electronic commerce interactions between a business and each individual customer." In this definition is spoken of interactions between a business and its customers, and not of a system. Also, the use of information about the customer and the technology is mentioned and personalization factors are not mentioned. However, electronic commerce is specifically mentioned as a field in which personalization is used. This is too narrow for this research, because buying and selling is not the only application field of personalization.
When the definition of the Personalization Consortium is made more general by removing the reference to electronic commerce, the definition is as follows:
Personalization is the combined use of technology and customer information to tailor interactions between a business and each individual customer.
This definition indicates the essence of personalization: the tailoring of interactions, without specifying how and why this happens, thus not limiting the execution of personalization to a specific way. Therefore, this is the definition that will be used in this research.
1.6 RELATED TERMS
The concept of personalization is often confused with customization. In this thesis, customization is seen as a way to achieve personalization. Personalization means making the product or service more relevant to the customer using information about that customer. Customization is a specific way to do that: using direct and explicit input from the customer, the product or service is tailored. In other words, customization is another term for explicit personalization (Fan & Poole, 2006; Piller, 2015).
Another term related to personalization, often used in the financial world, is Know Your Customer (KYC). KYC is used by banks and other financial institutions to determine the risk level of certain customers (Jones & Stahl, 2011). To do this, they gather and analyze all sorts of information about their (prospective) customers. This is similar to personalization, only the goal is not to provide relevant services or products, but to assess the risk related to certain customers.
6
1.7 RESEARCH QUESTIONS
The main research question is formulated as follows:
How can the online services of NS be personalized, so that customer effort is reduced, and how does that affect its IT?
The following sub-questions are identified:
RQ1. What is the effect of personalization on customer effort and what other effects does it have? RQ2. What are the best ways to apply personalization?
RQ3. Which impact can personalization have on the IT of a company?
RQ4. How and to which extent does personalization affect the customer effort of the online services of NS?
RQ5. How can NS best personalize its online services in order to reduce customer effort?
RQ6. Which changes in IT architecture and processes are needed to apply personalization on the online services of NS?
The first two research questions will be answered via a literature study, questions three to five will be answered following a design science cycle and the last question will be answered via a generalization of the design science effort. More explanation about the research methodology will be given in chapter 3.
1.8 STRUCTURE THESIS
The structure of this thesis is based on the format defined by Gregor and Hevner (2013): Positioning and presenting design science research.
This chapter gives an introduction to the thesis, which consists of an introduction to personalization and the context of NS and the research motivation and questions.
In the second chapter, an extensive overview is given of NS, its goals and the services it provides to customers. From this context, a problem definition is derived, which will serve as the basis for the redesign, later in this thesis. Chapter 3 describes the methodology with which the research is carried out. This research is primarily based on the Design Science Research Methodology defined by Peffers et al. (2008).
Chapters 4 and 5 consist of the results of a literature study done to gain more information about personalization. Chapter 4 focuses on the effects of personalization and the goals that companies can have to apply personalization. Chapter 5 focuses on how personalization can be applied and what categorizations can be made. Both chapters end with three case studies through which the theory found in literature can be validated against practice.
Chapters 6 and 7 are focused on the redesign that is central in this research. In chapter 6, the redesign process is described and the theory of initial and regular effort is defined. Chapter 7 describes the redesign, which applies layered authentication on the online services of NS. In more detail, two services are redesigned: refund in case of delay and travel history and card information.
In chapter 8, the redesign is demonstrated using HTML mockups and evaluated with experts from NS using semi-structured interviews and an online questionnaire.
The impact of personalization on IT is described in chapters 9 and 10. Chapter 9 does this for the redesign of NS’s online services, described in chapter 7. In chapter 10, the general impact on IT is given for companies that want to apply personalization.
7
2 NEDERLANDSE
8
2
NEDERLANDSE SPOORWEGEN
In this chapter, background information is provided about NS. This gives insight into the problem context of this research. First, the most important business goals of NS are listed. Then, an overview is given of the services NS currently offers and through which channels it offers them, after which some statistics are shown about NS’s customers and their service usage. Finally, the most important problems are defined and an organization chart of NS is shown, containing the most relevant departments with respect to this research.
2.1 GOALS NS
To know if personalization is a suitable strategy for NS, knowledge is needed about the goals that NS has formulated. Therefore, documents of NS and of external parties about NS are reviewed to discover those goals.
2.1.1 STRATEGY NS
NS has formulated a strategy for 2014-2017 (Nederlandse Spoorwegen, 2014b). Core of this strategy is the customer focus: the customer is of utmost importance for NS. Average “ok” is not good enough and therefore, a specific focus is on the less performing services of NS: they should be improved first (Nederlandse Spoorwegen, 2014b). NS concretizes this strategy in their “Vervoerplan” (English: Transport plan) in which they state how they will operate in the next ten years and what the focus will be of future improvements. Key is that NS wants to treat its customers in an excellent way and provide outstanding service that corresponds with their needs, sometimes before they even know it themselves. According to the plan, NS will invest in online services so that customers can more easily use those services and the satisfaction will go up (Nederlandse Spoorwegen, 2015). NS creates the plan as a part of the concession for the use of the core rail network in the Netherlands and therefore, the Dutch Government can use the plan to review the performance of NS.
2.1.2 CUSTOMER SATISFACTION
Customer satisfaction is of utmost importance for NS. Not only because satisfied customers are often more loyal and will return more frequently to use the services of NS, but also because NS risks fines from the Ministry of Infrastructure and Environment when customer satisfaction is too low (Ministerie van Infrastructuur en Milieu, 2014). This fine could get up to €2.75 million per year and has recently been increased to a maximum of €6.5 million per year. In 2014, NS has had the maximum fine of €2.75 million (Nu.nl, 2015) because of the customer satisfaction regarding punctuality and the availability of seats during rush hour being too low. These fines are based on a number of performance indicators which have to be above a certain threshold. Among the performance indicators are: “general customer satisfaction”, “analysis of customer insight research” and “analysis of customer service reports” (Ministerie van Infrastructuur en Milieu, 2014).
Customer satisfaction is also influenced by a number of services NS offers to customers, apart from the actual train journey. Examples of these services, which are offered by NS Commercie, are customer service by phone, email, regular mail and Twitter, refund with delays, refund when a customer forgets to check out, the website NS.nl and the personal portal Mijn NS.
Current customer satisfaction about online services is too low. This can be seen, for example, by looking at satisfaction and effort levels of the website of NS, coming from online customer satisfaction questionnaires by MarketResponse (2015). More information about satisfaction levels can be found in section 2.3. This low satisfaction level could be caused by the fact that the website is not tailored to the needs of specific groups of customers.
2.1.3 INTERNAL EFFICIENCY
9
like the processing of claims, employee involvement should be avoided as much as possible: automatically processing those claims will save costs. In the current situation, customer channels are often not connected and there is not one single view of the customer: it is dispersed across several information systems.
There is a need to improve the services of NS Commercie, so that the customer gets more satisfied and NS will work more efficiently, saving money in the process.
2.1.4 REVENUE
Like almost every other company, NS wants to increase its revenue, and eventually, its profit. Revenue is generated by selling train tickets, single as well as season tickets, to customers, but also by selling food, drinks and other items in shops at railway stations. NS Commercie, the primary stakeholder of this research, is involved with the train tickets. They are trying to find the optimal product portfolio so that customers can find products which suit them which causes as many as possible customers to travel by train and the revenue of NS to increase.
2.2 SERVICES AND CHANNELS NS
NS offers a number of central services via different channels. The services can be divided into three categories: Information, Sales and Service, all of which are related to different service goals. Informational services aim at providing information to customers, sales services are related to selling single and seasonal tickets and services from the Service-category aim at helping customers in different ways.
The channels NS communicates through can be divided into online and offline channels. Online channels use the internet to communicate. Examples of online channels of NS are the website, the smartphone application Reisplanner Xtra, social media like Twitter and email. Offline channels do not use the internet to communicate. Examples of offline channels of NS are analog mail, vending machines, paper forms and telephone.
Service examples for the three categories via the online and offline channels are displayed in Table 1.
Information Sales Service
Online Journey planner on
smartphone application “Reisplanner Xtra”
E-ticket and season ticket sales via the web shop
Generating a travel history overview via Mijn NS
Offline Travel information at a service desk in a railway station
Paper ticket sales at a
vending machine Paper form to claim refund in case of delay
Table 1 – Service examples at online and offline channels
NS currently applies personalization at some services and channels. Examples of personalization at NS in the current situation can be found in section 1.3. A full overview of the services, together with the channels they can be accessed through and the personas that use those services, can be found in Appendix C.
2.3 STATISTICS ABOUT SERVICE USAGE AND CUSTOMERS
To give an impression of the usage and satisfaction of the services and channels of NS, this section provides a graphical summary of statistics regarding those subjects.
2.3.1 TRAVELLER QUANTITIES
10
Figure 2 – Types and amounts of travellers
2.3.2 USAGE OF CHANNELS AND SERVICES
[image:23.595.116.480.69.287.2]This section describes how and how often the channels and services of NS are being used. Figure 3 shows how often the contact channels are being used by customers. There are a still a lot of calls to NS, but the digital channels like Twitter and Mijn NS are also used often.
Figure 3 – Statistics regarding customer contacts in 2014 (Nederlandse Spoorwegen, 2014a)
9400
2632
734
D U T C H T R A V E L L E R S
( T O T A L ) T R A V E L L E R S W I T H S E A S O N T I C K E T T R A V E L L E R S W I T H F U L L Y F U N C T I O N I N G M I J N N S A C C O U N T
TYPES AND AMOUNTS OF
TRAVELLERS (X1000)
Customer
contacts
2014
235.000
emails190.000
letters andforms
2.000.000
telephone calls1.400.000
questionsasked to personal digital
assistant
415.000
tweets to @NS_online
120.000
followers on Twitter
90.000
messages onthe online service forum
3.515.000
visits to Mijn11
[image:24.595.116.480.135.353.2]In Figure 4 is shown how often the different elements of Mijn NS were visited in 2014. Personal travel history is by far the most visited part of Mijn NS, and the second most visited part is My Products, which contains information about season tickets and the OV-chipkaart. Customers rarely look at their claim history, probably because NS also communicates about the claim status via email.
Figure 4 – Visits to Mijn NS in 2014 (Internal documents NS)
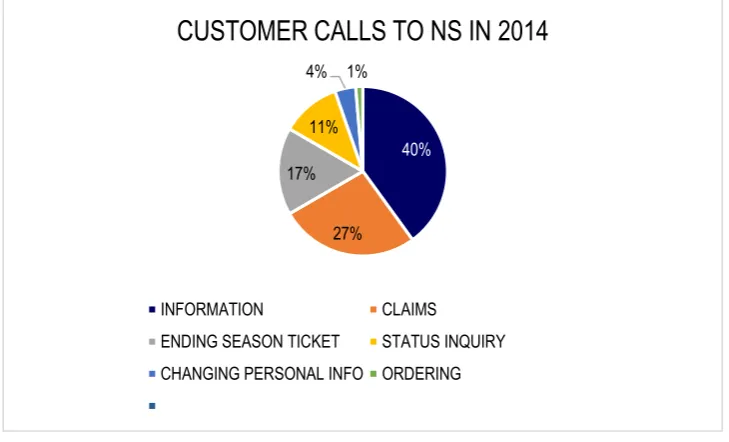
Every month, more than 160.000 customer calls are being made to Customer Service. As is shown in Figure 5, customers most regularly call to ask for information regarding e.g. journey planning. Also, a lot of telephone calls are being made about claims, when a customer experienced delay or in case of a forgotten check-in or check-out.
Figure 5 – Customer call statistics (Internal documents Customer Service)
In 2014, just over 335.000 claims were accepted that were filed by customers because of delay they had experienced. As can be seen in Figure 6, almost three-quarters of those claims was done online, via the travel history overview of Mijn NS. The offline option, via a paper form, was used almost 100.000 times.
1700
1300
750
600
170
75
M Y T R A V E L
H I S T O R Y P R O D U C T SM Y P E R S O N A L I N F O M Y I N V O I C E S M Y O R D E R S M Y C L A I M S
VISITS TO MIJN NS IN 2014 (X1000)
40%
27% 17%
11% 4% 1%
CUSTOMER CALLS TO NS IN 2014
INFORMATION CLAIMS
ENDING SEASON TICKET STATUS INQUIRY
[image:24.595.116.481.426.647.2]12
Figure 6 – Filed claims in case of delay in 2014 (Internal documents Customer Service)
2.3.3 SATISFACTION ABOUT CHANNELS AND SERVICES
[image:25.595.100.498.438.671.2]In this section, statistics are presented with respect to the customer satisfaction regarding services of NS. Figure 7 shows how the customer satisfaction rate differs per contact channel, on a scale of 1 to 10. Overall, the customer satisfaction rate is 7.1. Personal channels like live chat and telephone are rated higher than average, and contact channels like email, website and service forum are only adequate. The website satisfaction rate is still acceptable because of high satisfaction regarding the online journey planner. Other parts of the website are rated lower. In Table 2, more extensive statistics are shown with respect to customer satisfaction and customer effort. Customer effort scores closely match the satisfaction scores.
Figure 7 – Customer satisfaction rates per channel (MarketResponse, 2015)
73% 27%
FILED CLAIMS IN CASE OF DELAY IN 2014
ONLINE, VIA MIJN NS OFFLINE, VIA PAPER FORM
7.1
5.7
5.1
7.6
6.3
7.6
5.8
13
Satisfaction level Effort score
Average 1-5 (low) (%) 6 (adeq.) (%) 7-10 (high)
(%) 4-5 (high) (%) 3 (med) (%) 1-2 (low) (%)
All channels 7.1 21 6 73 28 18 54
Email 5.7 40 8 52 35 22 43
Service forum 5.1 49 10 40 51 18 31
Live chat 7.6 15 4 80 15 12 73
Mail 6.3 32 9 59 31 24 46
Telephone 7.6 14 5 80 24 18 58
Website 5.8 39 9 51 44 15 41
Table 2 – Statistics about customer satisfaction and effort per channel (MarketResponse, 2015)
The average customer satisfaction of bank and insurance websites of the United States was found to be 8.0 on a scale of 1 to 10 in 2014 (The American Customer Satisfaction Index, 2014), which is significantly higher than the satisfaction level of the website of NS, which is 5.8 on that scale.
2.4 PROBLEM DEFINITION
Analyzing previous statistics yields several observations. There is a relatively low customer satisfaction and a high customer effort score, especially the satisfaction and effort for online services is poor and should be improved. For the website, almost half of the customers indicate the service level is only adequate or below adequate.
This leads to a lower usage of the online channels and therefore, a higher usage of the offline channels, such as telephone, of which the satisfaction level is significantly higher. Offline channels are more expensive to maintain because employees need to invest more time into an offline service request: a call takes more time than approving a digital request. Therefore, the low customer satisfaction also leads to cost increase for NS. Unfortunately, due to data from other companies not being available, it is not possible to compare the ratio of online and offline contacts with other cases.
The principle of “Know Your Customer” is essential to every customer-oriented company (Jones & Stahl, 2011). NS also tries to do this. The online environment is suitable for this goal, when customers can be identified and their behavior tracked. However, of the total number of season tickets, only 24 percent is connected to a Mijn NS account and since Mijn NS is the only online place to use certain services, more than three-quarters of the season ticket holders do not have access to those services online and do not interact with NS in this way. NS customers are therefore not much engaged online. This is probably caused by the high customer effort score mentioned before. Therefore, the problem in this research is defined as follows:
1. The customer effort score for online services of NS is too high, the customer satisfaction score is too low 2. Customers relatively use services much via offline channels compared to online channels
14
2.5 ORGANIZATION CHART NS
There are several involved departments of NS that are influenced by this research. A graphical overview of those departments and their responsibilities is given in Figure 8. After that, the departments are explained more extensively.
Figure 8 – Organization Chart of relevant stakeholders
Customers of NS (9.4 million in total) use the services NS provides. The group of NS customers is very diverse: characteristics like age and travel frequency vary widely.
15
NS Reizigers (NSR, English: NS Travellers) is the department of NS concerned with travel and related subjects, like commerce, IT and finance.
NS Commercie (NSC, English: NS Commerce) is the department of NSR responsible for customer contact and commercial activities.
Portfolio Management & Innovatie (PMI), part of NSC, is responsible for generating new ideas that could improve services of NS, in line with strategy. They also check whether the idea is matching the goals of all stakeholders involved.
The Marketing department is also part of NSC and is concerned with selling products to customers: season tickets as well as non-recurring tickets.
Business Systemen (BS, English: Business Systems) is the IT department of NSC. It consists mainly of three sections: Verandermanagement (VM, English: change management), Realisatiemanagement (RM, English: realization management) and the Project Board. Their work can be described as follows:
VM is responsible for the translation of a concept or idea, which it receives from PMI and Marketing, into concrete impact analyses and fact sheets, which can then be developed by RM. It functions as the intermediary between business and IT. VM has commissioned this research and therefore it is marked in the organization chart of Figure 8.
RM translates deliverables from VM into concrete IT solutions. Those solutions are then developed, tested and launched.
16
3 RESEARCH
17
3
RESEARCH METHODOLOGY
The following section describes which methodology is used to carry out the research. First, an order is given in which the research questions will be answered. Then, of every research question is specified how it is going to be answered using this research.
3.1 DESIGN PROBLEMS AND KNOWLEDGE QUESTIONS
The goal of this research is to find out how personalization can be applied to the situation of NS. Research problems can be classified into two categories, according to Wieringa (2010): design problems and knowledge questions. Design problems call for an actual change in the situation: a design of that change is the solution to the problem, but there can be many solutions that would fit. Knowledge questions are about the world as it is now, they ask for knowledge about it. When doing design science, one can iterate between knowledge questions and design problems: knowledge questions lead to design problems and the other way around.
The first three research questions are knowledge questions:
RQ1. What is the effect of personalization on customer effort and what other effects does it have?
RQ2. What are the best ways to apply personalization?
RQ3. Which impact can personalization have on the IT of a company?
All are asking questions about the world as it is and do not call for a change in that world.
The last three research questions are largely design problems, although parts of those questions consist of answering knowledge questions:
RQ4. How and to which extent does personalization affect the customer effort of the online services of NS?
RQ5. How can NS best personalize its online services in order to reduce customer effort?
RQ6. Which changes in IT architecture and processes are needed to apply personalization on the online services of NS?
Those questions are not about the world as it is, or about knowledge that is currently present. Answers to those questions can be provided by designing a way for NS to personalize its online services, and validating that design. Wieringa (2010) states that with design science research, one can iterate over the two different problem types. This research will also do this, by first answering the first two questions with use of literature, then answering the last three questions by doing design science research, then answering the third question by generalizing the outcomes from the IT impact-part of the design science research. This can be graphically displayed as shown in Figure 9.
Figure 9 – High-level research methodology model
3.2 LITERATURE STUDY
The first two research questions will be answered by doing a literature study. This method is chosen because this research should build upon conclusions of previous researchers. Furthermore, reviewing literature is a very efficient method in comparison with interviewing experts about their opinions and conclusions, suitable for this research which has limited time available.
Knowledge Questions
RQ1&2
18
The literature study will be about two different subjects: the effects of personalization and the different ways in which personalization can be applied. The literature study is set up according to the five-stage grounded-theory method for reviewing literature by Wolfswinkel et al. (2013).
3.2.1 SOURCES
The study will be done using two search engines for the literature search: Scopus and Google Scholar. Both are widely used, general search engines with big databases. Scopus has indexed a broad range of scientific journals: over 19.000 can be searched via Scopus (Aghaei Chadegani et al., 2013). Google Scholar is even more broader than Scopus and is suitable for discovering academic and, sometimes, more popular literature (Howland, Wright, Rebecca, & Roberts, 2008). Using those two search engines complementarily is therefore a sound way of searching for literature in this research.
3.2.2 STEPS
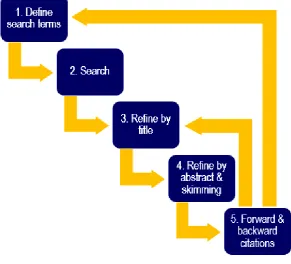
[image:31.595.152.444.373.637.2]Literature search is done in an iterative way, as is summarized in Figure 10. First, search terms are defined, as is shown in section 3.2.3. Then, the sources mentioned in section 3.2.1 will be searched. The studies found are read in different levels of depth. First, the search results are refined by title. If the title seems relevant, the abstract is read and the study is skimmed. If reading a paper shortly does not suffice and relevant detailed information seems to be available, the paper is read thoroughly. Found papers will be used to find more relevant papers in an iterative way. Using forward and backward citations, new search terms could be defined, after which the search process is repeated. Also, studying forward and backward citations could directly lead to new relevant papers, which are then refined based on the criteria mentioned before.
19
3.2.3 SEARCH TERMS
A selection of search terms was used to find relevant literature. There are general keywords that were used with every search, and keywords specifically about one of the two subjects. The general keywords were often combined with words from a specific category. An overview of used keywords can be found in Table 3.
General Effects (RQ1) Aspects (RQ2)
[image:32.595.72.532.137.381.2]Personaliz* Customiz* Personification Personal Segmentation Mass personalization Know Your Customer KYC Context-aware* Effects Customer effort Effort Reasons Satisfaction Usefulness User Goals Profit Revenue Marketing Increase Behavior Effectiveness Potential Customer Efficiency Loyalty Framework Levels Characteriz* How to Taxonomy Technolog* Classif* Perspective Categori* Application In practice
Table 3 – Keywords used in literature search
3.3 CASE STUDIES
To give a complete answer to the first two research questions, the results from the literature study are validated by speaking to employees from companies that apply personalization. Also, sources from the internet are studied in addition to the interviews. Using the case studies, the results from literature can be validated, to see if the theory is actually applied in the real world.
For this research, three cases are studied: firstly, a company that uses personalization to increase revenues, secondly, a company that uses personalization to increase their revenue and provides personal services to increase customer satisfaction, and thirdly, a company that is purely focused at customer satisfaction, uses personalization for that purpose and has no profit motive. The three cases are chosen based on an exploratory internet search as to which companies suit those descriptions. The three chosen companies are online retailer Wehkamp, health insurer Zilveren Kruis and the Dutch Government. All three organizations are applying personalization or are having plans to do so, but for various reasons.
3.4 DESIGN SCIENCE STUDY
20
The research objective of the design science study is formulated as follows, according to the format proposed by Wieringa (2013):
Improve the online services of NS
By tailoring them to customers’ personal needs Such that the customer effort is reduced
In order to increase customer satisfaction regarding the usage of those services
The DSRM is built up out of six steps, which can be carried out iteratively. The research can begin at multiple points. An overview of the steps can be seen in Figure 11.
Figure 11 – Design Science Research Methodology process (Peffers et al., 2008)
The reason for this research is the recognition of certain problems with online services of NS. Therefore, this research enters the DSRM in the first phase: Identify Problem & Motivate. The following steps will be taken to carry out the Design Science research:
Identify Problem & Motivate: through studying internal and external documents about the situation of NS and through talking with employees, a problem definition is composed. This also shows the importance of the design of an artifact.
Define Objectives of a Solution: based on the problem identification, objectives of a redesign effort are defined before the redesign can be made. These objectives indicate exactly what the redesign should aim to improve and are used in the evaluation phase to check whether the redesign does indeed satisfy the goals.
Design & Development: this is done by defining personalized authentication levels and redesigning two online services according to those. The redesign process is described in chapter 6 and the results of the redesign are described in chapter 7. This step shows how personalization can be applied at NS and therefore provides an answer to RQ5.
Demonstration and evaluation: the redesigned services are demonstrated by creating HTML mockups. This illustrates and further clarifies the answer to RQ5. Evaluation is done by asking twelve experts from NS about their opinions regarding the mockups and the estimated customer effort of the redesigned services. The Expert Opinion method defined by Wieringa (2010) is used to carry out this step of the DSRM. Evaluation of the demonstration leads to insight into the effects of the redesign on the reduction of customer effort. Together with background information about the goals of NS, this gives an answer to RQ4.
21
done by observation of the artifact’s effects on the environment, but by asking experts to estimate those effects, based on their knowledge.
Analyzing impact on IT: the redesigned services are analyzed to see what impact the redesign has on IT. Two aspects of IT impact are analyzed: the IT architecture and processes needed to facilitate the redesigned services. Both aspects are validated by talking to two experts of NS and two experts from outside NS, to see if the analysis is valid. This answers RQ6.
3.5 GENERALIZATION OF PERSONALIZATION IMPACT ON IT
A generalized overview of the impact of personalization on IT is created by synthesizing and integrating conclusions from the literature study, case studies and impact analysis of the design science study. The impact factors resulting from that integration are then generalized by searching for semi-scientific literature about those factors. The answer is validated by interviewing two experts of NS and two experts from outside NS. This will provide an answer to RQ3.
3.6 SUMMARY
To summarize how and where the research questions are answered, Table 4 gives an explanation.
# Question Problem type Answering method Chapter
1 What is the effect of personalization on customer effort and what other effects does it have?
Knowledge
question Literature study, case studies 4 2 What are the best ways to apply
personalization? Knowledge question Literature study, case studies 5 3 Which impact can personalization
have on the IT of a company? Knowledge question Synthesizing, integrating and generalizing research conclusions
10
4 How and to which extent does personalization affect the customer effort of the online services of NS?
Design problem, Knowledge question
Background study, validation
redesign 4, 8
5 How can NS best personalize its online services in order to reduce customer effort?
Design problem Redesign online services,
demonstration redesign 6, 7, 8 6 Which changes in IT architecture and
processes are needed to apply personalization on the online services of NS?
Design problem,
[image:34.595.75.527.296.543.2]knowledge question Impact analysis of redesign 9
22
4 EFFECTS OF
23
4
EFFECTS OF PERSONALIZATION
This chapter explores the question why companies would want to personalize products and services. Using the results of a literature study, an overview of the effects of personalization is given. Then, each of the effects is further examined. Finally, experiences of companies implementing personalization are used to validate the results from literature.
4.1 IDEAL TYPES OF PERSONALIZATION
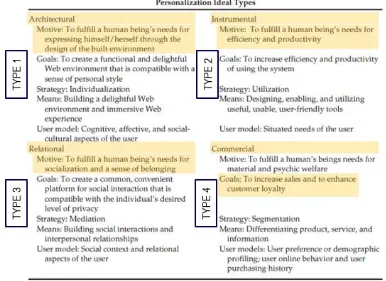
[image:36.595.108.494.245.526.2]Fan and Poole (2006) define four ideal types of the use of personalization. Each type has another motive, goal and strategy to achieve that goal. The four types are summarized in Figure 12. Annotations are made by the author of this thesis.
Figure 12 – Personalization Ideal Types (Fan & Poole, 2006), annotations made by author thesis
All four types seem to have “to fulfill a human being’s needs” as the primary motive. However, the commercial type, type 4, is different from the other three types because the company has the most benefit of personalizing with a commercial goal. The increased revenue is an incentive for the company to personalize. Thus, the motive, belonging to the commercial type, that is mentioned, “To fulfill a human’s beings needs for material and psychic welfare”, is not the primary motive. The primary motive of that personalization type is increase in revenue. The other three types are directed at the customers’ satisfaction, just as their motive suggests. Therefore, if the model of Fan and Poole is further summarized, two motives associated with personalization can be seen: customer satisfaction increase and company revenue increase. These were also the two primary motives found in literature and will be further explained in sections 4.2 and 4.3.
4.2 USER EXPERIENCE AND CUSTOMER SATISFACTION
24
did not match their personal characteristics, such as advertising for dating sites when somebody was married (Janrain, 2013).
If relevant content is displayed to users, they are more likely to engage in more activities with regard to the company, because they feel more understood and seen by the company. Personalized email marketing resulted in a 14 percent increase in click-through rate (Aberdeen Group, 2008). In an experiment with web surveys, the response rate was 8.6 percentage points higher when the survey was personalized (Heerwegh, Vanhove, Matthijs, & Loosveldt, 2005).
Also in the banking business, personalization is seen as something that can increase customer satisfaction (The Financial Brand, 2014). The better personalization is applied, the more customer satisfaction is increasing, as was shown in research about the accuracy of recommendations (Liang et al., 2007). Customers using a personalized website also perceive it as more useful (Liang et al., 2012).
When an interaction is personalized, the users feel more understood. This was already true in the analog age, when the shop around the corner was owned by somebody who knew his customers and had a good relationship with them (Mittal & Lassar, 1996). In the current digital age, this principle still remains: "Consumers will build a positive attitude when they feel the vendor cares for them and pays attention to their personal needs through the provision of customer services" (Liang et al., 2012). In a master thesis was concluded that “real personal attention” has a positive influence on customer loyalty at a Dutch wholesaler (van Es, 2012). Those positive emotions would also have a positive impact on the shopping behavior of customers (Pappas, Kourouthanassis, Giannakos, & Chrissikopoulos, 2014), which can increase the revenue of the company.
However, the positive effect of personalization on customer attitude and loyalty is contradicted by Dixon et al. (2010), which state that “delighting customers doesn’t build loyalty”. Because of different implicit definitions, it is not clear whether this statements really contradict or that the definitions are just confusing. Also, there exists confusion about the exact indicators of customer satisfaction. A lot of related terms are being used interchangeably, like customer satisfaction, happiness, loyalty and attitude.
Customer effort
A key factor in the customer experience is how much effort they have to make to receive a certain service or good. Zipf already stated in his famous Principle of Least Effort (Zipf, 1949) that people always try to find the way which involves the least effort to them: people choose their entire behavior based on the minimization of effort. Although Mahatma Gandhi said that “satisfaction lies in the effort”, current knowledge shows that satisfaction specifically occurs when there’s not too much effort involved.
Personalization can help reduce the effort customers have to make. Often, websites have an enormous amount of information to display and customers might be overloaded with that much information. Personalization works to reduce that information overload effect (Kosela, 2007) and therefore reduces the effort of users (Liang et al., 2007). The Customer Effort Score has proven to be a predictive metric for customer loyalty, which is “customers’ intention to keep doing business with the company, increase the amount they spend, or spread positive (and not negative) word of mouth” (Dixon et al., 2010).
4.3 REVENUE
25
“few have implemented a well-thought-out and tested approach” (Econsultancy, 2013). Defining accurate and relevant metrics, using those to measure the impact of personalization and improving the implementation based on those measures is vital in order for companies to see their revenue increase because of personalization.
An important factor in increasing revenue through personalization is the use of personalized recommendations, tailored to what the customer might be looking for. A supermarket that experimented with personalized recommendations, saw a 1.8% boost in revenue thanks to personalization (Lawrence, Almasi, Kotlyar, Viveros, & Duri, 2001). A survey by Baynote indicates that customers with personalized recommendations have a much higher conversion rate: up to 355% compared to customers without personalized recommendations (Baynote, 2013). RichRelevance, a company that specializes in recommendations as used by companies like Amazon, notes a 3-15 percent increase in revenue for customers that use personalized recommendations (Koetsier, 2013). Personalization helps to increase conversion rates and thus revenue, even in its more basic forms (Aberdeen Group, 2008). Even though some research is likely to be somewhat affected by the opinions of the organization carrying it out, the effect of personalization on revenue increase is clear.
Another factor that could be tailored is the price of the products a company is offering. If prices of airline tickets, for example, are customized, based on the characteristics of the customer, revenue could increase by more than 7 percent compared to the ideal price (X. Chen, Owen, Pixton, & Simchi-levi, 2015).
4.4 NEGATIVE EFFECTS
The effects of personalization can, however, also be negative and could decrease customer trust. When customers discover their data is used for personalization purposes without their consent, they might feel exposed and threatened by the company delivering the service. Instead of a higher click-through rate and customer satisfaction, customers click through less and are less satisfied with the service because of this violation of their privacy. This is called the personalization paradox (Aguirre, Mahr, Grewal, de Ruyter, & Wetzels, 2015). Companies can prevent this negative effect from happening by being clear about the usage of personal data for personalization purposes: overt instead of covert personalization (Aguirre et al., 2015; Lee & Cranage, 2011). This increases the trust of customers, which influences their perception of advertisements, especially the personalized ones (Bleier & Eisenbeiss, 2015).
4.5 EXPERIENCES FROM PRACTICE
Results from the literature study can be applied by looking at companies that apply personalization. Companies actively applying personalization do this for various reasons. Some companies are trying to sell as much as they can to customers and will use personalization to offer them the most relevant product offerings as possible. Other companies are not profit-oriented and want to make sure their customers are as satisfied as possible about their services, which they can personalize in various ways. The third category of companies combines both and focuses on a combination of service and sales. NS falls into this last category. From each of the three categories, one case was explored by conducting an interview or doing online research.
4.5.1 WEHKAMP
An interview was conducted with a data scientist of Wehkamp, which is one of the largest online retailers in the Netherlands. On their web site, personalization is widely applied, in order to have a better alignment with the customers’ wishes and desires. Customer experience is improved by adding personalized content based on data and algorithms. Revenue increase through increased conversion rates is an important goal with regard to personalization. Negative effects were experienced when Wehkamp was considering personalizing product prices, which reduced customer trust. Therefore, those plans were not executed.
26
4.5.2 ZILVEREN KRUIS
Zilveren Kruis is a Dutch insurance company which has a combination of sales and service and applies personalization mainly in their online channel. An interview was conducted with a web analist of Zilveren Kruis. Personalization is done in order to generate extra revenue by trying to convince customers to sign up for their insurance. Also, it is done to decrease service costs. Increasing revenue is especially important in the final quarter of each year, in which customers can change their insurance. A lot of attention is paid to getting ‘switchers’ to transfer to Zilveren Kruis. Decreasing service costs is done, for example, by the reduction of waste calls to their help desk. Customer satisfaction is important because of its effects on sales and service.
4.5.3 DUTCH GOVERNMENT
For studying a case at which personalization is used solely for the benefits of user satisfaction, the Dutch digital government is chosen, as is described at http://www.digitaleoverheid.nl. This program aims to digitalize all governmental services by the end of 2017. As can be seen on their website, revenue increase or customer conversion aspects play no role in the application of personalization (Dutch Government, 2015). The government states that one of their key goals is to improve the accessibility, security and trustworthiness of the services, which have a positive impact on customer satisfaction. Also, digitalization of services will lead to cost efficiency.
4.5.4 COMPARING THEORY AND PRACTICE
When the results of the literature study are compared with the case studies documented in the previous sections, a number of conclusions can be drawn.
An overview of the effects found in case studies is given in Table 5. The literature study showed two primary objectives of applying personalization, customer satisfaction increase and revenue increase. However, when interviewing an employee from Zilveren Kruis and when looking at case material from the Dutch government, a third objective came to light which was barely addressed in literature: cost efficiency. Personalization can be used to direct customers to cheaper channels or to give customers more relevant information, so that less direct contact is needed between them and the company. Eventually, cost efficiency leads to an increase in profit, just like the increase of revenue generally does.
Wehkamp Zilveren Kruis Dutch Government
Customer satisfaction increase X X X
Revenue increase X X
Cost efficiency increase X X X
Customer trust decrease X
Table 5 – Personalization effects found in case studies
In all three cases, customer satisfaction was mentioned as a goal of personalization. However, this goal was often connected to the increase of profit. Customer satisfaction is not always a goal in itself, it can also be used as a means to other goals.
The possible negative effects of personalization were only mentioned by Wehkamp. The absence of this effect in the findings could be because companies are responsibly applying personalization, so that customer trust is not decreasing. However, a more probable explanation is that customers do not indicate their decrease in trust and companies do not directly ask customers if their trust decreases. Companies generally only see the positive side of personalization and are not very focused on possible negative side effects, as can be seen in several reports about personalization (Baynote, 2013; Forrester Consulting, 2013; Koetsier, 2013; McKinsey, 2014).