2017
Applying Intelligence
Amplification to the
problem of Schema
Matching
MASTER THESIS BUSINESS AND IT
JOHAN BUIS (S0166308)
Graduation committee:
University of Twente: M.E. Iacob
i
Acknowledgement
This thesis is the final product of my student career. It was an interesting thesis to write with an even more interesting problem at its centre. This meant learning a lot of new concepts which made it a challenging task. However, putting all my thoughts on paper proved to be the toughest part. It was at those times the Instant Gratification Monkey took control of the steering wheel. For those who never heard of this friendly monkey I recommend looking him up on YouTube. Seriously, watch that TED talk. I would like to thank Maria, Marten and Andrej for their great support throughout the process. You’ve always provided helpful feedback which helped me to further write this thesis. Lucas, thanks for your daily support helping me to point me to the right directions.
I would also like to thank all my colleagues at eMagiz and CAPE Groep. And thanks Rob for giving me the opportunity to write my thesis at CAPE. I am looking forward starting my job at CAPE after my upcoming holiday.
Finally, I want to thank my family friends and everyone who helped me through this. It wasn’t always easy but I’m glad I can finish my studies.
Johan Buis
ii
Abstract
A task often occurring at CAPE Groep is the task of schema matching. Schema matching is the problem of finding pairs of attributes (or groups of attributes) from a source schema and attributes of a target schema such that pairs are likely to be related. At present, this time-consuming task is done manually. This thesis explores the possibilities for partially automating this process thus saving time and, eventually, money.
Fully automating the task of schema matching has proved to be difficult. We therefore apply the concept of Intelligence Amplification to the problem of schema matching. Intelligence Amplification is a field which focuses on a symbiotic relationship between human and machine. A clear definition is currently lacking in literature and after assessing extracting key features we created our own definition: “Intelligence Amplification focusses on a close collaboration, with complementary contributions, between human and machine to empower humans in the decision-making process”.
For the problem of schema matching we found two major moments where interaction between humans and machine occur: during the stage of pre-processing and during the matching stage. Pre-processing happens at the begin of a matching scenario. Steps included in pre-Pre-processing include expanding abbreviations or translation of attribute names. In the matching stage, a machine calculates a set of candidate mappings. In our IA driven approach, the user can opt to invoke several software agents, either get better results or to have a different software agent for a subset of the matching scenario.
A reference architecture was developed to aid in development of such tools. Using this reference architecture, we developed our own prototype. This prototype contained a machine learning approach. We trained a neural network to predict candidate mappings. Evaluation of this method has showed there is still room for improvement as for some scenarios the neural network was not able to generate any candidate mappings.
Evaluation of the prototype was done using two metrics: effectiveness and efficiency. For effectiveness we look at precision and recall. Precision is a metric for the quality of results. It indicates the percentage of correct predictions that were made by the machine as part of the total amount of predictions made. Recall tells something about the completeness of results. It indicates how many correct predictions were made as part of the total amount of correct predictions which should be made.
The second evaluation criteria, efficiency, is looking at the time aspect. First a baseline is established. In our case this is the time it takes a user to manually complete a matching scenario. When using an automated approach, we again look at the total time it takes to complete a scenario and compare this against the baseline. Using this feature a performance improvement score is calculated.
iii
Contents
Acknowledgement ... i
Abstract ...ii
1 Introduction ... 1
1.1 Context ... 1
1.2 Problem statement ... 1
1.3 Relevance ... 2
1.4 Research model ... 2
1.5 Research Questions ... 3
1.6 Methodology ... 4
1.7 Document outline ... 5
2 Literature ... 6
2.1 Intelligence Amplification ... 6
2.1.1 Questions and selection process ... 6
2.1.2 IA definitions... 7
2.1.3 Task delegation ... 9
2.1.4 Human machine collaboration ... 10
2.2 Machine learning ... 12
2.3 Database schema matching ... 15
2.3.1 Questions and selection process ... 15
2.3.2 Techniques... 16
2.3.3 Similarity measures ... 17
2.3.4 Schema matching approaches... 18
2.4 Summary... 20
3 Reference architecture ... 21
3.1 Introduction ... 21
3.2 Approach ... 21
3.3 Pre-processing ... 21
3.4 Matching ... 23
3.5 Summary... 25
4 Prototype ... 28
4.1 Architecture ... 28
4.2 Machine learning platform ... 30
4.3 Training set ... 32
4.4 Anomaly detection model performance ... 33
iv
4.6 Prototype ... 34
5 Prototype evaluation ... 38
5.1 Evaluation criteria ... 38
5.1.1 Measuring effectiveness... 38
5.1.2 Measuring efficiency ... 38
5.2 Evaluation ... 39
5.2.1 Scenario 1 ... 40
5.2.2 Scenario 2 ... 40
5.2.3 Scenario 3 ... 40
5.2.4 Scenario 4 ... 40
5.2.5 Discussion of results ... 41
5.3 Improvements ... 43
5.3.1 Entity mapping ... 43
5.3.2 Further pre-processing steps ... 43
5.3.3 Hybrid matchers ... 44
5.3.4 Further graphical support ... 44
6 Conclusion ... 45
6.1 Intelligence Amplification ... 45
6.2 Schema matching ... 45
6.3 General architecture ... 46
6.4 Prototype and evaluation ... 47
6.5 Main research question ... 48
6.6 Limitations ... 48
6.7 Future work ... 49
6.8 Recommendations for CAPE ... 49
7 References ... 50
1
1
Introduction
This section starts with the context in section 1.1 followed by the problem statement in section 1.2. Next, the relevance of the project is discussed in section 1.3. This is followed by a research model which is discussed in section 1.4 and the research questions which are addressed in section 1.5. Section 1.6 provides the methodology and section 1.7 gives an outline of the rest of the thesis.
1.1
Context
The early days of automation started with the objective of looking which tasks could best be replaced by computers because the computer could do it better or against lower cost (Casini, Depree, Suri, Bradshaw, & Nieten, 2015). One of the research fields seeking to achieve this objective is the field of Artificial Intelligence (AI) (Fischer, 1995). This is now a well-established field and a lot of research effort has been put in it. However, the focus of AI is to replace human reasoning which is not always possible (Garcia, 2010). This stands in contrast to Intelligence Amplification (IA) which does not aim to replace a human but amplify the human intelligence (Breemen, Farkas, & Sarbo, 2011). This is a different view in which the point is not to assess which tasks are better suitable to be undertaken by a human or a computer, but to see how tasks can best be shared by both humans and computers (Casini et al., 2015). This is the concept of symbiosis and the roots of it can be traced back to Licklider (1960). In his paper, he discusses the symbiosis between human and machine. As example of a symbiosis Licklider (1960) cites the fig tree which is pollinated by a larva. This larva lives in the ovary of the tree on which it eats. Thus, the two form a productive and thriving partnership.
Even though the concept is more than 50 years old it hasn’t been entirely realized today (Cerf, 2013). However, this could be contributed to recent advances in in computer technology and psychological theory which make the subject possible (Griffith & Greitzer, 2007). In this thesis, we take the concept of Intelligence Amplification and apply it to the problem of schema matching which is introduced in the next section.
1.2
Problem statement
Schema matching is a basic problem in many database applications, such as data integration, data warehousing and semantic query processing (Rahm & Bernstein, 2001). It aims at identifying semantic correspondences between metadata structure or models, such as database schemas or XML message formats (Rahm, 2011). Often this process is carried out manually costing a lot of time and user effort (Rahm & Bernstein, 2001). It is an inherently difficult task to automate because the exact semantics of the data are only completely understood by the designers of the schema, and not fully captured by the schema itself (Madhavan, Bernstein, Doan, & Halevy, 2005).
CAPE Groep offers eMagiz to integrate various software applications. eMagiz makes this process easy and intuitive by offering a graphical user interface which makes the product suitable to be used without extensive programming knowledge. Each implementation of eMagiz starts with the design of the internal data model which is referred to as a Canonical Data Model (CDM). Applications can be connected to the CDM thus creating a hub-and-spoke architecture (Weske, 2012).
2 Figure 1: Example mapping in eMagiz
Each line represents a mapping between the two schemas. On the left we find the source schema which needs to be mapped to the destination schema on the right. To enhance this process a schema matcher would be useful. Research into schema matching mostly focusses on systems which are capable of proposing possible matching without human involvement (Rahm & Bernstein, 2001). Many approaches make wrong choices which could have a cascade effect and lead to further errors (Jimenez-Ruiz, Grau, Zhou, & Horrocks, 2012). When accuracy is important user intervention during the matching process becomes essential and earlier research indicate this intervention could significantly improve matching result (Jimenez-Ruiz et al., 2012) This symbiosis between tool and user has been gaining more prominence but research in this area is still in its infancy (Falconer & Noy, 2011; Rahm, 2011; Rodrigues, da Silva, Rodrigues, & dos Santos, 2015).
In this thesis, we aim to create a symbiotic method between tool and human for schema matching. This approach is uncommon in science and gives a CAPE Groep a possibility to reduce time consultants need to perform the task of schema matching. This main research goal is to develop a reference architecture for using the concepts of Intelligence Amplification and database schema matching which should aid in the task of matching.
1.3
Relevance
The project has both scientific and practical relevance. First, we will look in literature and assess the current state-of-art in Intelligence Amplification research. This will be combined with knowledge from schema matching to deliver a framework for an IA driven approach for schema matching.
Practical relevance is for CAPE Groep for which we develop a functional prototype which should partially automate the schema matching process thus leading to a time reduction needed for consultants performing the task.
1.4
Research model
3 Figure 2: Research model
The main goal of the thesis is shown on the right. This is to have an evaluated IA approach for schema matching. To achieve this a IA driven approach to schema matching is created and a prototype. The IA driven approach is split in two tasks, namely features of IA on task delegation. The latter is split in literature concerning Intelligence Amplification and task delegation. Next, a closer look is taken at schema matching. We are curiosity driven to look for a solution involving machine learning. Also, a look is taken at different approaches and similarity measures. These are measures indicating how similar two text string are which are further discusses in section 2.
To create a prototype, we used the IA driven approach defined above. We use the data set at CAPE for machine learning. To evaluate our approach, we look for performance metrics, these are split in metrics for machine learning and user evaluation.
Colour coding is used to link the tasks to the research questions defined in the next section.
1.5
Research Questions
Based on the problem statement and research model we formulate the following main research question:
How can we combine the concept of Intelligence Amplification with database schema matching to create a reference architecture for IA driven schema
matching?
To answer this question several sub-questions are formulated. First, we focus on Intelligence Amplification. We start with a literature review to assess the current- state-of-art. At present, there is no universally accepted definition. Therefore, a literature study is conducted to find various definitions and highlight the difference.
1a. Which definitions exist in literature?
1b.What is the current state-of-art in Intelligence Amplification research? 1c. How does IA affect the delegation of tasks between human and machine?
Evaluated IA approach for schema matching IA driven architecture
for schema matching Features of IA on task
delegation Intelligence
Amplification Literature
Task delegation
Schema matching Similarity measures
Machine learning
Other approaches
Prototype Performance evaluation
metrics Machine learning
evaluation metric
User evaluation metric
4 Our next step is related to the task for which we will try to build a solution, namely database schema matching. We would like to use machine learning for this purpose so therefore we provide a general introduction. Before we can use the data for machine learning we look which possibilities have been identified in literature for performing schema matching using machine learning. These questions deal with the data currently present and how to prepare it for extraction by a machine learning algorithm.
2a. Which solutions for schema matching have been proposed in literature?
2b. Which pre-processing steps are needed to prepare data for schema matching?
2c. Which issues has literature identified in database schema matching?
2d. Which machine learnings algorithms are available?
Using the knowledge from the first two research question we describe a general architecture which describes how we can create an IA driven approach for schema matching.
3a. How to design an IA driven approach and architecture for schema matching? 3b.In which stages do we include the user in the approach?
We then use our general approach to develop a prototype. The prototype is implemented and evaluated.
4a. Which parts of the architecture will we use to build a first concrete architecture?
4b.Which data is available at CAPE?
4c. Which machine learning algorithm produces the best result?
4d.Which metrics can we use to measure performance?
4e. Which improvements to the initial implementation can be made?
1.6
Methodology
To structure the report we use the Design Science Research Model which is displayed in figure 3 (Peffers, Tuunanen, Rothenberger, & Chatterjee, 2008).
Figure 3: DSRM process model (Peffers et al., 2008)
The model consists of the following steps:
5
• Define the objectives and solution: from the problem identification and motivation the objectives for a solution are inferred. This looks at what is possible and feasible. This is covered in research question 1 and 2.
• Design and develop: in this stage, an artefact is developed. This start by determining its desired functionalities and architecture. Initially we derive a general approach discussed in question 3. Next out prototype is created in question 4a-c.
• Demonstration and evaluation: a demonstration shows the artefact in a single act to prove it works. A more formal method is an evaluation. This is covered in research question 4d-e.
• Communication: the last step consists of communicating the outcome to relevant stakeholders. In this case, this would be the final report and presentation which are covered with all research questions.
1.7
Document outline
6
2
Literature
This chapter describes the literature search. First, we discuss literature around the topic of intelligence amplification in section 2.1. Next is an overall introduction to the concept of machine learning in section 2.2. This is followed by a literature section about the topic schema matching in section 2.3. The chapter is concluded with a summary in section 2.4.
2.1
Intelligence Amplification
The topic of the first part of the literature search is Intelligence Amplification.
2.1.1
Questions and selection process
We define the following questions:
• Which definitions of IA related exist in literature?
• Is there a suitable task delegation which can be applied in IA?
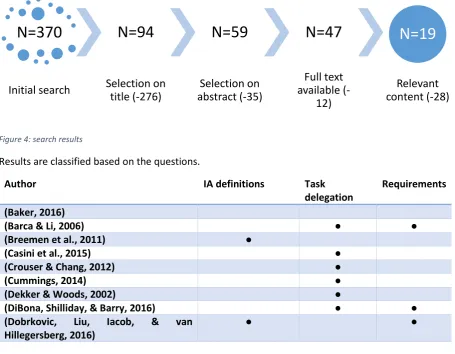
[image:11.595.72.528.429.783.2]• Has literature identified requirements or frameworks for human-machine collaboration? For the search process Scopus is used. Scopus provides many options for searches and has one of the biggest databases on scientific literature. For articles for which the full text was not available a search on Google Scholar was conducted. The search was conducted in February 2017 and the following five keywords were used: "intelligence amplification", "cognitive augment*", intelligence augment* OR "augment* intelligence ", "*man computer symbiosis" OR "*man machine symbiosis" and "*man computer collaboration" OR "*man machine collaboration". The search yielded 370 results which were first narrowed down on title, next on abstract, next on the availability of the full text article and finally the article was read. An overview of the result set can be found in figure 4.
Figure 4: search results
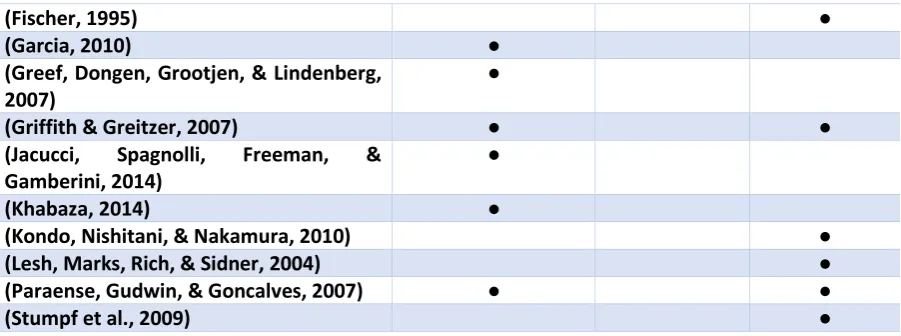
Results are classified based on the questions.
Author IA definitions Task
delegation
Requirements
(Baker, 2016)
(Barca & Li, 2006) ● ●
(Breemen et al., 2011) ●
(Casini et al., 2015) ●
(Crouser & Chang, 2012) ●
(Cummings, 2014) ●
(Dekker & Woods, 2002) ●
(DiBona, Shilliday, & Barry, 2016) ● ●
7
(Fischer, 1995) ●
(Garcia, 2010) ●
(Greef, Dongen, Grootjen, & Lindenberg, 2007)
●
(Griffith & Greitzer, 2007) ● ●
(Jacucci, Spagnolli, Freeman, & Gamberini, 2014)
●
(Khabaza, 2014) ●
(Kondo, Nishitani, & Nakamura, 2010) ●
(Lesh, Marks, Rich, & Sidner, 2004) ●
(Paraense, Gudwin, & Goncalves, 2007) ● ●
(Stumpf et al., 2009) ●
2.1.2
IA definitions
[image:12.595.74.525.69.237.2]In the previous chapter we introduced IA as the symbiosis between humans and machines. At present no universal definition exists. We analyse the papers and highlight which definitions is used. These definitions are presented in table 1.
Table 1: Overview of definitions
Author What Definition
(Breemen et al., 2011)
IA IA is a field of research aiming at increasing the capability of a man to approach a complex problem situation, to gain comprehension to suit his particular needs, and to derive solutions to problems. (Garcia,
2010)
IA Artificial intelligence (…) working in partnership with people to reach rationally superior solutions by helping them better explore the solution space.
(Dobrkovic et al., 2016)
IA Enhance human decision-making abilities through a symbiotic relationship between a human and an intelligent agent.
(Greef et al., 2007)
Augmented Cognition
The symbolic integration of man and machines in a closed-loop system whereby the operator’s cognitive state and the operational context are to be detected by the system. In this integration, there is a dynamic division of labour between human and machine which can be reallocated in real-time in order to optimize performance. (Griffith & Greitzer, 2007) Human information interaction
A new vision of symbiosis – one that embraces the concept of mutually supportive systems, but with the human in a leadership position, and that exploits the advances in computational technology and the field of human factors/cognitive engineering to yield a level of human-machine collaboration and communication that was envisioned by Licklider, yet not attained.
(Jacucci et al., 2014)
Symbiotic interaction
A new generation of resources to understand users and to make themselves understandable to users
(Khabaza, 2014)
IA Intelligence Amplification refers to the idea that the products of Artificial Intelligence will be used initially, not to create fully intelligent machines, but to amplify or increase the power of human intelligence.
(Paraense et al., 2007)
IA System Computational systems performing some sort of intelligent decision making based on the cooperation provided by an ongoing dialogue between a human user and a computer system.
8 making, problem solving, partnership/collaboration or symbiosis and human empowerment. We list these feature in table 2.
Table 2: Comparing features Artificial Intelligence Decision making Problem solving Partnership/ collaboration Empowering human (Breemen et
al., 2011) ● ●
(Garcia, 2010) ● ● ● ●
(Dobrkovic et
al., 2016) ● ● ●
(Greef et al.,
2007) ● ●
(Greef et al.,
2007) ● ●
(Griffith &
Greitzer, 2007) ●
(Jacucci et al.,
2014) ●
(Khabaza,
2014) ● ●
(Paraense et
al., 2007) ● ●
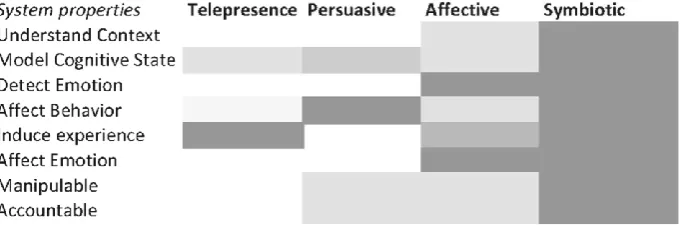
We first take a closer look what symbiosis between humans and machines entails. Jacucci et al. (2014) looked at different paradigms related to symbiotic collaboration. For this purpose, three different frameworks were discussed, namely that of telepresence, affective computing and persuasive technologies. Telepresence is the research about the subjective experience of being in an environment that is mainly supported by digital resources. Affective computing refers to computing that relates to, arises from, or deliberately influences emotions. Lastly, persuasive technologies deals with the persuasive power a computer possess to persuade a human to undertake action. A symbiotic relationship draws upon all these frameworks. A comparison between system properties of each framework and how they relate to a symbiotic relationship is shown in figure 5. The ‘greyer’ a box the more a property applies to said feature.
Figure 5: Comparing system features for several frameworks (Jacucci et al., 2014)
[image:13.595.75.417.547.663.2]problem-9 solving ability. The same applies to empowerment of humans. Griffith & Greitzer (2007) keep their definition at a more abstract level by only focusing on a partnership; they do not indicate what this partnership can be used for.
Next, we group the five features by their function. We consider decision making and problem solving as a goal. Artificial intelligence and partnership are considered as means to achieve the goal. Finally, human empowerment is seen as raison d’être of Intelligence Amplification. Concluding the above we use the following definition for IA in this thesis:
Intelligence Amplification focusses on a close collaboration, with complementary contributions, between human and machine to empower humans in the
decision-making process.
2.1.3
Task delegation
A first attempt to distinguish tasks which are suitable for humans or machines was made in 1951 by Paul Fitts and are known as the Fitts’ lists (Casini et al., 2015; Cummings, 2014). This list is considered out-of-date (Crouser & Chang, 2012) and behind it is a false idea that humans and computers each have strengths and weaknesses whereby human weaknesses are eliminated or compensated by machines (Dekker & Woods, 2002). The list might suggest humans and machines are antithetical, however they are better seen as complementary (Crouser & Chang, 2012).
Instead, automation creates new human strengths and weaknesses (Dekker & Woods, 2002). Failing to take this into account could lead to a situation where an engineer will envision the future in which
only the predicted consequences will occur (Dekker & Woods, 2002). An update to the Fitts list has been proposed dubbed the “un-Fitts list” (Casini et al., 2015). This list is presented in table 3.
Table 3: The “Un-Fitts” list (Hoffman et al., 2002)
Machines
Are constrained in that Need people to
Sensitivity to context is low and is ontology-limited
Keep them aligned to the context Sensitivity to change is low and recognition of
anomaly is ontology-limited
Keep them stable given the variability and change inherent in the world
Adaptability to change is low and is ontology-limited
Repair their ontologies They are not “aware” of the fact that the model
of the world is itself in the world
Keep the model aligned with the world
Humans
Are not limited in that Yet they create machines to Sensitivity to context is high and is knowledge-
and attention-driven
Help them stay informed of ongoing events Sensitivity to change is high and is driven by the
recognition of anomaly
Help them align and repair their perceptions because they rely on mediated stimuli
Adaptability to change is high and is goal-driven
Affect positive change following situation change They are aware of the fact that the model of
the world is itself in the world
10 Strengths of humans are creativity (DiBona et al., 2016), self-reflection and the ability to perform a variety of tasks (Barca & Li, 2006). Machines can be designed to perform a specific task, can easily be replaced and can perform non-stop routines (Barca & Li, 2006).
Automation does not transform technology and the people who adapt; human practice get transformed as they adapt technology to fit their local demands and constraints (Dekker & Woods, 2002). Allocation of task should not be the focus, design for harmonious human-machine cooperation should be (Crouser & Chang, 2012).
A solution to task delegation is provided by Crouser & Chang (2012) by looking at affordances. An affordance is defined as action possibilities that are readily perceivable by a human operator. Affordances are relational and exists between human and machine; they do not exist separate form that relationship. They suggest a non-exhaustive list of human and machine affordances which we list in table 4.
Table 4: human and machine affordances (Crouser & Chang, 2012)
Human affordances Machines affordances
Visual perception Large-scale data manipulation
Visuospatial thinking Collecting and storing large amounts of data Audio linguistic ability Efficient data movement
Sociocultural awareness Bias-free analysis Creativity
Domain knowledge
Visuospatial thinking is our ability to visualize and reason about the spatial relationships of objects in an image.
2.1.4
Human machine collaboration
The key to automation is to turn systems into team players (Dekker & Woods, 2002). Effective collaboration between humans and machines is essential to become team players. Or, as put by Griffith & Greitzer (2007), the goal is to create a neo-symbiotic interaction between the human and information. This raises the question what is required to achieve this goal.
Casini et al. (2015) list four requirements which are observability, directability, predictability and learning. Observability concerns our ability to understand and evaluate what is currently happening whereas directability is our ability to implement our goals for what we want to happen in the future. The latter two are closely related to each other and indicate (partial) results should be predictable and we should be able to learn from them. A lack of observability can lead to high complexity and undesirable machine behaviour (Greef et al., 2007). Next Casini et al. (2015) list three different intervention forms for collaboration between humans and machines. In the first situation, the system can ask the human operator for clarification. Secondly, a human can perform a random inspection and finally a human can perform a drill-down. In the last situation, a human is curious what led the machine to make a certain decision and he can inspect the processing chain which led to a specific assertion and conclusion.
Kondo et al. (2010) discusses a human machine collaboration in a kitchen for recognizing objects. Three assumptions are made:
1. the system should be able to uniquely a target object in good condition 2. the user can improve the conditions
11 After testing a prototype, they indicate the key concept is to provide information feedback consisting of recognition status and suggestions for improvement.
Another list of requirements for collaboration is proposed by Dobrkovic et al. (2016): • The human entity is given the master role, and it oversees the artificial intelligence, • The artificial intelligence is given the assistant role,
• The human is responsible for the strategic decision making, • AI is responsible for the tactical/operational tasks,
• The human is also responsible for the creative tasks that AI cannot handle,
• The AI is pre-processing the data, and brings awareness to the human component, • The AI acts upon meta instruction given by the human,
• The AI analyses the human output in context using the available input, and learns to recognize and adapt to the human’s behaviour,
• Depending on the level of autonomy of the AI, the machine will either automatically complete all computational tasks that conform with the strategic goals set by the human, or will suggest a solution for the human to verify, executing only the tasks that the human has approved, • If the AI neither can understand the input, nor can process the task, it will ask for human
assistance,
• The human can overrule the AI.
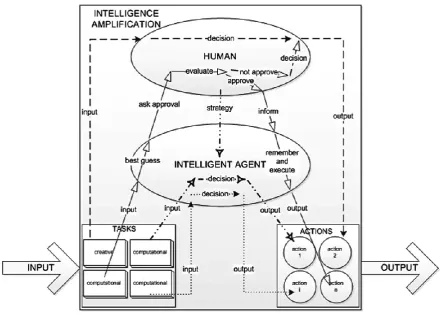
[image:16.595.78.522.378.693.2]Using these requirements a hierarchical organization overview is created which we present in figure 6.
Figure 6: hierarchical overview of intelligence amplification (Dobrkovic et al., 2016)
12 be seen as an offspring of the collaboration between the two of them. Whether or not the AI should be able to overrule the human is open for debate (Barca & Li, 2006).
DiBona et al. (2016) investigated how information can effectively be shared between humans and machines. For this purpose, they propose the Proactive Autonomy Collaboration Toolkit (PACT) model (figure 7). The model is constructed using four primary elements: goals, work product, context, and information. A human (referred to as analyst) starts with goals. Initially these are limited, but they will become clearer further in the process. These goals lead to hypothesis which are fed to the work product. The latter is the collaborative environment where the human and computer (referred to as autonomy) work together to test hypothesis. Eventually the fully realized hypothesis becomes the goal of the research. Important to the collaboration with the machine is context which consists of two aspects: the actions and decisions of the analyst, and the information itself. Information fed to the work product by the human helps the machine understand what interest a human has and can help suggesting which information is relevant. This information serves as evidence for a hypothesis.
Figure 7: PACT model (DiBona et al., 2016)
In order to effectively allow collaboration between humans and machines a common language is need (Fischer, 1995). This language requires a data representation of hypotheses a human want to test which should be readable by both the human and machine.
2.2
Machine learning
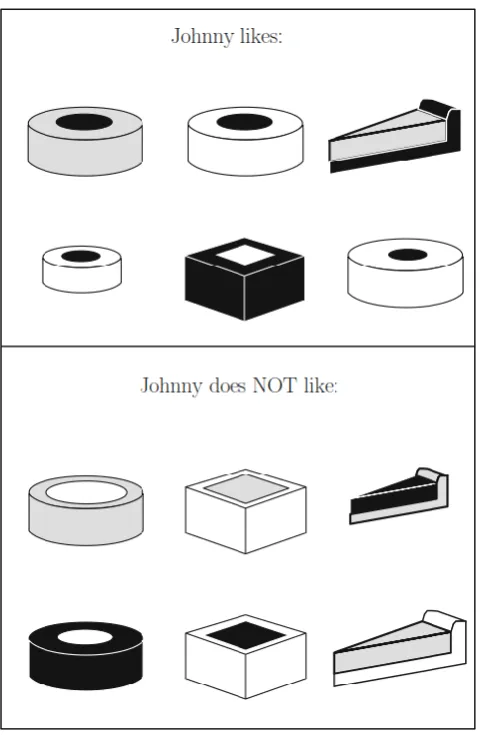
13 Figure 8: overview of pies Johnny likes and dislikes (Kubat, 2015)
[image:18.595.73.314.69.437.2]For the machine to be capable of recognizing the various pies we describe features (Kubat refers to this as attributes, however, we prefer the term features because in the rest of the thesis we use the term attribute for a different purpose). Examples of features are the shape (round, rectangular or triangle) or crust-size (thin or thick). Using these features, we create a table which describes the training examples, see table 5.
Table 5: Twelve training examples expressed in a table (Kubat, 2015)
Example Shape Curst - Size Curst - Shade Filling - Size Filling - Shade Class
Ex1 Circle Thick Gray Thick Dark Pos
Ex2 Circle Thick White Thick Dark Pos
Ex3 Triangle Thick Dark Thick Gray Pos
Ex4 Circle Thin White Thin Dark Pos
Ex5 Square Thick Dark Thin White Pos
Ex6 Circle Thick White Thin Dark Pos
Ex7 Circle Thick Gray Thick White Neg
Ex8 Square Thick White Thick Gray Neg
Ex9 Triangle Thin Gray Thin Dark Neg
Ex10 Circle Thick Dark Thick White Neg
Ex11 Square Thick White Thick Dark Neg
14 Many classifiers exist. We group them together and discuss the type of classifier below (Herrera et al., 2016; Witten, Frank, & Hall, 2011a):
Bayesian learning: methods that are based on Bayes Theorem. Most notable is NaiveBayes which assumes mutual independence between attributes. In practice this means all attributes make an equal contribution to the decision (Witten et al., 2011a). All though this assumption never holds in practice it turns out NaiveBayes can yield good performance (Herrera et al., 2016).
Instance Based Learning: sometimes known as lazy learners. These classifiers do no train or construct a model, but store all training data and compute distance measures between them. When a new attribute comes in the closest training example(s) is located and the outcomes are aggregated into a prediction.
Rule Induction: construct a set of rules to predict the outcome. Rules have the advantage they are very easy to understand by humans. The easiest to understand rule classifier is OneR. This uses one feature to construct rules. Even though this is a very rudimentary approach it comes up with quite good results for characterizing the structure in data (Witten et al., 2011a).
Decision trees: this group also provides models which are easy to interpret by humans. Decision trees are constructed by making multiple divisions at nodes and ending up at a leaf node. The leaf node provides the prediction (Herrera et al., 2016). Decision trees compare well to rules but there are differences. In a multi-class case a decision tree split takes all classes into account in trying to maximize the purity of the split whereas a rule-generating method concentrates on one class at a time, disregarding what happens to other classes (Witten et al., 2011a).
Logistic regression: uses numeric attributes to construct classifiers. However, nominal attributes can be used as well. Logistic regression builds a linear model based on a transformed target variable. Support vector machines: a more recent category of classifiers. They construct a hyperplane such that a maximal separation is achieved between the classes. This has the advantage they are not prone to overfitting.
Neural network: the working of our brain inspires these methods, or, more specifically the working of the neurons. An artificial neuron receives many weighted inputs and provide one aggregated outcome. A neural network has at least an input and output layer and between are hidden layers. This makes it possible to model complex data.
To train a classifier a training set is used. After the classifier is trained we want to get an idea how it will perform. There are two different approaches for doing so. First, we split the data in a training set and a test set. As the names imply we use the train set to train the classifier, subsequently the classifier then scores the instances in the test set. By comparing the outcome of the classifier in the test by the outcome of the ground truth contained in the test set we get an idea of its performance. The other option is to use k-fold cross validation. This method is better suitable when limited training data is available. This is not the case in our thesis, therefore we omit a further explanation and we refer the keen reader to Witten et al. (2011b)
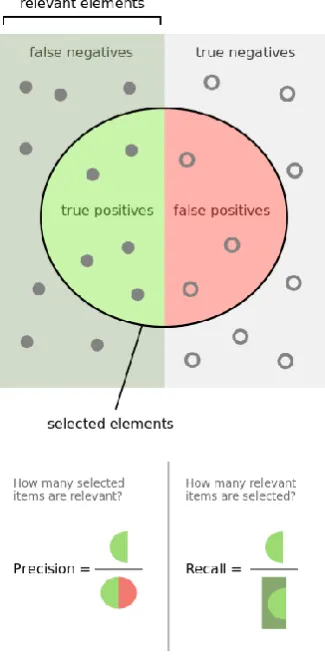
15 ones. A graphical overview of is displayed in figure 9. Finally, the measure is the harmonic mean of precision and recall and can be calculated as follows:
[image:20.595.84.247.153.485.2]𝐹 = 2 ∗𝑝𝑟𝑒𝑐𝑖𝑠𝑖𝑜𝑛 ∗ 𝑟𝑒𝑐𝑎𝑙𝑙 𝑝𝑟𝑒𝑐𝑖𝑠𝑖𝑜𝑛 + 𝑟𝑒𝑐𝑎𝑙𝑙
Figure 9: graphical overview of precision and recall (Wikipedia, 2017)
A popular tool for performing machine learning and one that is often used in scientific publications is Weka (Duchateau & Bellahsene, 2016). Weka provides a number of different classifiers which can easily be trained without programming experience (Witten, Frank, & Hall, 2011c).
2.3
Database schema matching
The second part of our literature study focusses on the concept of database schema matching.
2.3.1
Questions and selection process
During the literature search we want to answer the following questions:
• What techniques for schema matching have been proposed?
• Which similarity measures are available?
• Which approaches for schema matching have been proposed?
16 matching" AND "machine learning"). After we read the documents we retrieved additional documents by using a forward and backward search on the relevant articles. This yielded a set of 8 relevant documents. The search process is displayed in figure 10.
Figure 10: Overview of literature search
2.3.2
Techniques
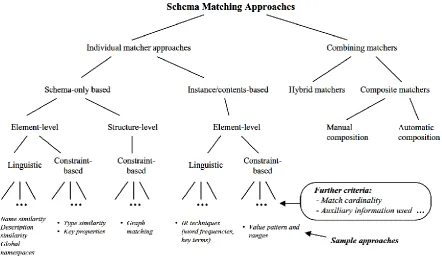
Schema matching is the problem of finding pairs of attributes (or groups of attributes) from a source schema and attributes of a target schema such that pairs are likely to be related (Assoudi & Lounis, 2015). It is a basic problem which can be found in many application domains (Rahm & Bernstein, 2001). A schema is a set of elements connected by some structure. For schema matching many approaches are possible and a taxonomy is provided by Rahm & Bernstein (2001) which we present in figure 11.
Figure 11: Taxonomy for schema matching approaches (Rahm & Bernstein, 2001)
At first a distinction is made between individual and combining matchers. The latter uses multiple individual matchers to get to its final result. An individual matcher computes a mapping based on a single matching criterion. A hybrid matcher uses multiple criteria to create a match whereas a composite matcher combines multiple results to create its final match. The taxonomy of the individual matchers makes the following splits (Rahm & Bernstein, 2001):
N=45
Initial search
N=20
Selection on title (-25)
N=19
Selection on abstract (-1)
N=18
Full text available (-1)
N=5
Relevant content (-13)
N=8
Back- and forward search (+3)
N=8
17
• Schema vs. instance based: the first case only takes the schema information is into account whereas the latter also uses instance data.
• Element vs. structure matching: element matching uses individual schema elements such as attributes; structure matching is performed for combinations of elements.
• Language vs constraint: a matcher can use a linguistic- based approach (e.g., based on names and textual descriptions of schema elements) or a constraint-based approach (e.g., based on keys and relationships).
• Matching cardinality: the overall match result may relate one or more elements of one schema to one or more elements of the other, yielding four cases: 1:1, 1:n, n:1 and n:m. In addition, each mapping element may interrelate one or more elements of the two schemas. Furthermore, there may be different match cardinalities at the instance level.
• Auxiliary information: a matcher could use auxiliary information such as dictionaries, global schemas, previous matching decisions and user input.
2.3.3
Similarity measures
In section 2.2 we discussed the need for features when performing machine learning. For schema matching these features are similarity measures. A similarity measure takes strings requires as input and the output is an integer describing the similarity. Similarity measures are bundled in the Second String project (Cohen, Ravikumar, & Fienberg, 2003). Several methods exist which we discuss briefly. The first category of methods are edit distance functions. A distance function maps a string s to a string
t by calculating a real number r. A low value of r indicates high similarity. This stand in contrast to a similarity function for which a high value of r indicates a high similarity. We make a further distinction between edit distance functions and token based functions.
Edit based distance functions
The most well-known edit distance is the Levenshtein distance. Levenshtein counts the amount of edit operations needed to convert string s into string t. An edit operation is a character insertion, deletion or substitution. In the basic form each operation has a cost of 1 (Christen, 2006). A more advanced edit distance function is Monge-Elkan which normalizes the score between [0,1]. It is an affine variant which means a sequence of insertions or deletions are given lower cost.
Jaro is another popular similarity function which is not based on edit distance. It is based on the number of, and order of, common characters between two strings. Winkler proposed a variant, called JaroWinkler, which emphasizes the similarity at the beginning of the strings. It does so by using the length of the common prefix. Both Jaro and JaroWinkler are intended for short strings.
Token based distance functions
The methods we discussed so far look at characters in a string. However, often strings consist of multiple words (or tokens). Token based functions compute a similarity by looking at the words rather than the characters. An example is the Jaccard similarity which computes how many words occur in both string s and t and divide this number by the total amount of words in both strings. There are more token based similarity functions, however, since we are not using them for the purpose of this thesis we refer to the work of Cohen et al. (2003).
Hybrid distance functions
A hybrid function uses tokens as input and computes edit based distance functions of all possible combinations of words. First strings s and t are broken down into substrings s = a1,…,aK and t = b1,…,bL.
18 𝑠𝑖𝑚(𝑠, 𝑡) =1
𝐾∑ 𝑚𝑎𝑥𝑗=1
𝐿 (𝑠𝑖𝑚′(𝐴 𝑖, 𝐵𝑗)) 𝐾
𝑖=1
Sim’ is a secondary distance function. In the Second String project the Monge-Elkan, Jaro and Jaro-Winkler are used as secondary functions. These functions are referred to as level two distance functions. To illustrate how such a function works we compute the level 2 similarity score for the following two strings: ‘carriersuser firstname’ and ‘carriercontact firstname’. As secondary distance function we use JaroWinkler. Each string contains two tokens (words) thus the total amount of possibilities is 2 * 2 = 4. For each combination we calculate the JaroWinkler score. After computing the scores the maximum is taken for each token in the first string. This is shown in table 6.
Table 6: calculating a Level 2 similarity score
Token – string 1 Token – string 2 JaroWinkler
carrieruser carriercontact 0,82
carrieruser firstname 0,43
Maximum for first token in string 1 max(0,82; 0,43) = 0,82
firstname carriercontact 0,5
firstname firstname 1
Maximum for second token in string 1 max(0,5; 1) = 1
Finally, the average is calculated from the obtained maximum: 1
2∗ (0,82 + 1) = 0,91
The level 2 similarity score for these two strings using JaroWinkler as secondary distance function is 0,91.
2.3.4
Schema matching approaches
Next, we look at several examples found in literature. First, we describe a general approach to schema matching in figure 12.
Figure 12: general workflow of a schema matcher (Rahm, 2011)
19 matching instances. Internally input schemas are converted to trees for structural matching (Duchateau & Bellahsene, 2016). An overview how COMA works is given in figure 13.
Figure 13: COMA matching operation: (a): two input schemas, (b) matrices aggregation, (c) candidate selection and (d) output (Rodrigues et al., 2015)
COMA receives two input schemas (a) for which it makes a matrix of all possible combinations. Each matrix is labelled using different similarity measures. All matrices are aggregated in a single matrix according to a chosen criterion (e.g. maximum, average, minimum). From the aggregated matrix candidates are selected for which the value exceeds a certain threshold (c) which are then presented to the user (d). Since COMA relies solely on heuristic the approach was not used in our approach since we want to incorporate a machine learning approach.
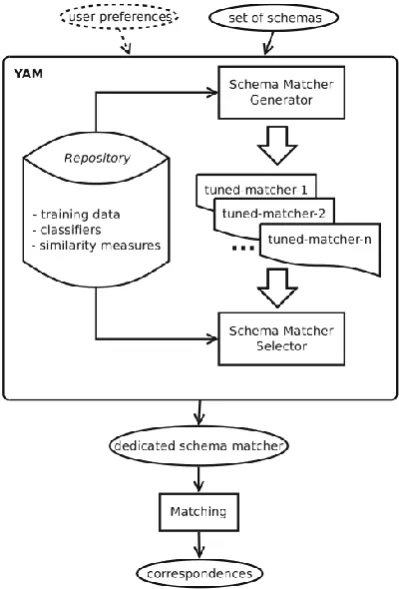
A recent advancement using machine learning is YAM, short for Yet Another Matcher (Duchateau & Bellahsene, 2016). YAM is a schema matcher generator designed to generate a tailor-made matcher when making a new mapping. Optionally user input can be specified to integrate user preferences or requirements. YAM uses more than 20 different classifiers using Weka and over 30 similarity measures using the Second String Project. An architecture overview of YAM is presented in figure 14.
[image:24.595.83.283.432.727.2]20 Internally YAM stores a repository of schemas (training data), classifiers and similarity measures. When a new schema is presented these are used to generate matchers. Additional user preferences can be included by the user. For example, a user could indicate whether he favours precision over recall or include additional training data (expert correspondences). The output of YAM is a dedicated schema matcher. In this thesis, we aim to create a dedicated schema matcher by using a plethora of expert correspondences and thus we haven’t used YAM.
Similarity flooding is an approach based on structural matching which is given by Melnik, Garcia-Molina & Rahm (2002). The algorithm makes use of the hierarchal relationships found in XML schemas to derive mappings between schema elements. This allows for an algorithm which works with schemas from different domains. Other methods based on heuristic are often fine-tuned which costs significant time and resources. Structure matching is therefore promising, but needs further research (Zhao & Ma, 2017).
2.4
Summary
In this section, we first looked at intelligence amplification. A definition was extracted based on a selection of articles. Intelligence Amplification is not a well-defined term and as such it draws upon literature from various domains.
Important for Intelligence Amplification is the close collaboration between humans and machines. This led to the idea of investigating the task delegation between the two. Some argue the idea of exploiting strengths and weaknesses of humans and machines should not be looked at we tend to disagree. Naturally each has their own strengths and weaknesses and exploiting them results in an effective collaboration. To model this collaboration the PACT framework discussed explains how a machine and computer could collaborate on the same product. The framework provided by Dobrkovic et al. (2016) provides further guidelines.
A general introduction was given into machine learning. We explained what a classifier is, what is needed to train a classifier and how performance of the classifiers can be evaluated on a test set by looking at precision and recall.
21
3
Reference architecture
In this chapter, a reference architecture is defined for performing schema matching using Intelligence Amplification. Section 3.1 introduces the concept of a reference architecture. Next, the approach to the reference architecture is discussed in section 3.2. This is divided in two stages, first is pre-processing discussed in section 3.3 and matching in section 3.4. Section 3.5 gives a summary.
3.1
Introduction
A reference architecture is a generic architecture for a class of systems used as a foundation for the design of concrete architectures from this class (Angelov, Grefen, & Greefhorst, 2012). A concrete architecture is an architecture specifically designed for a software application. The purpose of a reference architecture is to provide guidance for future development (Cloutier et al., 2009), provide standardization of concrete architectures and facilitation of the design of concrete architectures (Angelov et al., 2012). A reference architecture is defined at an abstract level (Angelov et al., 2012). This level of abstraction is the cause of one of the main challenges of a reference architecture, namely to make them concrete and understandable (Cloutier et al., 2009). For an extensive list of benefits and drawbacks we refer to the paper of Martínez-Fernández, Ayala, Franch, & Marques (2017).
Our reference architecture is developed using the ArchiMate language. The core of ArchiMate consists of three layers, namely the business, application and infrastructure layer (Iacob, Jonkers, Quartel, Franken, & Berg, 2012). The business layer offers products and services to external customers that are realized in the organization by business processes. It shows how the organization is internally organized. Next is the application layer which delivers the services to realize it’s business added value modelled in the business layer. Lastly the infrastructure layer realizes infrastructure services on which applications can be build. Enterprise architecture shows the relation between these layers. These concepts are from the ArchiMate core (version 1); the language has been further expanded with a motivation, implementation & migration layer (version 2) and more recently a strategy and motivation layer (version 3). The reference architecture is based on the business and application layer.
3.2
Approach
The architecture is based on the general approach to schema matching proposed by Rahm (2011) which was discussed in section 2.3.4. Two main actions are distinguished: a pre-processing stage and a matching phase. When discussing the interaction between human and machine we refer to the PACT model discussed in section 2.1.4. Both actions contain a work product which both machine and human work on. This is indicated by creating a green coloured data object.
3.3
Pre-processing
Pre-processing is the task of cleaning the input labels. Auxiliary information could be used here such as thesauri or dictionaries (Rahm & Bernstein, 2001). The drawback of thesauri or dictionaries is they often do not contain domain specific words, the ability to expand abbreviations or the ability to expand compound nouns (a compound noun is a word composed of more than one word) (Sorrentino, Bergamaschi, Gawinecki, & Po, 2010). Employing pre-processing steps can greatly improve results (Sorrentino et al., 2010).
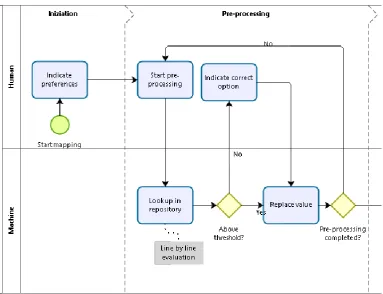
22 Figure 15: Steps for pre-processing
For each pre-processing step, the machine performs a lookup in a repository. When a lookup value is found, or when a highly similar value is found, it is automatically replaced. However, when the machine is not certain about a replacement value the user is involved and is asked to indicate the correct option. To effectively leverage the power of the human in the process the work product (DiBona et al., 2016) is the list of schemas which need to be cleaned. The computer first tries to clean the text by performing a lookup in a repository (1.2). For each lookup, a score of certainty is generated. When the score is above a predefined threshold (1.4) the option should automatically be selected (1.6). When in doubt the user is invoked who decides which option is best, or, when no option is presented, indicate the result (1.5).
We note this stage of pre-processing can occur multiple times (1.7). For example, first compound words could be cleaned, next abbreviations expanded and finally a translation is made. As said this is indicated by the user in the preference (0.1). Which pre-processing task yield best results depends on each situation and is open for further research because different pre-processing steps lead to different mappings (Zhao & Ma, 2017). For this reason, only the use of pre-processing steps is indicated in the reference architecture. We consider this to be the essence and therefore include it in the reference architecture (Cloutier et al., 2009). Which pre-processing options are implemented should as such be part of a concrete architecture.
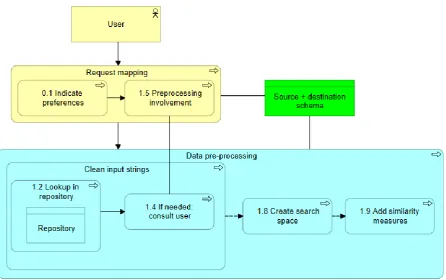
23 Figure 16: Architecture for pre-processing
As mentioned, the user triggers the mapping process which starts by indicating the preferences (0.1). At the pre-processing function, the first function (clean input string) is coloured green. This indicates there is a work product which the human and computer jointly work together. In this case these are the source and destination schema. After the data has been cleaned a search space is created and similarity measures are added. The boxes are coloured blue which we use to indicate this is a computer only task.
3.4
Matching
24 Figure 17: Process overview of matching stage
25 Figure 18: Architecture for matching
When invoking the software agent (2.1) the search space is send and as a response the search space including suggested mappings is returned. The software agent could use a training set when making selections (Rahm & Bernstein, 2001). This is used when the software agent is a machine learning classifier, but is not needed when a heuristic is used. After the agent created a list of suggested mappings these are presented to the user. Visualisation is very important in this stage. Presenting all schema matching correspondences to a user at once could be too overwhelming and in fact annoys the user as they become frustrated sifting through all the false positives (Falconer & Noy, 2011). Completing the mapping is a task which is both time consuming and cognitively demanding (Falconer & Noy, 2011). An explanation of the reason why the software agent suggested a mapping is considered an important feature to help the user but this still is a feature where many approaches fall short (Falconer & Noy, 2011; Ivanova, Lambrix, & Åberg, 2015).
The green coloured search space is the work product machine and human provide input to. The machine starts with the initial input which the user refines and the machine re-adds knowledge. When the matching is complete the search space is kept by the machine so it can learn upon it in future iterations.
3.5
Summary
27 Finally the complete reference architecture is displayed on the below in figure 20.
Figure 20: IA driven architecture for schema matching
28
4
Prototype
This section first describes the architecture used to build the prototype in section 4.1. Next, the machine learning platform used is discussed in section 4.2 after which section 4.3 describes the training set. Section 4.4 discusses results of a one-class classifier (anomaly detection) and section 4.5 the results of the two-class classifiers. Finally, section 4.6 gives an overview of the prototype itself.
4.1
Architecture
The prototype is developed to be part of eMagiz which is the software product developed by CAPE Groep. eMagiz functions by using an Integrated Life Cycle management consisting of five different phases:
- Capture: the initial phase where requirements are captured. This gives a high-level overview of the integration
- Design: this is where mappings are designed. The prototype we have developed is used in this phase.
- Create: after the mappings have been designed they are refined and finalized. This also includes the routing process of messages.
- Deploy: the created mappings are deployed to a production environment. - Manage: when deployed transformations are managed in this phase.
29 Figure 21: architecture of the prototype
As with the general architecture the user invokes a process to create new mappings. This is triggered by a button in eMagiz which calls the AutoMapper webservice. However, in our case the user is not yet involved in any pre-processing nor is it able to indicate any preferences.
During pre-processing the only step currently taken is to lower case the string. Next it iterates over all possible combinations by comparing every element of the source schema with every element of the destination schema (i.e. evaluation of the cross join) . This approach has at least a quadratic complexity and could lead to problems when using large schemas (Rahm, 2011). In these cases, reduction of the search space could be needed. In our prototype this isn’t done.
30 Figure 22: overview how data is prepared for machine learning solution
The first step is to extract several schemas to be used for training purposes (red coloured lines; described in section 4.3). For each schema processing steps are applied. At this stage pre-processing only lower cases the string name. A list of all possible instance pairs is then created. If the amount of element in schema A is |𝐴| and for schema B is |𝐵| then the total amount of instance pairs is |𝐴| ∗ |𝐵|. For each instance similarity measures are appended. Since we extract schemas which have already been mapped we label each instance pair whether it’s mapped (1) or not (0). This comprises the training set which is used to train a classifier.
When a user invokes the auto mapper the same steps are followed. The green coloured lines indicate these steps. However, since the class label is now unknown we use the classifier to predict the label. The user is then presented with new mappings which were predicted by the classifier.
4.2
Machine learning platform
As mentioned previously we opted to use Azure Machine Learning studio. The ease of use complemented with the graphical ‘drag and drop’ user interface allows to build machine learning experiment which fit the needs at CAPE. Initially Weka was taken into consideration but the ease of implementing Azure ML into Mendix compared to Weka favoured our decision to use Azure ML. Several classifiers are available in Azure ML which can be grouped in the following categories (Microsoft, 2017b):
• Regression: used when trying to predict numerical values (e.g. stock price).
31
• Clustering: this is an unsupervised learning method which means no class label is used. Data with similar patterns are clustered together to discover structures in data. Can be used to detect which combination of groceries are often purchased at a supermarket.
• Two-class classification (or binary classification): used when trying to predict two categories. This applies to our case since we are trying to predict whether an instance pair is mapped or not.
• Multi-class classification: an extension of two-class classification, however, in this case there are at least three categories which the classifiers is trying to predict.
Our interest goes to two-class classification. However, we are curious to find out whether an anomaly detection model would give good results. At the time of writing this thesis several two-class classifiers are available which we list in table 7. To ease the process of selecting a classifier Microsoft indicated what unique features each classifier has. A brief comparison was made to Amazon Web Services (AWS) which only provides one classifier, namely logistic regression (Amazon Web Services, n.d.). For this reason, we did not dive deeper in using AWS.
Table 7: overview of classifiers available in Azure (Microsoft, 2017b)
Classifier Supports >100
features
Linear model
Training time
Accuracy
Support vector machine ● ●
Locally deep support vector
machine ●
Averaged perceptron ● Fast
Logistic regression ● Fast
Bayes point machine ● Fast
Decision forest Fast ●
Boosted decision tree Fast ●
Decision jungle ●
Neural network Long ●
32 Figure 23: comparing a linear vs. a non-linear class boundary (Microsoft, 2017a)
The figure describes a problem by using two features, namely age and income. Looking at the figure we see a classifier which constructs a linear class boundary misclassifies a relatively high number of data points. A classifier which constructs a non-linear class boundary, in the figure denoted as the actual class boundary, would give better results because it captures almost all the data point belonging to the ‘purchased premium service’ class. Using a classifier which produces a linear boundary could be outperformed by a non-linear model.
The last two criteria found in table 7 are training time and accuracy. Most classifiers can be trained quickly, however, only for the neural network it is indicated training time could be long. However, as we can see this is met with a generally high accuracy. In section 4.5 we discuss the outcome of the classifiers.
4.3
Training set
[image:37.595.61.526.66.300.2]Before a classifier can be trained, a training set must be created. This was done by extracted existing mapping results which were performed at BAM, Neele-Vat and PostNL. Since all these mappings have been put in production we consider them to be a reliable, expert verified, set. These results have undergone the pre-processing steps outlined in section 4.2. This yielded a training set with 2.354.498 records of which 19.486 were mapped. An example of this data is shown in table 8.
Table 8: Excerpt from the training set
AttributeIn AttributeOut
Type-Match
Leven-shtein
Jaro-Winkler
Cla ss
costcentrereceived costcentercode 1 6 0,9 1
naam1 shipper 1 7 0 1
factuurspecificatieaankoop pijsvaluta
lengte 0 33 0,42 0
documentid buildingnumberdesignati
on
1 18 0,52 0
bevestigingid results_of_audit 1 13 0,5 0
adrescontactfaxnummer zeevervuilingindicator 0 20 0,46 0
33
cityname starttimedropoff 0 14 0,58 0
brutogewicht douanedocumentnumm
er
0 17 0,49 0
conf_oms conf_oms 1 0 1 1
height gevaarlijkegoederenraili
ndicator
0 28 0,42 0
innerverpakking douanedocumentcode 1 16 0,47 0
As can be seen the training set contains seven columns. The first is the AttributeIn which is the name of the attribute of the source schema. The AttributeOut columns contains an attribute name on the destination schema. Type match indicates whether the attributes are of the same type (i.e. string to string). Levenshtein gives the Levenshtein edit distance and JaroWinkler is the similarity score. Finally, the class indicates whether the combination of attributes is mapped (1) or not (0).
4.4
Anomaly detection model performance
Azure ML provides two anomaly detection classifiers, namely the one-class SVM and a PCA-Based anomaly detection classifier. We are interested in the initial performance before we dive deeper in the exact working and differences between the two classifiers. The training set outlined in section 4.3 was used. Unfortunately, these results were appalling with a respective F-measure of 0,4% and 1,6%. We therefore decided not to take a closer look at anomaly detection possibilities and move on to the two-class two-classifiers in the next section.
4.5
Two-class classifier performance
[image:38.595.69.526.482.744.2]Most of the classifiers which we listed in section 4.2 were constructed to compare performance. We ddin’t use the Bayes Point Machine because it threw an internal error message and as such couldn’t be used. For each classifier we wrote down precision, recall and F-measure. Testing was done by performing a stratified split for which 70% of data was used for training and the remaining 30% was used to test the trained classifier. The results are presented in figure 24.
Figure 24: comparing classifier performance
0 100 200 300 400 500 600 700 800 900 1000 0% 10% 20% 30% 40% 50% 60% 70% 80% 90% 100% Averaged Perceptron Logistic regression
SVM Locally deep SVM Decision jungle Decision forest Neural network Boosted decision tree
34 Analysing the results, we see the best results (in terms of F-measure) came from the neural network. It outperformed all other classifiers with an F-measure of 69%. Other classifiers scored around 50%, except the decision jungle which scored appalling. However, as can be seen, there is a catch which is the long training time. The boosted decision tree gave good results in terms of precision (80%) but had a lower recall (37%). For each trained classifier, a scored column is appended. This is an indication how ‘certain’ the classifier is of its results. Altering the threshold for which the classifier labels the class as either mapped or not mapped has an impact on the precision and recall. By default, the threshold is set to 0,5. In other words, if the scored probability is greater than or equal to 0,5 the assigned label is ‘mapped’. Else the label would be ‘not mapped’. Azure ML generates a graph which compares precision and recall of two classifiers by altering the scored threshold. This graph is presented in figure 25 for the neural network and boosted decision tree.
Figure 25: Comparing precision and recall of the neural network to the boosted decision tree by varying the scored threshold
Based on this result we see the neural network outperforms the boosted decision tree. As mentioned earlier the neural network took more time to train. Since cost are incurred when training a classifier this means the neural network is more expensive to train. At the time of writing the cost of training a classifier equate to €0,85 per hour. Therefore, training the classifier would cost about €15 which is still acceptable. Retraining the classifier is not needed on a daily basis, but we estimate it could be needed once every quarter. However, this is ball-park estimate and further testing is needed to determine the frequency of retraining. Based on the results it is decided to use the neural network.
4.6
Prototype
35 Figure 26: example of two schema's which have to be mapped
[image:40.595.90.482.360.629.2]The first step when creating a Mendix app is to create the domain model. For the AutoMapper app this is shown in figure 27.
Figure 27: domain model in the AutoMapper app