Implementation and optimization of facial recognition with the Intel
Realsense SR300
Y
VOD
ELAEREElectrical Engineering, SCS group, University of Twente [email protected]
Supervisor: Dr. Ir. L.J. Spreeuwers
Abstract— This article describes the continuation and improvement of a method for using facial recognition together with the Intel Realsense SR300 camera[1]. The previous work described that reliable facial recognition can be obtained within the correct environment and the correct settings at a range from 25- up to 40 centimeter.
An application framework is described and built to create a user friendly environment for the facial recognition and makes the previous method more accessible to the public. With some modifications, it can be used with any 3D image acquisition device.
Furthermore, improvements are suggested and implemented to improve the quality and range of the facial recognition. An attempt has been made to make a reliable facial recognition system at between the user and camera of 60 centimeter. A small sample size of 6 persons has been used to examine the quality. Although all persons are recognized correctly, the expectation is that with a larger sample size false validations will occur, due to poor registered images as a result of shortcoming of the camera.
I. INTRODUCTION
Biometrics are a hot topic and are used in a large variety of applications. Fingerprint sensors are now the standard for smart phones but the focus has been moved towards 3D facial recognition with the new iPhone X being the first one to implement this.The RealSense SR300 is a small relative cheap 3D image acquisition device which can, and has been embedded into e.g. laptops and displays. Therefore, it makes sense to research if the camera can be used in a reliable facial recognition application.
This projects exists of two parts. The first part consists of integrating facial recognition software together with the Realsense camera by building a application framework. The second part discusses the different camera settings and their effects and focuses on implementing improvements to in-crease the quality and range of the facial recognition. The performance of the described improvements are evaluated and discussed by experimenting with facial recognition at larger distances than evaluated before.
II. THEORY ANDRELATEDRESEARCH
This project is a continuation on the work done by Nahuel Manterola [1]. In this research, the Intel Realsense SR300 camera is used to capture 3D images of subjects which are
registered and verified using the FFVF Facial Recognition software [2] [3].
A. Facial Recognition
The facial recognition method used in this project has been developed by Luuk Spreeuwers. It takes a 3D point cloud containing a face as input and registers this face onto a intrinsic coordinate system which is based on the vertical symmetry plane through the nose, the tip of the nose and the slope of the bridge of the nose. Two variations of this registration process are used, which are both used in the recognition.The front facing registered faces are stored in a range image containing 75x87 floating point depth values. Feature extraction is done using 30 fused region PCA-LDA likelihood classifiers per registration method. Verification is done by comparing probe images to gallery images, and are collected by a scoring algorithm referred to as fixed far vote fusion (FFVF). The resulting scores vary between 0 and 60, where a higher score implies more similarities between the gallery and the probe. Fine registration is applied on the probe images by making 35 small variations on the registration parameters and taking the highest score for every gallery image. The meaning of gallery and probe in this context is that the gallery consists out of known reference images while a probe image is registered and compared to all gallery items without storing its features.
III. APPLICATION FRAMEWORK
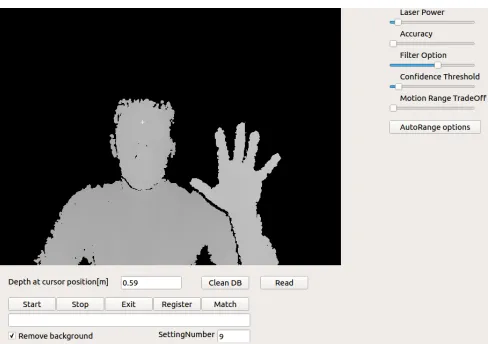
Fig. 1: GUI of the developed application framework
A. Camera Access
To access the camera data and settings, the open source Intel RealSense Cross Platform API called librealsense is used [6]. It provides a set of classes and functions to access the camera stream settings and data. It supports the Realsense F200, SR300, R200, LR200 and ZR300 cameras. It must be noted that a new development version of the API called Intel RealSense SDK 2.0 is released which supports the SR300 and the to be released D400 series camera, but due to the development phase of the API it was chosen to use the stable native one.[7]
Listing 1 and 2 respectively show the pseudo-code illus-trating the initialization and the updating of the frames to the GUI. The GUI is updated using a timer to prevent the function from blocking the rest of the program. The first step
of the updateF rame function is to wait for new data. If
new data is available, the device object is queried to return a pointer to the new frame. The frame is passed through a function which reads out the depth value of the cursor position to give the user an indication of how far the subject is away from the camera. When the ”Remove Background” box is ticked, the depth data which is bigger or smaller than
the depth of the cursor position +/ −15cm is removed.
The 16-bit depth data of this frame is stored in a object of QImage and mapped onto a 8-bit gray scale. The image is then displayed to the user by writing a pixmap to an object of QLabel.
Listing 1: Initialization of the camera v o i d I n i t ( ){
t i m e r = new QTimer (t h i s) ;
c o n n e c t ( t i m e r , SIGNAL ( t i m e o u t ( ) ) ,
t h i s, SLOT ( u p d a t e F r a m e ( ) ) ) ; / / G e t p o i n t e r t o d e v i c e
dev = c t x . g e t d e v i c e ( ) dev−>e n a b l e s t r e a m ( )
s c a l e = dev−>g e t d e p t h s c a l e ( ) ; dev−>s t a r t ( ) ;
t i m e r−>s t a r t ( ) ;
}
Listing 2: Updating the frames to GUI v o i d u p d a t e F r a m e ( ){
dev−>w a i t f o r f r a m e s ( ) ;
u i n t 1 6 t ∗ d e p t h i m a g e = dev−>g e t f r a m e d a t a ( ) ; z minmax = g e t c u r s o r D e p t h ( d e p t h i m a g e ) ; r e m o v e B a c k g r o u n d ( z minmax ) ;
QImage depthIMG ( m a p T o 8 b i t ( d e p t h i m a g e ) , w i d t h , h e i g h t , w i d t h , G r a y s c a l e 8 ) ; u i−>QLabel−>s e t P i x m a p ( QPixmap : : f r o m I m a g e ( depthIMG ) ;
}
B. Registration and matching
The registration and matching procedure of the program differ only slightly from each other. When one of the
procedures starts, the program collectsnframes, which can
be configured by the user. From thenframes, an extra frame
is generated which is a smart averaged version of the other frames. This procedure is discussed further the optimizations section. The generated frames are then transferred to a new thread, where the frames are converted to point clouds using a deprojection fucnction provided by the librealsense library. This deprojection function converts the pixel values to real world coordinates using the intrinsic parameters of the camera. The point clouds are than exported to .WRL files, which can be used for further processing and debugging purposes. The produced .wrl files are read by the facial recognition software which maps the point clouds onto a intrinsic coordinate system and returns a range image with the registered face. When the ”Register” button was pushed, features of the range image are extracted and stored in the database. On the other hand, when the ”Match” button is pushed, the range image is used as a probe image and scored against the gallery images which are stored in the database. As a last step, the scores are presented to the user.
IV. CAMERA SETTINGS
The SR300 has different parameters which can be ad-justed. The most relevant settings are described here.
A. Laser Power
The laser power settings can in theory be set between 0 and 16. However, the laser power can only be set to fully on or of by the user. Different preset settings however enable the “auto” function of the laser. In this auto mode, the laser power depends on the infrared data captured by the SR300. In most cases, the laser will project full power. Only in the case of very close range scans the laser power decreases in order to avoid overexposure as described in [1].
B. Motion versus range trade-off
C. Filter option
The most important setting of the camera, especially for facial recognition is the filter option. With this setting, a trade-off between smoothing and noise can be made. The filtering is done by the onboard imaging ASIC. The possible filter settings are shown in figure 2. At larger distances, the camera has a lot of distortion. To compensate this, a filter has to be applied to the images. The risk of this approach is that the face can become too generic and the uniqueness of the face will be lost. The image shows a skinned and rendered illustration of the the effect of smoothing. In the previous
work, the “FILTER SCANNING”, filter option (F= 3) was
[image:3.612.315.559.105.245.2]used. In the experiment and result section, the effect of the filters will be discussed in more detail.
Fig. 2: Available filter options of the SR300 [4]
D. Preset
Different presets are available for the camera. An overview of the presets can be found in [4]. The preset midrange is chosen since it controls the exposure time and laser power automatically within the desired range. Auto range specific parameters exists, but the librealsense API has not been designed in such a way that these parameters can be modified. All the results which are presented after this section, are done with setting the camera to the preset “Midrange”. The only parameter that is adjusted after this setting is the Filter Option.
V. OPTIMIZATIONS
Several options are studies to increase the quality of the range images. These can be distinguished between pre-registration optimizations and after pre-registration optimization.
A. Pre-registration optimization
These are optimization which are done before the point cloud is fed to the recognition software. Since the frame-rate of the SR300 can be set up to 60 FPS, it is possible to combine several frames without suffering too much of possible movement of the subject. The following two pre-registration optimizations are applied: combination of multi-ple point clouds and averaging of multimulti-ple point clouds.
1) Combination: The simplest optimization adds the data
of the specified n frames into one point cloud, resulting
in more data per sample. Due to noise, small variations in depth information occur and some points at the face may not be available at all frames. By combining multiple
point clouds into one, the effect of noise is reduced in the registration process and less holes while occur since more data is available as can be seen in figure 3.
Fig. 3: Range image without hole filling. Left: Combined, Right: Raw
2) Averaging: This optimizations focuses on combining
multiple frames into one averaged frame. The first frame which is captured is used as a reference frame to the other
captured frames, while the otherN −1 frames are used to
validate and average the data of the reference frame. The absolute deviation between the depth values at every pixel of the first frame and the rest of the frames is calculated. Pseudocode of this procedure is shown in the listing below. If the deviation is less than the allowed deviationDallowed, the
depth value of theithframe is added to the reference frame
and a pixel specific counter is incremented to tell that a value is added to the specific pixel. After the iteration is done, the stored depth values are divided by the pixel specific counter value. Pixels which only contain the value of the first frame are considered unreliable, and therefore set to 0. This implies
that no depth value is known for this pixel value.Dallowed
is configured to be 1 millimeter. In the remaining of this project, this optimization is referred to as PointCloudMean (PCM).
Listing 3: Pseudocode for Point Cloud Mean
/ / I n c r e m e n t c o u n t e r and add d e p t h v a l u e t o r e f e r e n c e−
/ / f r a m e i f t h e d e v i a t i o n i s w i t h i n t h e t o l e r a n c e
f o r (i n t i = 0 ; i<( n f r a m e s ) ; i ++){ f o r(i n t j = 0 ; j<(w∗h ) ; j ++){
d e p t h F r a m e = g e t F r a m e ( ) ;
i f ( f i r s t F r a m e )
avgFrame = g e t F r a m e ( ) ;
e l s e i f ( d e p t h F r a m e [ j ] > 0 ){
dev = a b s ( avgFrame [ j ] − d e p t h F r a m e [ j ] ) ;
i f ( dev < t o l e r a n c e ){
c o u n t A r r a y [ j ] += 1 ;
avgFrame [ j ] += d e p t h F r a m e [ j ] ;
} } } }
/ / A v e r a g e i f a t l e a s t t w o f r a m e s a r e a v a i l a b l e , / / o t h e r w i s e s e t t h e p i x e l v a l u e t o 0 .
f o r (i n t j = 0 ; j<t o t a l P i x e l s ; j ++){ i f ( c o u n t A r r a y [ j ] > 0 ){
[image:3.612.54.300.236.356.2]} e l s e
avgFrame [ j ] = 0 ;
B. After registration optimization
The facial recognition software registers faces onto a intrinsic coordinate system defined by facial characteristics. This results in a frontal view of the face independent of the orientation of the face when the 3D data is captured. By av-eraging several range images into one averaged range image, the effect of noise can be reduced. This approach is more robust against motion than the pre-registration optimizations, since the averaging is done on images of the face with a fixed orientation. The effect of after registration averaging (ARA)
with N = 10 is shown in figure 4. The faces are captured
at a distanceD= 0,35from the camera. As a result of the
reduction of noise and the access to more data, the range image with ARA optimization clearly has more details than the image without any optimization referred to as ”Raw”.
Fig. 4: Range images of a registered face with D = 0,35,
N = 10andF = 5. Left: After-registration averaging, Right:
Raw
VI. EXPERIMENTS AND RESULTS
A. Filter setting
Since a part of this project is about increasing the range in which recognition is possible, different filter settings are
considered at a distance D = 0.6 meter from the camera.
For every filter setting, 10 different sets of data withN= 10
[image:4.612.342.516.286.369.2]are taken. 5 datasets are used as gallery while the other 5 are used as a probe. For every optimization, this leads to a 5x5 matrix. The average values of these matrices are shown in table I. From table I, it can be concluded that for filter
TABLE I: Recognition scores versus filter options
Raw Combined PCM ARA F=3 3.92 6.24 5 5.36 F=4 1.96 7.68 5 8.68 F=5 7.48 16.76 8.12 18.4
settingF = 5the highest scores are achieved. The question if
this smoothing filter compromises the uniqueness of the face is discussed in the next section. Another observation from
table I is that every individual optimization has a positive contribution to the scoring results, with the effect of the ARA optimization being the biggest.
B. Facial Recognition
To evaluate the performance of the facial recognition at
a distance D = 0.6 meter, two captures are taken of M
different persons. The persons are asked to make a slight adjustment in their pose between the two captures. The first set of captures is handled as the reference gallery pictures, the second as a probe. Scoring the gallery against the probe
results in aMxM matrix. The scores at the diagonal of this
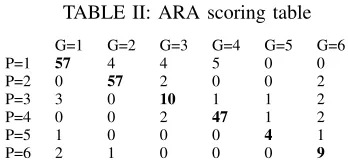
matrix should be significant higher than the other values, indicating that the persons at the diagonal are the same subject. Table II shows the results for the ARA optimization
for M = 6 and F = 5. For every row, the highest value
[image:4.612.54.299.297.440.2]marked indicating the matched gallery for every probe.
TABLE II: ARA scoring table
G=1 G=2 G=3 G=4 G=5 G=6
P=1 57 4 4 5 0 0
P=2 0 57 2 0 0 2
P=3 3 0 10 1 1 2
P=4 0 0 2 47 1 2
P=5 1 0 0 0 4 1
P=6 2 1 0 0 0 9
The performance is evaluated by comparing for every row
the diagonal Di, max off-diagonal Omaxi and the margin
Mi=Di−Omaxi.The average of these parameters is shown
in table III for D = 0.6 meter andF = 5 to compare the
performance of every optimization. Different filter options were tried in the same experiment and subjects but resulted in much worse results.
TABLE III: Performance evaluation of the different optimiza-tions
Raw Combined PCM ARA
D 14.5 21.33 17.5 30.67
Omax 3.67 8.00 1.67 2.5
M 10.83 13.33 15.83 28.17
The standard way to decide if two subject x,y are the
same in the facial recognition software is by comparing the
obtained scoreV to a thresholdTv:
D(same subj|x,y=
(
1, V(same subj|x,y)> Tv
0 otherwise
Where the thresholdTvis tuned for a specific False Accept
Rate (FAR). Table II is not suitable for determining a
thresh-old due to the small sample sizeM = 6and the fluctuation
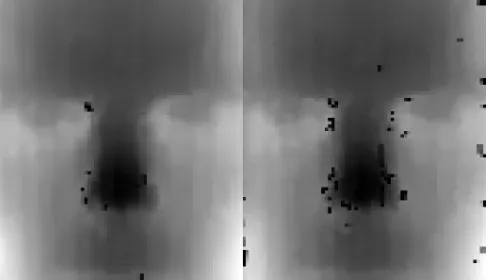
[image:4.612.104.249.651.690.2]C. Pixel Depth deviation and consistency
During the performed experiments, it was observed that the registration of the faces was not consistent at a distance
D= 0.6 meter. A possible reason for this is the pixel depth
deviation around sharp edges around the face e.g around the nose. To test this hypothesis, the pixel deviation is evaluated
around the nose of a face. M frames are captures of a
static situation. The Average Absolute Deviation (AAD) is
calculated for every pixel. Pixels with depth valuepu,v= 0
are not used for calculating the average value to prevent
outliers in the result. Figure 5 shows the results forM = 5
[image:5.612.56.297.215.311.2]andF = 5.
Fig. 5: Left: Averaged frame Right: pixel specific AAD of the same frame [mm]
From figure 5 it is visible that the pixel deviation is the largest around the sharp edges of the nose and the eyes. This pixel deviation has a negative effect on the registration quality. Around the sharp edges the majority of the captured frames have no depth data available which result in holes in the registered range image. These holes are filled after the registration, but do affect the fitting in the nose which results in variation of the registration.
VII. DISCUSSION
The obtained results presented in the previous section show the results of the implemented improvements aimed to improve the quality of the range images used for recognition.
The results indicate that every individual improvement has a positive contribution to the recognition score. Table III show that a acceptable average margin can be achieved using the ARA optimization. The sample size of the data used to obtain these scores is too small to give relevant numbers to the verification rate (VR). The results however
do indicate that even at a small sample sizeM = 6already a
lot of off-diagonal scores are noted. It is expected that when
the sample size M is increased, these value will become
even more significant which can lead to false recognitions. The reason for the high amount of off-diagonal scores, is
that at a distance D = 0.6 meter a lot of smoothing has
to be applied by using filter F = 5 to get a range image
which is suitable for the facial recognition software. This results in more correlation between different subjects. Based on the obtained results, the implemented facial recognition
is considered not to be reliable at a distance D = 0.6 and
filterF = 5.
Combining the individual implemented optimization
into one hybrid optimization may improve the scores but time did not allow to test this. However, the results of the AAD measurement show that the data of the SR300 is not reliable and detailed enough to make a high quality range image for the facial recognition software at a distance
D = 0.6 meter. It is suggested that a different 3D image
capturing device should be used for facial recognition at larger distances. At distances up to 40cm, reliable facial recognition is possible using the SR300 camera [1].
VIII. CONCLUSION ANDRECOMMENDATIONS
This project discussed the development of a framework which enables a user to modify settings of the camera, store point clouds as gallery images and record probe images to score them against the stored gallery. The recognized gallery ID is displayed to the user as a result. This application framework can be used as a tool for demo-purposes and further experiments
The second part of this project was focused on improving the quality of the registered range images. First, different camera settings and their effects were discussed. It was highlighted that the filter option is very important to make a trade off between smoothness and noise, especially at large distances. To get the best results at larger distances, filter
optionF = 5 should be used
Three optimizations are discussed and implemented. All individual optimizations have a positive contribution to the recognition score, as well as the uniqueness. After registration averaging (ARA) had the best result. It is suggested that the presented optimization should be combined into one hybrid optimization, to improve the quality even more.
The results of the experiments indicate that at larger distances, the system does not provide reliable facial recognition results due to the low quality of the registered range images. A possible explanation for the low quality of the images is that at larger distances, the pixel deviation around the sharp edges of the face is too big, and sometimes no pixel information is available at all, which result in inconsistent registered range images.
The bottom line is that the RealSense SR300 is not suitable for facial recognition at large distances of 60 centimeter. With the release of the D400 camera series, it would be interesting to see the performance of these camera’s within the same framework.
REFERENCES
[1] Nahuel Manterola. ”Creating 3D images for facial recognition using the RealSense SR300”, url not availble.
[3] Luuk Spreeuwers. ”Breaking the 99% barrier: optimization of 3D face recognition”. In: IET biometrics 4.3 (2015), pp. 169–178. URL:http: //doc.utwente.nl/95850/.
[4] IntelR RealSenseTM Camera SR300 Product Datasheet , url:
http://www.mouser.com/pdfdocs/intel_realsense_ camera_sr300.pdf
[5] Qt — Cross-platform software development for embedded & desktop ,
url:https://www.qt.io/
[6] IntelR RealSenseTM Cross Platform API, url:https://github.
com/IntelRealSense/librealsense/tree/legacy
[7] IntelR RealSenseTM SDK 2.0 https://github.com/