Forward-looking information in
annual reports:
A study into its realisation
Author - E.M.H. Engbers
University of Twente
Thesis - Master Business Administration
1st supervisor - Ir. H. Kroon 2nd supervisor - Dr. P.C. Schuur
I Summary
Do firms really execute the plans they made for the future? Are their stated objectives
achieved? Do their predictions become reality? In today’s dynamic business environment
forward-looking corporate information forms a relevant source of information to investors.
However, since uncertainty is inseparably linked to the future, no guarantee can be given that
the forward-looking information firms provide will match with future reality. This research is
concerned with monitoring forward-looking information provided by firms in annual reports,
by comparing this information with backward-looking information on its realisation provided
in later annual reports. Forward-looking information is retrieved from selected sections of the
annual reports of 2004 until 2013 from two case companies active in the fashion retail
industry. All units of forward-looking information are labelled according to characterising
dimensions that facilitate the description of the forward-looking information as well as
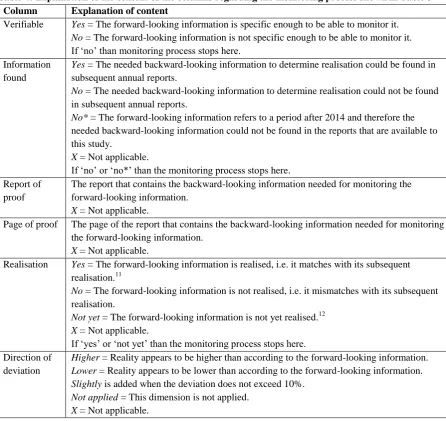
dimensions related to the monitoring process. From the findings it can be concluded that
realisation could not be determined for all forward-looking information, as some information
appeared to be not specific enough to be able to monitor it or the needed backward-looking
information was found to be lacking in later annual reports. This raises further questions
regarding the disclosure practices of firms concerning forward-looking information and
reporting back on it. For the forward-looking information units for which realisation could be
determined it was found that, although for eighteen out of twenty firm-years these were
mostly found to be matching with subsequent reality, every firm-year included
forward-looking information that appeared to be mismatching with backward-forward-looking information on
its realisation. This might indicate the difficulty for firms to exactly predict and plan their
future. Investors must be aware of the fact that certainty regarding the realisation of
forward-looking information is non-existing. Follow-up research is needed that extends the findings of
II Table of contents
Summary ... I
1 Introduction ... 1
2 Literature review ... 5
2.1 Corporate disclosure in general ... 5
2.2 Definitions of forward-looking information ... 7
2.3 Characteristics and determinants of forward-looking information ... 9
2.4 Factors influencing firms’ disclosure behaviour of forward-looking information .... 12
3 Research design ... 15
4 Methodology ... 18
4.1 Case study method ... 18
4.1.1 Description of Inditex ... 20
4.1.2 Description of H&M ... 22
4.2 Data collection ... 24
4.3 Monitoring forward-looking information ... 29
5 Description of the data ... 35
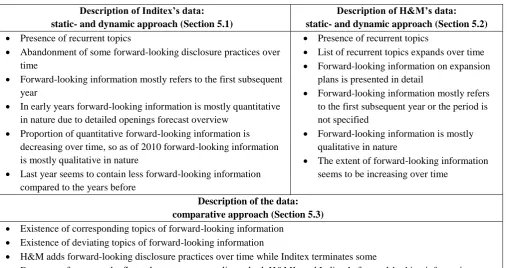
5.1 Description of Inditex’s data: static- and dynamic approach ... 35
5.2 Description of H&M’s data: static- and dynamic approach ... 38
5.3 Description of the data: comparative approach ... 40
5.4 Description of the data: recap ... 41
6 Results of the monitoring process ... 43
6.1 Results of the monitoring process for Inditex: static- and dynamic approach ... 44
6.2 Results of the monitoring process for H&M: static- and dynamic approach ... 49
6.3 Results of the monitoring process: comparative approach ... 53
6.4 Results of the monitoring process: recap ... 55
7 Discussion ... 57
8 Conclusion ... 59
References ... 61
1
1 Introduction
For all economies the challenge of optimally channelling funds from savers to companies that
are in need of financial resources to realise their business ideas is a critical one (Healy &
Palepu, 2001). Economies that are capable of managing this matching process well, can boost
the creation of jobs and wealth. Capital markets play a significant role in allocating savings to
investment options (Palepu, Healy, & Peek, 2013). They can be defined as “markets where
entrepreneurs raise funds to finance their business ideas in exchange for equity or debt securities” (Palepu et al., 2013, p. 16). For a capital market to be able to function efficiently
corporate disclosure is essential. The existence of problems regarding differences in
incentives and asymmetric information between managers and external investors, which
hinder an efficient matching process of financial resources to investment opportunities,
increases the need for disclosure and financial reporting (Healy & Palepu, 2001). The annual
report is one medium that firms use to provide corporate disclosure and it is generally
regarded as one of the most important tools to transmit corporate information to investors and
other stakeholders (Botosan, 1997; Branco & Rodrigues, 2006).
McLaney and Atrill (2016) note that: “Over the years, there has been a trend towards greater
disclosure of information in the published annual financial reports of limited companies. (...)
They cover a very wide range of information and their boundaries are becoming ever more
difficult to establish” (p. 160). The finding of a changed nature of business several years prior
thereto serves as an explanation for such changes in corporate disclosure (McLaney & Atrill,
2016). Beattie, McInnes, and Fearnley (2004) argued that some fundamental changes have altered the nature of business: intangible assets started to play a bigger role in a firm’s
processes of value creation and so its competitive advantage. More specifically, they were talking about intangible assets that are not included in a company’s financial statements. In line with this, Beretta and Bozzolan (2008) state: “In fact, the increasing complexity of regulations, business contexts, firm’s strategies, and operations makes it quite difficult to
appreciate the substance of financial statements without accompanying narrative explanations” (p. 334). Such essential changes gave rise to the emergence of literature stating
that traditional financial reporting, which mainly focuses on the provision of information that
is backward-looking, quantitative, and financial, became no longer appropriate to meet the
information demand of the changing market (AICPA, 1994; Lev & Zarowin, 1999; FASB,
2 The highly influential report of the AICPA (1994), also known as the Jenkins Report,
formulated a number of key recommendations to increase the quality of corporate reporting,
which included increasing the attention for and provision of forward-looking information. To
make investment decisions, investors want to predict future firm performance as accurately as
possible. Forward-looking information can be very useful in getting a good perspective on a firm’s future (AICPA, 1994). This is especially true since the more dynamic business
environment makes it harder to predict the future by solely relying on backward-looking
information (Beattie, 2000). PWC (2007) mentions transparent information about current as
well as future business performance as being the raw material for making effective decisions
in capital markets.
The relevance of forward-looking information to investors makes it an interesting research
topic. A substantial part of scientific research that focuses on forward-looking disclosure is
concerned specifically with examining management earnings forecasts. However, a recent
study highlights that it is not very common for firms to provide such quantitative statements
related to earnings, and therefore questions the attention it gets (Bozanic, Roulstone, & Van
Buskirk, 2015). Moreover, research indicates that forward-looking information has a
predominantly qualitative character (Beattie et al., 2004; O’Sullivan, Percy, & Stewart, 2008;
Athanasakou & Hussainey, 2014) and frequently covers topics that are non-earnings-related
(Schleicher & Walker, 2010). Though, relatively little research focuses on forward-looking
information beyond just management earnings forecasts, a point which is also stressed by
several other researchers (Beretta & Bozzolan, 2008; Schleicher & Walker, 2010; Bozanic et
al., 2015). By focussing on forward-looking information in a broader sense, this study
attempts to contribute to growing the academic knowledge on this topic.
In contrast to historical or backward-looking information, for forward-looking information it is not possible to determine whether it is ‘true’ at the time the statement is made, since it
refers to a future situation. Clearly, it is difficult to foresee how the future will look. This also
applies to companies and their managers. Uncontrollable and unanticipated factors can cause
actual performance to differ from what the company stated in advance. For investors it might
be useful to get insights into the reliability of forward-looking information, so they can decide
whether or not to use this kind of information in making investment decisions. This is
especially true since forward-looking information is largely unregulated (PWC, 2007), which
3 related to the future. Schleicher and Walker (2010) question its unregulated and unaudited
nature, because the results of their study point at the application of impression management
through forward-looking information. Moreover, the numerous corporate reporting scandals
of the twenty-first century, such as the well-known cases of Enron, WorldCom, and Royal
Ahold (Ball, 2009), taught us the existence of the chance that firms might intentionally
disclose information that is a distorted version of the information they actually possess.
The above provides support for examining the correspondence of forward-looking
information with subsequent reality. Do firms really execute the plans they made for the
future? Are their stated objectives achieved? Do their predictions become reality? Monitoring
the realisation of forward-looking information provided by companies could provide investors
with useful information about the value of forward-looking information and how to deal with
it. It might help them to make improved investment decisions, thereby mitigating capital
misallocation. Therefore, the following research question is central to this study:
How does forward-looking information provided by companies in annual reports relate
to backward-looking information on its corresponding realisation provided by
companies in subsequent annual reports?
Because of the aforementioned importance of the annual report in firms’ communication with
investors, the focus solely lies on this source of corporate information. To the best of the author’s knowledge, no study has yet conducted a research that carries out a thorough one by
one check of forward-looking information. Besides extending the limited knowledge on
broadly defined forward-looking information, this study’s theoretical contribution therefore
also lies in filling this research gap. Moreover, this explorative research likely provides new
insights that could form the basis for future research, which might further strengthen the
knowledge base on forward-looking information. In order to formulate an answer to the
central research question, the forward-looking information provided over the ten year period
from 2004 until 2013 by two case companies active in the fashion retail industry is examined.
H&M and Inditex are chosen to fulfil the role of being the case companies used in this study.
The remainder of this study is organised as follows. Section 2 reviews literature related to the
research topic of corporate forward-looking information. Section 3 discusses the research
design by explaining the three approaches to answering the main research question as well as
4 the research. In addition, it contains a description of the fashion retail industry and the two
case companies. Section 5 presents the results of the first part of the research, which is
concerned with mapping the forward-looking information that is included as data in this
study, by giving a description of it. After that, Section 6 describes the results that follow from
the second part of the research, that is to say, from monitoring the forward-looking
information. Section 7 discusses this study by mentioning its limitations and suggestions for
5
2 Literature review
Corporate disclosure can be seen as the overarching topic of this study, as forward-looking
information represents one form of corporate disclosure. Therefore, in the first subsection of
this literature review corporate disclosure in general is discussed to create a solid background
for the rest of the study. Thereafter, since this study focuses on corporate disclosure in the
form of forward-looking information, the literature review will concentrate on that specific
topic by defining it, discussing its characteristics and determinants, and discussing factors influencing firms’ disclosure behaviour of forward-looking information.
2.1 Corporate disclosure in general
As already indicated in the introduction, corporate disclosure is essential for capital markets
to function efficiently, which in turn, by facilitating an efficient matching process of financial
resources to investment opportunities, is crucial for having a flourishing economy. Disclosure
is essential in this because connecting savers to entrepreneurs is not as easy as it might sound.
Problems regarding information and incentives complicate that matter, which according to
Healy and Palepu (2001) can be divided into two main problems: the ‘information problem’ and the ‘agency problem’. Regarding the information problem they refer to Akerlof’s (1970) ‘lemons’ problem, which is caused by asymmetry between information available to
entrepreneurs and investors, and by their conflicting incentives. Because of this it is hard to
identify the ‘good’ and the ‘bad’ business ideas, making investors assign an average level of
value to both, which means that good ideas will be undervalued and bad ideas will be
overvalued. This inability to correctly value investment opportunities can lead to a capital
market breakdown, because the good ideas may be expelled, leaving the bad behind. Through
disclosure, asymmetry in information between the two parties can be reduced (Healy &
Palepu, 2001). The agency problem is a result of the norm that the owners (investors) are not
the same persons as the controllers (management). Managers are supposed to act on behalf of
the investors, to maximise investors’ wealth. However, self-interested managers have an incentive to use investors’ funds for their own best interests, which might differ from those of
the investors (Jensen & Meckling, 1976). Corporate disclosure can mitigate the agency
problem, since it allows investors to monitor managerial behaviour (Healy & Palepu, 2001).
Given the importance of corporate disclosure for the overall state of the economy, it is not
very remarkable that it is subject to regulations mandated by law. Moreover, events such as
6 corporate disclosure regulations (Leuz & Wysocki, 2008). A recent trend concerning
regulation is that of increasing the global harmonisation of reporting rules. For example, since
2005, practically all listed companies in the European Union are required to adopt a set of
uniform reporting standards, named International Financial Reporting Standards (Leuz &
Wysocki, 2008; McLaney & Atrill, 2016). These standards provide companies with a
common set of rules that tell them what information they are required to disclose and how
they must disclose it. This eases comparison of the performance of firms from different
countries (McLaney & Atrill, 2016).
Through regulation, disclosure can be roughly divided into mandatory disclosure and
voluntary disclosure. Early studies by Grossman (1981) and Milgrom (1981) on voluntary
disclosure presented the theory of full disclosure, in which eventually an equilibrium is
reached where firms disclose all relevant private information: not only the good but also the
bad news. Prior thereto an unravelling process takes place, which works as follows. Without
any disclosure by firms, the present information asymmetry causes investors to see all firms
as being identical, and thus of the same average value. This gives firms with a value higher
than average an incentive to fully disclose, so as to differentiate themselves from companies
with worse news. Investors then rationally assume that the average value of the firms that do
not disclose has to be lower. This drop in average value causes some below-average valued
firms to become above-average, giving them the same incentive to disclose. Repeating this
reasoning leads to an equilibrium state of voluntary full disclosure by all firms, except those
having the worst possible news. So, in such a case government intervention would not be
necessary to stimulate disclosure.
However, it is hard to believe that this process works the same in practice as in theory.
Subsequent papers came up with additional factors that hinder the full disclosure reasoning.
Verrecchia (1983) mentions proprietary costs as a reason for managerial discretion applied in
information disclosure, that is to say, managers withholding information that might even
represent favourable news. He aims at costs that stem from situations in which other parties use the disclosed information in a way disadvantageous to the disclosing firm. “For example,
firms in highly competitive industries may regard public disclosures of any kind as potentially
costly in the assistance it renders competitors” (Verrecchia, 1983, p. 191). While in the full
disclosure theory rational investors infer from the absence of information that it must be
7 no longer valid. Furthermore, Dye (1985) states that the often lacking knowledge among
investors about which information managers actually possess serves as a legitimate
explanation for managers hiding non-proprietary information. In this case the no news means
bad news assumption also does not hold. The above has shown that disclosure might be a
more complex phenomenon than as suggested by Grossman (1981) and Milgrom (1981).
In addition to the well-known annual report, information can be disclosed by companies
through several other sources. Examples include: management forecasts, press releases,
conference calls, and the company website (Healy & Palepu, 2001). “Although the annual
report is not the only source of information about the performance of a company, it is considered to be an influential source because of its wide coverage and availability” (Hooks,
Coy, & Davey, 2002, p. 502). The time in which annual reports were only used to present the
main financial statements is over: nowadays, a very broad set of information is included in it.
This change is due to, among others, the more complex nature of business (McLaney & Atrill,
2016).
2.2 Definitions of forward-looking information
By clarifying the concept of corporate disclosure in general, the foundation of this literature
review has been made. From now on, the focus shifts to forward-looking information in
particular, which is the main topic of this study. Forward-looking information represents one
form of corporate disclosure and can be classified as voluntary disclosure, since it is largely
unregulated (PWC, 2007). This subsection is concerned with discussing definitions of
forward-looking information that are present in literature.
Scientific research focusing on forward-looking information provided by firms uses different
conceptualisations of the term. A substantial part of it is concerned specifically with
forward-looking information in the form of management earnings forecasts (e.g. Baginski, Hassell, &
Kimbrough, 2002; Rogers & Stocken, 2005; Hirst, Koonce, & Venkataraman, 2008; Kim &
Shi, 2011). According to Hirst et al. (2008) such forecasts are seen as being a key disclosure
mechanism for influencing market expectations. In line with this, Kim and Shi (2011) state
that management earnings forecasts represent important tools for managers to enhance the
understanding of business performance among investors. This apparent importance may well
be an explanation for the substantial academic interest devoted to the topic. However,
8 study emphasises that it is not very common for firms to provide such forecasts and therefore
puts question marks at the attention it gets (Bozanic et al., 2015). Moreover, the infrequent
nature of earnings forecasts is one of the reasons Schleicher and Walker (2010) mention for
using a more broad definition of forward-looking disclosures, which allows for the inclusion
of statements that are qualitative and not related to earnings. In literature no standardised
definition of forward-looking information in a corporate disclosure setting can be found.
Some examples of definitions include:
“Forward-looking information is any prediction or information that aids prediction. It
includes management's plans, assessments of opportunities and risks, and forecasted
data.” (AICPA, 1994, p. 20)
“Forward-looking disclosure is the class of information that refers to current plans and
future forecasts that enable investors and other users to assess a company’s future
financial performance.” (Aljifri & Hussainey, 2007, p. 883)
“All statements other than statements of historical fact included herein, including,
without limitation, those regarding our financial position, business strategy,
management plans and objectives for future operations are forward-looking
statements.” (Inditex, 2013, p. 173)
“All statements addressing our future operating performance, and statements
addressing events and developments that we expect or anticipate will occur in the
future, are forward-looking statements (…).” (Pepsico, 2016, p. 146)
The lack of a standardised definition and the fact that literature dealing with forward-looking
information often skips defining it might be caused by the obviousness of the term, since the
name already reveals a great part of its meaning, causing some to think that it is not necessary
to explicitly describe the meaning of the term. However, the shared common understanding
which can be deduced from the aforementioned definitions is that forward-looking disclosure
provides information regarding the state of the future and that it comes in different forms.
There are also studies that use a definition that captures their methodology of selecting
forward-looking information:
“Rather, provided the projection can be classified in terms of the following four
characteristics, it is recognised as a forward-looking statement for the purposes of this
study: direction (up, down or no change); type (income/profit, cash flow,
9 Review of Operations, Chairman’s Report, D&A and other); and nature (qualitative, quantitative).” (O’Sullivan et al., 2008, p. 15)
“I define forward-looking statements as all those sentences that contain: “will,” “should,” “can,” “could,” “may,” “might,” “expect,” “anticipate,” “believe,” “plan,” “hope,” “intend,” “seek,” “project,” “forecast,” “objective,” or “goal.””
(Li, 2010, p. 1097)
From the existence of such definitions it can be concluded that the boundary between what
classifies and what does not classify as forward-looking information might not be as clear-cut.
Such definitions can then be seen as an attempt to sharpen the boundary in order to simplify
the process of separating forward-looking information from other information. Hussainey
(2004) confirms the difficulty of this process by stating that often information that is not
categorised as forward-looking nevertheless carries messages that are relevant for the future.
He illustrates his statement with an example of a piece of backward-looking information (last
year’s R&D expenditure has grown by 10%) that still has implications for the future (increase
in future cash flow is expected).
2.3 Characteristics and determinants of forward-looking information
After discussing some definitions, the characteristics of forward-looking information are
discussed in this subsection to further improve the understanding of it. Besides that, there will
be shortly elaborated on research into the determinants of forward-looking information. But
first, it might be useful to give an impression of the proportion of forward-looking statements
in annual reports. Beattie et al. (2004) examined in their research all voluntary narrative
sections of the 1999 annual report of 11 UK firms active in the food industry. They found that
of all text units 13% has a forward-looking time orientation. Another study, with a much
larger sample, examined the management discussion and analysis (MD&A) sections of 44,708
annual reports for the years ranging between 1993 and 2009. On average, 9.5% of all MD&A
sentences were forward-looking in 1993 and by 2009 this number has risen to 13.7%. This
increase could be attributed to encouragements of regulatory bodies to disclose
forward-looking information (Muslu, Radhakrishnan, Subramanyam, & Lim, 2015). Before
proceeding with the rest of this subsection, it should be noted that it became clear from sifting
through literature that significant differences exist between studies with regard to their
research design. The previous subsection already presented the existing differences in
10 source, unit of analysis, and the geographical environment may vary. This reduces the
comparability of the different studies. Though, some clear conclusions about the
characteristics and determinants of forward-looking information can be inferred. This
subsection mainly presents the findings for which consistency is found across multiple
studies.
Several studies are concerned with examining how companies present their forward-looking
information. An often reached conclusion is that this information is mostly qualitative in
nature. The aforementioned study of Beattie et al. (2004) shows that for one specific company
only 5 text units of the total 216 forward-looking units present in the voluntary narrative
sections of the annual report were quantitative. This result does not deviate much from the
proportions that the average of all 11 companies shows. Another study, conducted by O’Sullivan et al. (2008), with a much larger sample of Australian companies, but a smaller
pool of forward-looking text units to be researched, due to the strict definition used (see
quotation in Section 2.2), concluded that 79% and 83% of the forward-looking statements
found in all narrative parts of the annual reports of 2000 and 2002 respectively are classified
as qualitative. Likewise, there are more studies that show similar results exhibiting a
predominantly qualitative character of forward-looking information (Clarkson, Kao, &
Richardson, 1994; Kent & Ung, 2003; Athanasakou & Hussainey, 2014). A consequence of
this characteristic is that it complicates the effective monitoring of the accuracy of such
information for outsiders, so this entails that they might also often be less verifiable in nature
(Schleicher & Walker, 2010). Additionally, Athanasakou and Hussainey (2014) concluded
that most of their sample statements do not refer to a concrete time horizon. This lack of
specificity might further impede the monitoring of forward-looking statements.
Another frequently drawn conclusion is that forward-looking disclosures often tend to predict
that the future will be bright. More specifically, statements bringing positive news generally
appear to dominate those bringing bad news. The results shown in the study of Schleicher and
Walker (2010) are an example of evidence supporting this statement. They analysed
forward-looking statements in the narrative part of 502 annual reports of UK companies coming from
1996 to 2002 and found that, overall, positive statements about the future are more numerous
than those of which the tone is neutral or negative. As part of their research they also grouped
together all firm-years that were about to show highly increasing or highly decreasing profit
11 positive and negative statements was smaller for the group of firms with subsequent strongly
declining margins, positive news still prevailed, which is against Schleicher and Walker’s
(2010) presumption. By assuming that managers are able to predict sales and profit on the
short term the authors conclude from the results that firms with bad performance ahead bias
the tone upwards and they state that the results point at impression management. In an earlier
study, Pava and Epstein (1993) examined for 25 companies whether or not influential events
that occurred in 1990 were predicted in the MD&A section of the 1989 annual report. They
found that 56% of the positive events were predicted correctly, but for negative events this
number was only 26%, which made them state: “we think there is no reason to believe
managers are better able to predict good news than bad news. Our conclusion is that managers withheld information about trends that would negatively affect their businesses (…)” (p. 52).
There will be elaborated further on the role of firms and their managers in the disclosure of
forward-looking information in the next subsection. The results provided by Clarkson et al.
(1994), Kent and Ung (2003), and Athanasakou and Hussainey (2014) also show that a
positive character of forward-looking information is more common than a negative character.
Regarding the content of forward-looking statements it is hard to draw conclusions from the
available literature. For example, Beattie et al. (2004) found that most forward-looking
information is about “activities and plans to meet broad objectives and business strategy” (p.
225). Li (2010) also assessed the content by dividing 30,000 forward-looking sentences across
12 content categories. Most of them contain information about operations, productions, and
general business. Because researchers tend to use different classification schemes to sort
forward-looking information with regard to content, it is hard to draw clear conclusions by
comparing findings from different studies. Though, when being less specific, it could be
stated that forward-looking statements frequently focus on topics that are non-earnings-related and ‘soft’ (Schleicher & Walker, 2010), that is to say, topics that are hard to measure.
Lastly, there are also studies that have conducted research to enlarge the knowledge about
which factors could provide an explanation for differences between firms with regard to their
disclosure behaviour of forward-looking information. The research of Ahmed and Courtis (1999) titled ‘associations between corporate characteristics and disclosure levels in annual reports: a meta analysis’, established that the most frequently examined determinant in their
sample of 29 relevant studies is corporate size, with the pervasive finding being a highly
12 forward-looking disclosure in particular, empirical research also found that large companies
tend to disclose more of such information in comparison with smaller companies (Kent &
Ung, 2003; Beretta & Bozzolan, 2008; Wang & Hussainey, 2013; Muslu et al., 2015). A
possible explanation for this relationship could be found in the relatively stable performance
of bigger firms (Kent & Ung, 2003). This may make them less reluctant in providing
forward-looking information, because of having a more predictable future. But also more general
explanations such as the presence of advanced internal reporting systems at larger firms, their
possession of financial resources to fund the provision of a higher level of disclosure, and the
greater demand for information caused by a more widespread ownership might explain the
positive relationship found in the context of forward-looking disclosure specifically (Ahmed
& Courtis, 1999).
2.4 Factors influencing firms’ disclosure behaviour of forward-looking information
The unravelling argument, discussed in Section 2.1, predicts full and truthful corporate
disclosure. However, the evidence discussed in the previous subsection suggests that firms do
not disclose all forward-looking information they possess. Moreover, the evidence provides
indications that if forward-looking information is disclosed it is questionable whether it
represents the true information firms have. It is important to create some understanding of
what triggers firms and their managers to make certain decisions. Wang and Hussainey (2013)
show that in their used sample of more than 5,000 firm-years, considerable differences exist
in the amount of forward-looking statements provided per firm-year observation. From this it
might be inferred that significant variation is present in companies’ decisions to provide
forward-looking information. This subsection elaborates on factors that could play a role in
the disclosure behaviour of companies with regard to forward-looking information. Factors
are discussed that are found to be mentioned across multiple studies. From the following, it
becomes clear that the decision to forecast is a complex one which seems to be influenced by
several factors. Providing forward-looking information is perceived by many companies as a
real challenge (PWC, 2007).
“Managers have incentives to disclose forward-looking information to investors to assist them in their decision making (...)” (Kent & Ung, 2003, p. 283). The information can be used to
increase transparency and make investors better understand the business and its future (PWC,
2007). Closely related to assisting investors, another reason for firms in favour of adding
13 2001; Kent & Ung, 2003; Aljifri & Hussainey, 2007). Evidence has shown that increased
disclosure may result in a lower cost of capital (Botosan, 1997; Francis, Khurana, & Pereira,
2005; Francis, Nanda, & Olsson, 2008), which is beneficial for firms for obvious reasons. The
theoretical explanation for this negative relationship is as follows. When the availability of
information about a company is more limited, investors perceive investing to be riskier.
Consequently, for bearing such information risk they want to be compensated by a premium
(Barry & Brown, 1984). A firm’s cost of capital can thus be reduced by lowering information
risk through providing more information. Graham, Harvey, and Rajgopal’s (2005) survey
among over 400 executives indicates that 81.9% of the participants agrees with a lower
information risk being a motivation for increasing disclosure. Understandably, the motivation
to provide forward-looking information from a cost of capital perspective is especially strong
when firms require external financing, which is confirmed by the finding of Clarkson et al. (1994) of a positive relationship between companies’ financing requirements and the
likelihood of making forecasts.
Schleicher and Walker (2010) mention two contrasting theories in their article that could underlie firms’ disclosure behaviour of forward-looking information: signalling and
impression management. Signalling models rely on the assumptions that the interests of
managers and investors are perfectly aligned and that the information that managers disclose
is always truthful. In contrast, impression management is based on Jensen and Meckling’s
(1976) agency theory, which highlights the possibility of conflicting interests between the two
parties and that managers might be acting self-interested in such a case. “The idea that
managers use their discretion over corporate disclosures opportunistically to their own
personal benefit is central to the impression management literature” (Schleicher & Walker,
2010, pp. 373-374). It usually implies that managers try to mislead users of corporate
reporting by presenting their company in a more favourable light than reality would dictate,
resulting in a positive reporting bias (Clatworthy & Jones, 2006; Schleicher & Walker, 2010).
Incentives for managers to apply impression management stem from its potential short term
result of improved share performance, leading to higher share-based compensation. For
investors, on the other hand, it can lead to misallocation of their capital (Merkl-Davies &
Brennan, 2007). Clatworthy and Jones (2003) state that narratives in corporate reporting
might be used to exercise impression management, since these are largely unaudited. Their
research findings as well as that of Clatworthy and Jones (2006) indeed point at the usage of
14 narratives that are forward-looking in particular and also found indications of impression
management.
However, because in case of forward-looking disclosure subsequent reports can be used to
judge the truthfulness of previous statements, managers are constrained in misleading
investors. In particular, detection of misrepresentation might do considerable harm to management’s reporting reputation (Rogers & Stocken, 2005). Evidence shows that when ex
post evaluation of the truthfulness is harder for outsiders due to highly fluctuating business
results, it is more likely that self-serving manipulation by managers takes place (Rogers &
Stocken, 2005; Schleicher & Walker, 2010). But not only the truthfulness of forward-looking
statements can be assessed, also their accuracy. The fear of being inaccurate can be a motive
for firms not to provide forward-looking information. This is supported by the finding of Kent
and Ung (2003) that for firms with more certainty regarding the future, as measured through
earnings volatility, the likelihood of providing forward-looking information is higher. A result which they attribute to potential costs of litigation and firms’ reputation concerns. Kent and
Ung (2003) explain the reasoning behind the costs that may arise from building up a bad
reporting reputation. They state that if firms frequently provide forward-looking information
that later on appears to be inaccurate, the market might respond by discounting the credibility
of subsequent forward-looking information. This potentially leads to a higher cost of capital
through increased information risk.
Lastly, the point regarding competition is discussed in this section, which is in several studies mentioned as being a factor that could play a role in firms’ disclosure behaviour of
forward-looking information (Clarkson et al., 1994; Kent & Ung, 2003; PWC, 2007). This point builds on Verrecchia’s (1983) proprietary costs, already discussed in Subsection 2.1, which is
identified as a factor hindering the full disclosure reasoning. PWC (2007) states that many
firms are afraid of the higher demand for forward-looking information, as it might force them
to reveal competition sensitive information. To give an example of this: releasing favourable
forward-looking information on earnings possibly intensifies competition by encouraging new
competitors to enter (Kent & Ung, 2003). So, when the forward-looking information is useful
to competitors, but consequently unprofitable to the disclosing firm, the firm might decide not
15
3 Research design
This section discusses the research design used for this study. The three approaches to
answering the research question are explained as well as the two parts that make up the
research.
As already introduced and presented in the introduction, the research question that is central
to this study is as follows:
How does forward-looking information provided by companies in annual reports relate
to backward-looking information on its corresponding realisation provided by
companies in subsequent annual reports?
In order to be able to give a well-founded answer to this main research question, three
different approaches for answering it will be used: the static-, dynamic-, and comparative
approach. These approaches are established by the author itself and serve to strengthen the
foundation on which conclusions are based. In order to carry out these approaches in this
research it is necessary to include multiple companies and multiple periods. Hereby, the
accidental selection of a period and company that are significantly deviating from others - and
are therefore not representative - is avoided.
The static approach describes static observations that follow from monitoring individual
pieces of forward-looking information by comparing it with information on their subsequent
realisation. Uncertainty is inseparably linked to information regarding the future, caused by
the ever existing chance of the occurrence of uncontrollable and unanticipated factors making
actual performance differ from what the company indicated beforehand through
forward-looking information. Determining whether it matches with its subsequent realisation might
produce insights about the ability of firms to provide accurate and realistic forward-looking
information. For investors this is important to know as they may want to use this kind of
information in making their investment decisions. As indicated in the introduction,
forward-looking information forms a relevant source of information to investors. However, basing
decisions on information about the future that appears to deviate materially from how that
future actually turns out to be may lead to ineffective and inefficient investment decisions, which in turn affects the overall economy. Moreover, besides managers’ ability to produce
reliable forward-looking information, also their willingness plays a role. Jensen and
16 in the previous section suggests that self-interested managers have incentives to provide
investors with a distorted view of the future. The foregoing provides scope for conducting a
study concerned with monitoring forward-looking information. Additionally, its unregulated
nature (PWC, 2007) and the numerous corporate reporting scandals (Ball, 2009) justify
posing the above research question.
The dynamic approach describes whether changes or trends can be identified over time. This
approach to answering the research question is included for the following reasons. As
discussed earlier in this study, starting from the 1990s awareness arose that the nature of
business had changed and that business reporting had to follow accordingly. It appears that business’ more complex nature has indeed led to transformed reporting, marked by the
broader set of information included in annual reports, which “now go way beyond simply presenting the main financial statements” (McLaney & Atrill, 2016, p. 160). It might be
interesting to see how forward-looking information behaved during a period of change.
Furthermore, reporting scandals at large companies and their failures increased the pressure
on listed companies to enhance reporting quality (Beretta & Bozzolan, 2008). Additionally,
the summer of 2007 marked the start of the global financial crisis, which originally started in
the United States. In Europe, from late 2009, the consequences of the global financial crisis
have led to another one: the European sovereign debt crisis (Lane, 2012). All in all, the
corporate world has gone through turbulent times, making it interesting to examine the
occurrence of changes or trends in the provision of forward-looking information by firms in
their annual reports over a long-term period of 10 years, starting from 2004 until 2013. This
period is chosen because of the willingness to keep this study as recent as possible.1
Lastly, the comparative approach aims to provide insights by comparing the observations
from the static- and dynamic approach between companies. This serves to examine if
observations are company-specific or if their appearance is more widespread and hereby a
stronger base is created for drawing generalisable conclusions.
1
17 Furthermore, this research can be roughly split into two parts. To formulate an answer to the
main research question, first the forward-looking information provided by companies in
annual reports is characterised and described. This is done in Section 5 and this section is
basically concerned with mapping the forward-looking information. The second part of the
research is concerned with the monitoring process in which individual pieces of
forward-looking information are compared with backward-forward-looking information on their realisation
provided in later annual reports. The observations that follow from this process are described
18
4 Methodology
This section in detail explains the methodology used to carry out this research. A case study
method forms the basis, for which two companies from the same industry are chosen as case
companies. This method is described as well as the chosen industry and companies. After that,
attention is paid to collecting the forward-looking information that is included as data in this
research. Lastly, the process of monitoring the forward-looking information is outlined.
4.1 Case study method
Since this study provides a first attempt to perform a thorough one by one check of corporate
forward-looking information, a research method is chosen which can serve as being
descriptive and exploratory. According to Yin (2009), a case study method is especially suitable for answering ‘how’ questions. Also, because the subject of this research is not
directly quantifiable, a qualitative case study method seems appropriate. The ‘case’ in this
study can be defined as the provision of forward-looking information over a period of ten
years by a company in its annual report. Because the comparative approach is concerned with
comparing observations between companies, it is necessary to include at least two case
companies. Ergo, the basis of the research is formed by a multiple case study method. Since
conducting this research is time-consuming, the decision is made to work with two case
companies in order to facilitate a more in-depth analysis of the mostly narrative data, with
attention for its diverse content.
Evidence shows that significant differences exist between companies from different industries
with regard to their disclosure of forward-looking information (Beretta & Bozzolan, 2008;
Wang & Hussainey, 2013). Beretta and Bozzolan (2008) state that this result points at some kind of ‘bandwagon effect’ and mention industry to be a driver of forward-looking disclosure.
Taking this into consideration combined with the fact that only two companies are used as
case companies in this study, the decision is made to choose two companies from one and the
same industry. Companies from different industries are likely to be too different to be
appropriate for drawing meaningful conclusions from the comparative approach, since a large part of the conclusions would then follow from differences between the industries’ general
practice.
The fashion retail industry is selected to fulfil the role of ‘case industry’. As becomes clear
19 characterised by a high level of uncertainty regarding consumer demand, which makes it an
interesting industry for examining the realisation of corporate forward-looking information.
The fashion retail industry went through a period marked by significant changes, especially
starting from the 1990s (Bhardwaj & Fairhurst, 2010). Bhardwaj and Fairhust (2010) mention the “fading of mass production” (p. 166) as one of such changes, caused by consumers
becoming more sensitive toward fashion and style and less satisfied with basic standardised
clothing manufactured using the mass production method. Furthermore, other than just
offering two collections every year, one for the spring/summer and one for autumn/winter
season, more seasons were added to create more variety in the fashion market. The industry
transitioned to an approach that is more market-driven instead of production-driven, which
made retailers realise the importance of flexibility and quick reactivity to the market
(Bhardwaj & Fairhurst, 2010).
As a result of the transformation of the fashion industry a new concept emerged: fast fashion
(Bhardwaj & Fairhurst, 2010). “Fast fashion describes the retail strategy of adapting
merchandise assortments to current and emerging trends as quickly and effectively as
possible” (Sull & Turconi, 2008, p. 5). Using this concept enables companies to offer
affordable and trendy products to the masses and thereby to ‘democratise’ couture (Sull &
Turconi, 2008). Fashion retailer Zara, which is one of Inditex’s brands, is seen as the pioneer
in the field of fast fashion (Tokatli, 2008). Other examples of companies using this strategy
today include H&M, Mango, Forever 21, and Primark (Loeb, 2015). To support the strategy,
fast fashion retailers sell a greater amount of different products in relatively small batches
throughout every season, thereby creating continuously changing product assortments (Caro
& Gallien, 2010). Essential to fast fashion are short lead times to enable a quick response to
changes in consumer demand. To achieve this, fast fashion retailers rely more heavily on
pricier localised production instead of following the trend of outsourcing production to distant
low wage countries. Furthermore, continuous and close monitoring of trends and consumer
preferences is crucial (Cachon & Swinney, 2011). Nowadays, fast fashion is still an important
concept in the fashion retail industry, which has proven to have great disruptive power by
completely changing the industry (Loeb, 2015; Rosenblum, 2015).
Christopher, Lowson, and Peck (2004) define four characteristics that typify fashion markets.
20 is short and seasonal. Second, demand for fashion items is highly volatile, since it may easily
be affected by the vagaries of the weather and other external factors that determine the
ever-changing trends in fashion. Third, this volatility causes demand to be extremely hard to
predict. Lastly, Christopher et al. (2004) mention the high impulse buying of consumers as a
characteristic of fashion markets. Furthermore, the fashion market can be characterised as
highly competitive (Christopher et al., 2004; Bhardwaj & Fairhurst, 2010). The typical
features of fashion retail make it a complex business, especially with regard to inventory and
logistics management (Christopher et al., 2004), and sales forecasting (Wong & Guo, 2010;
Ni & Fan, 2011; Thomassey, 2014).
The world’s largest fashion retailers are chosen as case companies: Inditex and H&M (Caro &
Martínez-de-Albéniz, 2015). In fiscal year 2014 Inditex generated sales of €18.1 billion
(Inditex, 2015), while H&M reported sales of €16.3 billion (H&M, 2015a).2 Selecting the two largest companies further enhances the comparability and makes it likely that the needed
annual reports are easily accessible. Moreover, it increases the chance of being able to extract
a rich set of data. This is based on the finding from the literature review that bigger firms tend
to disclose more forward-looking information. The following two subsections provide a
description of Inditex and H&M respectively, by describing the companies from their own
perspective but also from the perspective of outsiders.
4.1.1 Description of Inditex
The history of the Spanish company Industria de Diseño Textil S.A., in short Inditex, started
in 1963 when it was founded by Amancio Ortega Gaona. More than 50 years later, Inditex,
still headquartered in Spain, is the parent company of a group of firms, which are primarily
concerned with retail selling fashion items, mostly clothing, but also accessories, footwear,
and household textiles. By the end of fiscal year 2014 it has grown out to a company with
commercial activities in 88 markets all over the world. The products are sold in
brick-and-mortar stores and online through eight commercial formats: Zara, Bershka, Massimo Dutti,
Pull&Bear, Stradivarius, Oysho, Uterqüe, and Zara Home. These brands all have their own stores and online sales platform. With more than 60% of Inditex’s total sales coming from
2
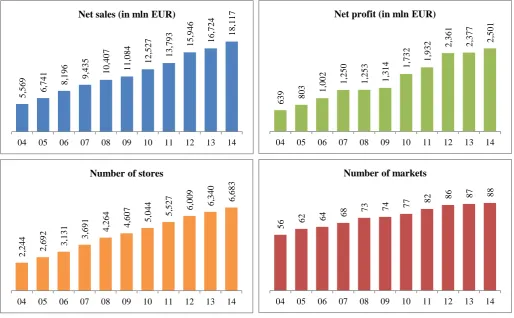
21 2 ,2 4 4 2 ,6 9 2 3 ,1 3 1 3 ,6 9 1 4 ,2 6 4 4 ,6 0 7 5 ,0 4 4 5 ,5 2 7 6 ,0 0 9 6 ,3 4 0 6 ,6 8 3
04 05 06 07 08 09 10 11 12 13 14
Number of stores
5 ,5 6 9 6 ,7 4 1 8 ,1 9 6 9 ,4 3 5 1 0 ,4 0 7 1 1 ,0 8 4 1 2 ,5 2 7 1 3 ,7 9 3 1 5 ,9 4 6 1 6 ,7 2 4 1 8 ,1 1 7
04 05 06 07 08 09 10 11 12 13 14
Net sales (in mln EUR)
639 803 1 ,0 0 2 1 ,2 5 0 1 ,2 5 3 1 ,3 1
4 1,7
3
2
1
,9
3
2 2,3
6 1 2 ,3 7 7 2 ,5 0 1
04 05 06 07 08 09 10 11 12 13 14
Net profit (in mln EUR)
56 62 64
68 73 74
77 82
86 87 88
04 05 06 07 08 09 10 11 12 13 14
Number of markets
Zara in 2014, Zara can be labelled as its biggest format (Inditex, 2015). Figure 1 gives an
[image:24.595.41.556.152.470.2]overview of the performance of Inditex based on four indicators.
Figure 1: Inditex’s performance on four indicators (2004-2014)
Data source: Inditex (2010) & Inditex (2015)
What has not changed throughout the years is the position of the customer in Inditex’s
strategy. Inditex has stayed focused on carefully listening to the customer in order to be able
to produce desirable fashion (Inditex, 2016), which it offers at competitive prices. Essential
for the working of Inditex’s business model is the daily transmission of information coming from the customer’s voice from stores to the design department, which enables the company
to constantly and quickly update collections. Stores get new supplies between two and six
times on a weekly basis. This is realised by Inditex’s logistics system, which mainly relies on
centralised logistics centers that are spread across Spain. From there, products are constantly
distributed to stores all around the world (Inditex, 2015). Furthermore, “the business model
encompasses all the phases of the value chain: design, manufacturing and supply, distribution, logistics and retail sales” (Inditex, 2015, p. 237). This vertical integration of the supply chain
22 (Inditex, 2015). Regarding sustainability, the eco-efficient store project stands out, which
started in 2008 with the openings of the first such store (Inditex, 2009). In subsequent years, a
number of stores received demanding certification for their sustainable architecture and the
aim to reach 100% of the stores being eco-efficient by 2020 emerged (Inditex, 2015).
Inditex’s business model is also extensively analysed by others, mainly caused by its success.
Buck (2014) labels Inditex as one of the most outstanding stories of corporate success of the past few years. From such analyses some additional characteristics that typify Inditex’s
business become evident. Given the aforementioned information on Inditex’s business model,
it is obvious that it is based on a strategy of fast fashion. Although Inditex itself does not use
that term in the annual report of 2014 to describe their strategy (Inditex, 2015), by others it is
called a fast fashion leader (Hansen, 2012; Buck, 2014). A remarkable fact about Inditex,
which is in contrast with most of its rivals, is that it hardly does any advertising. Instead, it
tries to attract customers by its well-designed stores for which appealing locations are chosen
(Crofton & Dopico, 2007; Hansen, 2012; Buck, 2014). Another business choice of Inditex is
to produce most pieces only in relatively small quantities, and to refrain from reproduction,
even of very successful items (Butler, 2013; Buck, 2014). This forces people to immediately
buy the product they like. Furthermore, it is important to note that Inditex deviates from the
industry norm by producing over 50% of its products in proximity to its headquarters, in
countries such as Spain, Portugal, and Morocco (Inditex, 2015), were labor is relatively costly
(Hansen, 2012). Inditex is a company that not only outsources manufacturing, but it also owns
production facilities, which are all located in Spain (Hansen, 2012; Inditex, 2015). Speed to market is Inditex’s most important motivation of keeping production close to home (Spinks,
2014). In some cases the design to retail cycle is merely two weeks (Buck, 2014). The
preference of Inditex for speed over low wages allows it to save costs on inventory. Since
restocking stores is done frequently but only with small amounts of products at the same time,
inventory can be kept relatively low (Crofton & Dopico, 2007).
4.1.2 Description of H&M
The history of H&M Hennes & Mauritz AB goes back to 1947, when Erling Persson opened ‘Hennes’, a store selling clothing for women, in Sweden. When in 1968 Persson decided to
acquire the store Mauritz Widforss, the name Hennes & Mauritz was born and it marked the
start of the addition of selling mens- and childrenswear. As of 2007 H&M started to expand
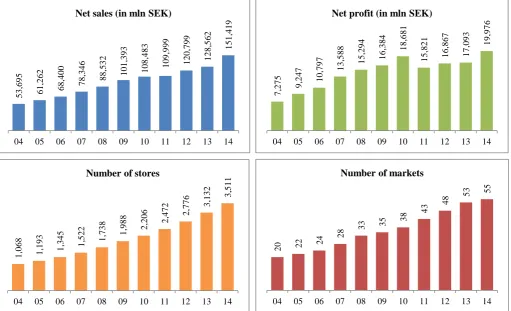
23 1 ,0 6 8 1 ,1 9 3 1 ,3 4 5 1 ,5 2 2 1 ,7 3 8 1 ,9 8 8 2 ,2 0 6 2 ,4 7 2 2 ,7 7 6 3 ,1 3 2 3 ,5 1 1
04 05 06 07 08 09 10 11 12 13 14
Number of stores
20 22 24
28
33 35 38
43
48 53
55
04 05 06 07 08 09 10 11 12 13 14
Number of markets
5 3 ,6 9 5 6 1 ,2 6 2 6 8 ,4 0 0 7 8 ,3 4 6 8 8 ,5 3 2 1 0 1 ,3 9 3 1 0 8 ,4 8 3 1 0 9 ,9 9 9 1 2 0 ,7 9 9 1 2 8 ,5 6 2 1 5 1 ,4 1 9
04 05 06 07 08 09 10 11 12 13 14
Net sales (in mln SEK)
7 ,2 7 5 9 ,2 4 7 1 0 ,7 9 7 1 3 ,5 8 8 1 5 ,2 9 4 1 6 ,3 8 4 1 8 ,6 8 1 1 5 ,8 2 1 1 6 ,8 6 7 1 7 ,0 9 3 1 9 ,9 7 6
04 05 06 07 08 09 10 11 12 13 14
Net profit (in mln SEK)
brands are added: COS, Weekday, Monki, Cheap Monday, & Other Stories and H&M Home
(H&M, 2015a). Also, the product range is extended: “the H&M group’s business consists
mainly of sales of clothing, accessories, footwear, cosmetics and home textiles to consumers”
(H&M, 2015a, p. 60). These products can be bought by customers in stores, online or via
catalogues. Except for H&M Home, which sells through H&M, all formats have their own
stores and online shop. As for the stores, more than 90% belonged to the H&M brand at the
end of fiscal year 2014. The growth that H&M has experienced during past decades ensured
that the company at 30 November 2014 had a presence in 55 markets, some of them far away
[image:26.595.44.556.316.627.2]from Sweden, were the company has its headquarters (H&M, 2015a). Figure 2 provides an overview of H&M’s performance by looking at four indicators.
Figure 2: H&M’s performance on four indicators (2004-2014)
Data source:H&M (2009b), H&M (2010b), & H&M (2015a)
In its annual report H&M clearly highlights its business concept that has been in place since the beginning: “offer fashion and quality at the best price” (H&M, 2015a, p. 8). They state
that this concept has ensured that H&M nowadays is one of the leading global companies in
fashion business. Part of the strategy is that no factories are owned by H&M, but instead they
24 manufacture H&M’s in-house designed products. Efficient logistics and flexible planning make sure that the product range can be continuously adapted to consumers’ preferences.
Furthermore, H&M tries to establish itself as being the more sustainable pick, caused by more
and more awareness among customers. Concrete examples of sustainability initiatives are the significant use of organic cotton and ‘Garment Collecting’ (H&M, 2015a). The latter was
launched globally in 2013 and offers customers the possibility to hand in used clothes in
H&M stores, so that these can be recycled or reused. Customers are rewarded for their
participation by receiving a discount voucher for their next purchase. H&M was the first
company in the fashion world to realise such initiative (H&M, 2014a), labelled by Stock
(2013) as brilliant green marketing.
H&M is mentioned as one of the major players in fast fashion (Loeb, 2015; Sherman, 2015).
In order to be responsive to trends, its European suppliers generally produce products with
short lead times, i.e. trendy items from sub-collections, while longer-lead products are
sourced from Asia, i.e. items from less frequent primary collections. Furthermore, H&M’s
production offices, that are located near the suppliers in order to manage the sourcing, enable a quick response (Petro, 2012). The fact that most of H&M’s products come from low-wage
Asian countries supports H&M in offering cheap fashion, but it also represents a disadvantage
as customers are increasingly critical towards the use of cheap labour, which they link with
poor working conditions, especially since the collapse of a Bangladeshi garment factory that
killed over 1,100 people (Thomasson, 2014). Another aspect discussed by outsiders are
H&M’s marketing tactics of which the annual collection made in collaboration with a
well-known high-end designer is one example. H&M started this tradition in 2004 and, although it
makes up only a small percentage of total sales, it generates significant media attention for the
company (Rodionova, 2015; Sherman, 2015).
4.2 Data collection
In this study the ‘data’ consists of forward-looking information that Inditex and H&M provide
in their annual reports of 2004 until 2013. At first sight, collecting this data seems
straightforward, since it can be obtained from easily accessible annual reports. However, this
process proved to be not free from difficulties. Therefore, this section in detail describes the
25 Since 1974, H&M’s shares are listed on the Stockholm Stock Exchange (H&M, 2015a).
Inditex is listed on the Spanish Stock Exchanges as from 2001 (Inditex, 2015). Because both
are listed companies, their annual reports can easily be obtained from their company
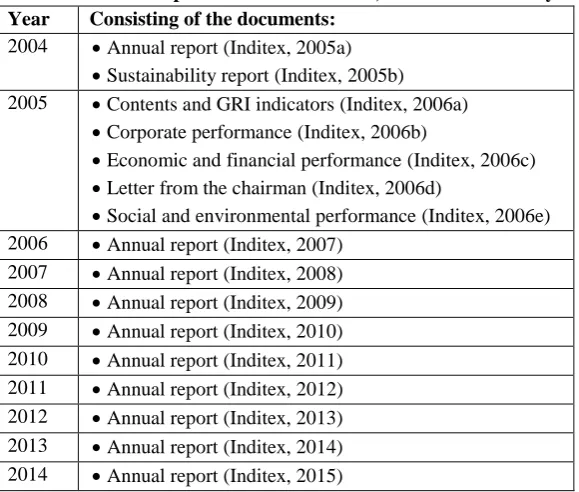
websites.3 In several cases, specific parts of the companies’ annual reporting are provided in separate documents. For example, H&M provide their sustainability report in a separate
document, while for Inditex this part is integrated in their annual reports for most years. In
such cases the different documents are merged into one document, which makes them
comparable and much easier to work with, especially for the monitoring process. Table A and
Table B in the Appendix provide an overview of the documents that have been merged per
year for Inditex and H&M respectively.4
At first, it has been tried to gather the data by searching through the entire annual reports for
keywords that are likely to indicate a unit of forward-looking information, such as ‘expect’, ‘future’, ‘will’, and ‘forecast’. Using keyword searches to gather forward-looking information
is not unusual, since it is applied by multiple other scientists in the field (e.g. Hussainey,
Schleicher, & Walker, 2003; Li, 2010; Wang & Hussainey, 2013; Muslu et al., 2015).
However, it did not seem to work for the purpose of this study. A countless number of
forward-looking information units was found using this method and considering the
time-consuming nature of the rest of the research it was not feasible to include all these units as
data. Moreover, it could be argued that lots of the statements found were likely to be labelled
as irrelevant by investors. The following citations from Inditex’s annual report of 2013 serve
as examples to illustrate this point:
“The 2013 Report shows a positive evolution of the level of commitment to reporting on
this indicator with the publication of information on training hours in the form of
country-level statistics. Thus, this indicator is expected to be fully incorporated by
2017.” (Inditex, 2014, p. 289)
“In 2014, another two workshops will be performed focusing on efficient water use and sustainable waste management, respectively.” (Inditex, 2014, p. 80)
The above justified changing the data source from the full text to only some relevant sections
of the annual report. Important in the selection of the specific sections is that it must be likely
that they contain forward-looking information. In addition, they have to focus mainly on
3 Inditex: http://www.inditex.com/home. H&M: http://about.hm.com/en/About.html. 4