How do leader facial expressions, and affective and
cognitive trust in the leader, affect follower
perceptions of leadership effectiveness?
Author: Pia Loeper
University of Twente
P.O. Box 217, 7500AE Enschede
The Netherlands
Abstract
The present study examines the effect of facial expressions on followers’ level of affective and cognitive trust in the leader and leadership effectiveness, perceived by followers. The sample consists of 20 leaders, operating in a large public-sector organization. In order to observe facial expressions, the leaders’ nonverbal behaviors were video-recorded, during a regularly occurring staff meeting. The research design includes surveys, filled out by followers and experts. The results show that there are correlations between negative facial expressions and affective trust, transformational and transactional leader behavior and leadership effectiveness. Furthermore, it is found that positive emotional displays such as smiling by leaders during meetings, have a positive effect on follower job satisfaction.
Supervisors:
Drs. J.G.W.L. Smits
Prof. Dr. C.P.M. Wilderom
Keywords
Leadership effectiveness, facial expressions, cognitive and affective-based trust, effect of smiling and lowered eyebrows, transformational-, transactional leadership behavior
Permission to make digital or hard copies of all or part of this work for personal or classroom use is granted without fee provided that copies are not made or distributed for profit or commercial advantage and that copies bear this notice and the full citation on the first page. To copy otherwise, or republish, to post on servers or to redistribute to lists, requires prior specific permission and/or a fee.
9th IBA Bachelor Thesis Conference, July 5th, 2017, Enschede, The Netherlands.
1.0 Introduction
The essence of leadership in organizations is to accomplish shared objectives by influencing and facilitating collective and individual efforts (Yukl, 2012). Effective leadership is a crucial factor for organizational success (Khan & Anjum, 2013). A leader’s effectiveness is for a greater part, based on his or her social influence. This social influence is shaped by the interaction and communication with followers (Engel & Lord, 1997). Leaders can affect organizational performance through inducing employees attitude, contribution and commitment. Managers can express themselves by means of verbal and nonverbal behavior. Various researchers underline the importance of nonverbal behavior, for instance, Bonnacio and colleagues (2016), state that body language transmit up to 65-93% of the total message. People even use body language without being aware of it, body language is constantly perceived and interpreted by others (Mandal, 2014). Nonverbal behavior includes all communicative acts except speech. One of these nonverbal behaviors concerns facial expressions, which are used in any conversations to modify the verbal utterance (Cunningham et al., 2004). Eyebrow movements, mouth movements and eye gazing are some examples of facial expressions. A leader can utilize these facial expressions to communicate with his followers, for instance, a leader’s bright smile could express his supportiveness or approval. Moreover, it can convey information about someone’s personal state and intentions (Krumhuber et. al., 2007). Numerous studies signify that a smiling person is perceived to be more attractive and intelligent (Lau, 1982). Furthermore, research has shown that smiling can affect someone’s trust in a person (Dong et. al., 2014). Therefore, nonverbal behavior is a crucial aspect of communication and must be included as a component of effective leadership. However, there is a gap in the scientific literature regarding the relation between nonverbal behavior and leadership effectiveness. Therefore, the present study examines how leaders’ facial expressions and the two dimensions of trust in the leader, affect follower perceptions of leadership effectiveness. In order to do so, we use a cross-sectional study design with 3 different data sources: (1) experts rated leader’s effectiveness, (2) a survey measured follower’s perception of the leadership effectiveness and (3) a systematic video-based coding was used to detect leader’s nonverbal behavior during a regular meeting. In other words, we examined the frequency and duration of leaders’ facial expressions such as eyebrow and mouth movements and attempt to find a relation between trust in the leader, both cognitive and affective-based and leadership effectiveness. The overall specific research question is: How do leader facial expressions, and affective and cognitive trust in the leader, affect follower perceptions of leadership effectiveness? By this, we aim to contribute to the leadership theory by examining if displaying positive facial expressions can affect trust in the leader and followers’ perception of leadership effectiveness. This study is unique as we not only use a survey measurement approach but also video-based field observations, which are inter-reliably coded. This research design avoids common source bias, as a diversity of methods and sources is used.
2.0 Theoretical framework and Hypotheses 2.1 Facial expressions
Conversing with others is one of the most central of human behavior (Bellou & Gkorezis, 2016). In any conversation, humans use facial expression to help modify their verbal
utterance to control the flow of a dialog, or to convey complex intentions without saying a word (Cunningham et. al., 2004). Being able to decode, or ‘‘read’’ facial expressions helps us to interpret others’ emotions and intentions in social interactions and to modify our behavior accordingly (Korb et. al., 2014). Even if nothing is said, facial expressions still send a message that influences perception, impression and image (Meindl et al., 1985).
her sample of well-acquainted students, and that smiling was more a signal of affiliation than of subordination.
2.2 Trust – cognitive and affective based trust
In essence, trust is a feeling of security that is based on beliefs. “Where there is trust, there is the feeling that others will not take advantage of me” (Porter et. al, 1975, p.497). Research has shown, that trust is important for sustaining individual and organizational effectiveness (McAllister, 1995). Having trust in the leader and the organization is essential for building relationships where one can depend on one another (Jong & Elfring, 2010). Within the literature of trust, there is found to be consensus about distinguishing trust into two dimensions. Johnson-George & Swap (1982) named these two dimensions of trust, ‘reliableness’ and ‘emotional trust’, Rempel et al., (1985) called it ‘dependability’ and ‘faith’ and finally, McAllister (1995) labeled it as ‘cognitive-based’ and ‘affective-based trust’. They, all agree that trust is built by (1) having faith and believing in one’s capabilities and competence and to undoubtedly rely on it and (2) by founding emotional bonds with genius care and concern for the welfare (Pennings & Woiceshyn, 1987). In this study, to assess interpersonal trust, we will use the two-dimensional model of cognitive and affective-based trust by McAllister (1995). McAllister (1995) explains that, choosing to trust can be seen as a process by which one determines that an individual or an organization is trustworthy. He or she is doing this by considering empirical evidence or past track records of peers. Colquitt and colleagues (2007) agrees that a cognitive-based process is needed for individuals to gain ‘proof sources’ that provide the reliable evidence regarding the trustworthiness of others. Therefore, to determine whether followers have cognitive-based trust in the leader is affected by his/her past and key characteristics such as competence, reliability and integrity. Complementary to its cognitive base, affective-based trust consists of an emotional base. People make investments in relationship and hope that these are reciprocal (McAllister, 1995). Jones & George (1998) argue that trust begins with one party suspending belief that the other party may not be as trustworthy as there is no evidence to cognitively evaluate. The process starts with affective responses such as instincts, institutions and feelings in order to arrive at some determination of trustworthiness of the other party (Morrow et. al., 2004).
2.2.1 Is trust won with a smile?
Is it that a smiling face is more trustworthy? Decisions regarding whether a person is trustworthy, irrespective of whether he or she is smiling, can be precisely made, based on facial features within 100ms (Todorov, Pakrashi, & Oosterhof, 2009). Keltner & Bonanno (1997) came to the same conclusion that facial displays of happiness, such as smiling and laughing promote affiliative tendencies in the observer and are connected with approach-related behavior. When deciding whether to trust a person, research suggests that we continue to adjust our decision making over the course of repeated interactions, tracking changes in a social partner’s behavior. In other words, a person’s facial display of emotion might be incongruent with the behavior and therefore we seek proof to trust by checking past events and repetitive behavior. Campellone & Kring (2013) used a trust game to investigate how people make decisions about whether to trust a social partner. They came to the conclusion that participant decisions of trust were initially associated with facial features but subsequently with the
player’s behavior. When we apply these findings to our current study, we can hypothesize that leaders that display facial emotions such as smiling or laughing are ranked more trustworthy. Subsequently, they will be judged as being trustworthy by their behavioral interaction. Therefore, the first hypothesis is:
H1: The more frequent a leader smiles during staff-meetings will be positively related to the level of follower’s affection and cognition-based trust in their leader.
2.3 Transformational, transactional and effective leadership
Most of the literature distinguishes between two major leadership styles that are effective: (1) Transformational and (2) Transactional leadership. Managers who lead their employees in a transformational way, may appear to be more charismatic (Ding et. al, 2017). The reason for that is the freedom they give to their employees. There is room for self-development and skills-enrichment (Bass & Riggio, 2006). Followers are able to engage in creative activities, takeover responsibilities and are more motivated to go the extra mile as they know, their work will be appreciated (Ebrahim, 2016). In contrast, transactional leaders reward their followers when specific objectives are met and give punishment for poor performance. These rewards are usually tangible such as money and status (Cashdan, 1998). Bass (1990) characterizes a transactional leader as one which focuses on transactions between leaders and employees. Two dimensions that characterize transactional leadership style are contingent reward and management by exception. Contingent reward leadership is rewarding employees when the desired objective is achieved. Management by exception is separated into two parts (1) active and (2) passive (Lyndon & Rawat, 2015). Active management consists of watching and searching for deviations from rules and standards in order to prevent mistakes. Whereas passive management by exception only interacts when mistakes are made. Bass and Avolio (1995) presented that leaders who use management by exception lacks both inspirational appeal and motivational power. In contrast, transformational leadership is classified into 4 characteristics: (1) idealized influence, (2) inspirational motivation, (3) individual consideration and (4) intellectual stimulation (Bass, 1990). Idealized influence means that followers identify with their leaders and respect them. Inspirational motivation refers to creating and communicating an attractive vision of the future, so that organizational goals are commonly shared and understood. Individual consideration address the uniqueness of employees, which increases the individual strength (Yukl, 1999). Lastly, intellectual stimulation means that new thinking patterns are encouraged. Followers are challenged to rethink their problem-solving approach and to strive for solutions by considering a problem from different perspectives (Avolio & Bass, 1995). In the present research, we mainly focus on leadership effectiveness and transformational and transactional leadership. Hence, the following hypothesis is formulated:
2.4 Relationship between leadership behavior and smiling and trust
Facial expressions such as smiling and laughing are considered to promote positive emotions (Joseph et al., 2015) Positive emotions are seen as contagious and positively affect other characteristics such as work climate and atmosphere, which in turn effect job satisfaction, organizational commitment and employee performance. Considering these links, would it mean that leaders could be more effective by displaying positive facial expressions? Transformational leaders are seen to be as more charismatic than their counterparts, transactional leaders. This might be due to the fact, that transformational leaders display empathy, are considered to be inspiring and enhance empowerment. They enhance empowerment by assuring followers of their own competencies and to provide opportunities to experience success (Behling, 1996). Since, transformational leaders are supposed to positively affect, work climate and job satisfaction, we hypothesis that it positively relates to displaying positive facial expressions. Therefore, we hypothesize that:
H3: Leaders who score high on transformational leadership also show more smiling (both, closed and open smile) behaviors during staff-meetings.
Moreover, we suspect to find a positive relationship between transformational leaders and interpersonal trust. As transformational leaders give their followers the autonomy of decision making and the option of expressing creativity, they show their trust in followers, which probably will be reciprocal. Thus, the hypothesis:
H4: Leaders who score high on transformational leadership also are more considered trustworthy at both dimensions, cognitively and affectively, by their follower.
3.0 Methods Research Design
This study has a cross-sectional design with 3 different data sources: (1) experts rated leader’s effectiveness, (2) a survey measured follower’s perception of the leadership effectiveness and (3) a systematic video-based coding was used to detect leaders’ nonverbal behavior during a periodic meeting. This research design avoids common source bias, as a diversity of methods and sources is used (Podsakoff, McKenzie & Erlbaum, 2012).
Sampling and data collection
Data was collected from one large Public-service Organizations, which operate nationally wide. The sample comprised 20 leaders with an average age of (M = 52, SD = 5.5), ranging from 34 to 64 years, a gender ratio of 3 females to 17 males and an average job tenure of 23.4 years (SD= 17.5). A randomly chosen meeting was videotaped in order to code the leaders’ and followers’ behavior. Immediately after the meeting, the participating followers were asked to fill in a survey about their demographical information. The follower subsample comprised 192 followers with an average age of (M = 49, SD = 10.1), ranging from 25 to 64 years, a gender ratio of 133 males to 59 females and an average job tenure of 25.7 years (SD = 13.72). Within the
sample, all followers filled out the survey, thus the response rate is 100%
3.1 Measures
Leadership effectiveness
Leadership effectiveness is measured by two distinctive groups: followers and experts. The followers are the leaders’ subordinates and the experts their supervisors. The group of experts consisted of 3 supervisors per leader, that individually and independently scored the leaders on their overall effectiveness. This overall effectiveness score was rated on a scale of 1 (highly ineffective) to 10 (highly effective). The followers, (leaders’ direct team-members) judged leadership effectiveness using four items from the MLQ 5X-short package (Avolio & Bass, 1995). The four items are formulated as follows: ‘My leader is leading our team effective’, ‘My leader is effective in meeting my job-related needs’, ‘My leader is effective in meeting organizational requirements’ and ‘My leader is effective in representing my team at a higher authority’. The response categories range from 1 (never) to 7 (always). Cronbach’s alpha for this construct was .91.
Affective and cognitive trust
Trust in the leader was measured with the aid of McAllister’s (1995) developed scale of affective and cognitive trust. The measure consists of 11 items, 5 measuring levels of affect-based trust and 6 measuring levels of cognition-based trust, where the respond categories range from 1 (strongly disagree) to 7 (strongly agree). The items for assessing affect-based trust consist of statements such as: ‘We have a sharing relationship. We can both freely share our ideas, feelings and hopes’ and ‘I can talk freely to this individual about difficulties I am having at work and know that she/he will want to listen’. For assessing cognition-based trust, the items consist of statements such as: ‘This person approaches his/her job with professionalism and dedication’, ‘Given this person’s track record, I see no reasons to doubt his/her competence and preparation for the job’ and ‘I can rely on this person not to make my job more difficult by careless work’. Followers rated their trust perception of the leader by scoring the items on a scale from 1 (completely disagree) to 7 (completely agree). Cronbach’s alpha for affective-based and cognitive-based trust were .87 and .93.
Facial expressions – eyebrow and mouth movements
bias and also reactivity assumptions were opposed by asking the followers whether the leaders’ behavior during the staff meeting was representative. The respond categories ranged from 1 (not representative) to 7 (highly representative). The Cronbach’s alpha for this construct was .83.
Facial expressions were distinguished into 2 movements, (1) eyebrow movements and (2) mouth movements. These two movements were observed based on a detailed coding scheme and a specialized video-observation software from Noldus Information Technologies, called “The Observer TX” (Noldus, Trienes, Hendriksen, Jansen, & Jansen, 2000; Spiers, 2004). For this study, two students coded independently the movements of eyebrows and mouth, their frequencies and duration. Eyebrow movements were subdivided into categories such as (1) raised, (2) lowered and (3) mixed eyebrow movements. Mouth movements ranged from (1) open smile to (2) closed smile and (3) lip corners down.
3.2 Coding scheme
The nonverbal behaviors of middle managers were observed based on a coding scheme. This coding scheme categorizes 4 behavioral movements: (1) body orientation, (2) hand movements, (3) eye gaze and (4) mouth and eyebrow movements and subdivides them into more specific gestures and cues. In total, 19 behaviors are distinguished. In this study, the focus is on mouth and eyebrow movements (see Table 1).
Table 1: Coding scheme for facial expressions such as mouth and eyebrow movements
Category Behavior Operationalization Mouth
movements
Open smile
Closed smile
Lip corners down
The mouth corners are drawn up and out, and the upper lip is raised showing parts or all of the teeth. Also, referred to as broad or wide smiles
The mouth corners are slightly drawn up and outwards, while the teeth remain covered by the lips
The mouth corners are lowered downwards, with the lips covering the teeth. Sometimes co-occurs with stiffening or pressing of the lips.
Eyebrow movements
Raised eyebrows
Lowered eyebrows
Mixed eyebrows movements
Both eyebrows are lifted upwards.
Both eyebrows contract and move towards the nose.
One Eyebrow is lifted and the other is lower.
3.3 Coding procedure
Nonverbal behavior consists of numerous micro behaviors that can simultaneously be signaled through different channels (Ekman, 2004). In order to code these micro behaviors precisely, the process of coding was divided into groups (1) body orientation, (2) hand movements (3) eye gaze and (4) eyebrow and mouth movements. A total number of 8 students coded each independently 20 videos with a time length of 30 minutes. Pair-wisely, the students concentrated only on one of the 4 categories within the coding scheme to assure coding accuracy. Conversely to natural (non-videotaped) nonverbal behavior observation, the coding within one category is mutually exclusive. For instance, an open smile cannot be simultaneously coded with a closed smile. In order to agree on the interpretation of specific behaviors, the students were trained beforehand. This training included: (1) understanding the coding scheme and (2) aiming for an agreement above 80%. This was done by coding independently a few minutes of a random selected video. To compare the trial videos, the program “The Observer XT” (Noldus, Trienes, Hendriksen, Jansen, & Jansen, 2000; Spiers, 2004) was used. This program displays a comparison list where agreements and disagreements are shown. Disagreements were solved by reaching consensus regarding coding definitions. As soon as sufficient agreement was conducted, the actual video coding began.
3.4 Inter-rater reliability
[image:5.595.77.292.449.730.2]even having discussed them. For mouth and eyebrow movements, the initial number of agreements per video was lower than for body orientation, with an average kappa (κ) of .37. However, by reviewing the coding scheme, consensus was found, which increased the average kappa (κ) to .93.
3.5 Data analysis
To test the 4-stated hypothesis, we firstly conducted a correlation analysis. In this analysis, an alpha level of .05 is employed. The hypotheses, which have shown a positive or negative correlation were further tested through a regression analysis. Finally, two extreme score analysis between the 5 most and the 5 least effective leaders and: (1) the smiling
behavior and (2) affective and cognitive trust in the leader, were executed by running a ANOVA test.
4.0 Results
4.1 Descriptive statistics
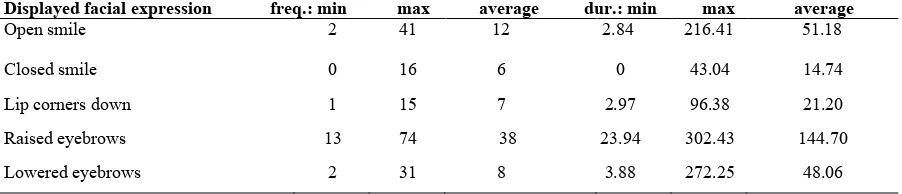
[image:6.595.81.532.276.373.2]Table 2 shows an overview of the leader’s facial expressions during video-coded meetings. In total, 20 leaders and their facial expressions (e.g. mouth and eyebrow movements) were observed. The table shows the frequency and duration of each facial cue. The expression that appeared the most and longest were raised eyebrows (38 times in total and 144.7s on average). The one, that appeared the least and for the shortest time were lip corners down (7 times and 21.20s on average). Furthermore, we can see that leaders did smile more open and for longer than they did with a closed smile.
Table 2: How often and for how long (min., max. and on average) the leaders display facial expressions (n=20, total video length 1800s)
Displayed facial expression freq.: min max average dur.: min max average
Open smile 2 41 12 2.84 216.41 51.18 Closed smile 0 16 6 0 43.04 14.74 Lip corners down 1 15 7 2.97 96.38 21.20 Raised eyebrows 13 74 38 23.94 302.43 144.70 Lowered eyebrows 2 31 8 3.88 272.25 48.06
Table 3 illustrates the different smiling behavior per gender. These findings imply that female leaders smile openly more often than male leaders, although male leaders surprisingly tend to smile more often in a closed manner. The duration
of the smiling is accordingly to the frequency of the smiling. Women tend to smile more openly and for longer, whereas men tend to smile more closely and for longer on average.
Table 3: The smiling effect on gender
Gender Mouth movement
Open smile frequency Open smile duration Closed smile frequency Closed smile duration
Male 9 39,70s 6 16,65s
Female 25 116s 2 3,90s
4.2 Correlation - facial expressions and key variables
Table 4 illustrates the correlation between leaders’ facial expressions and followers’ perception of the key variables such as trust (cognitive and affective), leadership style (transformational and transactional) and overall leadership effectiveness. A Pearson’s correlation (two-tailed) was executed to test for significant value (< .05). As shown in table 4, we did not find a significant correlation between smiling and the variables: trust, transformational and transactional leadership and leadership effectiveness. This means that we reject the hypothesis H1, which states that the more frequenta leader smiles during staff-meetings will be positively related to the level of follower’s affection and cognition-based trust in their leader
Interestingly, there are a few negative correlations found in relation with lowered eyebrows. Firstly, we can see a negative relationship between the frequency of lowered eyebrows and affective trust in the leader (r= -.44, p<.05). Secondly, both, frequency and duration of lowered eyebrows are negatively correlated with transformational leadership (r= -.51, p<.05 and r= -.46, p<.05). Lastly, again both, frequency and duration of lowered eyebrows are negatively correlated with leadership effectiveness (r= -.60, p<.05) and (r= -.52, p<.05).
[image:6.595.88.546.702.759.2]
Table 4: Correlation between facial expressions and key variables
Facial expressions Cognitive trust in Leader
Affective trust in Leader
Transformational Leadership
Transactional Leadership
Closed smile freq. -.21 -.22 -.27 -.15 -.29 Closed smile du. -.29 -.30 -.37 -.16 -.40 Lip corners down freq. -.06 -.08 .02 .06 .04 Lip corners down du. .01 .05 .06 .05 -.10 Raised eyebrows freq. .08 -.01 .25 -.21 .17 Raised eyebrows du. .13 .15 .25 -.12 .16 Lowered eyebrows freq. -.37 -.44* -.51* -.06 -.60** Lowered eyebrows dur. -.36 -.34 -.46* -.01 -.52*
*p < .05. **p < .025. ***p < .001
4.3 Regression analysis – the leadership styles’ impact
In order to test hypothesis H2, H3 and H4, linear regression analyses were conducted. Table 6 shows a significant regression equation between transformational leadership and the tested variables. The hypothesis H2, which states that leaders who score higher on transformational leadership, are also rated higher on leadership effectiveness by followers, compared to more transactional leaders, finds support (also see table 7).
H3, stating that leaders who score high on transformational leadership, also show more smiling (both, closed and open
smile) behaviors during staff-meetings cannot be supported. There was no significant regression equation between smiling behavior and transformational leadership shown. The last hypothesis H4, which states that leaders who score high on transformational leadership, also are more considered trustworthy at both dimensions, cognitively and affectively, by their follower is supported by the findings (see table 6). The results of the regression analysis are significant.
*p < .05. **p < .025. ***p < .001
*p < .05. **p < .025. ***p < .001
Since, there is no relation found between smiling behavior and leadership effectiveness, but for lowered eyebrows movements, we executed a regression analysis. The results, displayed in Table 8, show that the frequency of lowered eyebrows is significantly (negatively) related to affective
trust, transformational leadership and leadership effectiveness. For cognitive trust, there was no significant regression equation found.
[image:7.595.78.545.402.467.2]*p < .05. **p < .025. ***p < .001
Table 6: Results of regression analysis regarding transformational leadership
Transformational leadership
Variables B SE B β T p
Affective trust in leader .818 .091 .904*** 8.95 .00 Cognitive trust in leader 1.05 .13 .89*** 8.14 .00 Leadership effectiveness
perceived by followers
[image:7.595.77.544.510.581.2]1.37 .18 .87*** 7.60 .00
Table 7: Results of regression analysis regarding transactional leadership
Transactional leadership
Variables B SE B β T p
Affective trust in leader .69 .16 .72*** 4.35 .00 Cognitive trust in leader .92 .21 .73*** 4.46 .00 Leadership effectiveness
[image:7.595.76.547.680.747.2]perceived by followers 1.09 .30 .65*** 3.62 .00
Table 8: Results of regression analysis
Lowered eyebrows frequency
Variables B SE B β T p
Affective trust in leader -.03 .02 -.44* -2.065 .05 Transformational leadership -.04 .02 -.51* -2.533 .02 Leadership effectiveness
perceived by followers
Given the fact, that lowered eyebrows are negatively related to leadership effectiveness, affective trust and transformational leadership, we wanted to test whether the same applies to ‘general negative facial expressions’. Therefore, we averaged lip corners down (frequencies /durations) with lowered eyebrows (frequencies/durations) and ran a regression analysis. For affective trust and transformational leadership, there was no significant regression equation found. Regarding, the perceived leadership effectiveness by followers, a simple linear regression was calculated to predict leadership effectiveness, based on ‘negative facial expressions’. A significant (negative) regression equation was found (F(1.18)=6.15, p<.05), with an R2 of .255 (β= -.505). Besides the negative regression equation of ‘negative facial expressions’ and leadership effectiveness, a positive equation was found. A simple linear regression was conducted to predict job satisfaction, based on open smiling behavior. A significant (positive) regression equation was found for the frequency of open smiles (F(1.18)=6.43, p<.05), with an R2 of .263 (β=.513) and the duration of open smiles (F(1.18)=7.77, p<.05), with an R2 of .302 (β=.549). Finally, we ran an extreme score analysis for leadership effectiveness to test whether the 5 most and the 5 least effective leaders vary significantly on smiling. We run the extreme score analysis separately for leadership effectiveness, using (1) experts’ ratings and (2) followers’ perceptions. The results of the ANOVA test were not significant.
The same extreme score analysis was executed for affective trust to test whether the most trustworthy (affective based) leaders show similar smiling patterns. The 5 leaders that scored highest on affective trust and the 5 leaders that scored the lowest on affective trust were compared. The ANOVA test did not display significant results.
5.0 Discussion
This presented study examined the nonverbal behavior of 20 leaders, working in a large public-service organization, that operates nationally wide. The meetings, differing from team-member size, were video-recorded. This observation method is still not that common in leadership studies, probably due to the fact, that it is highly extensive and takes a lot of time to employ. Moreover, we used surveys to rank leaders’ effectiveness, perceived by followers, but also to assess further variables such as trust in the leader, job satisfaction, transformational and transactional leadership. Expert’s that are familiar and well-acquainted with leaders’ performance, scored their leadership effectiveness on a scale, ranging from 1 to 10, where 10 stands for highest effectiveness. The study was guided by the research question: How do facial expressions, and affective and cognitive trust in the leader, affect follower perceptions of leadership effectiveness. To examine this hypothesis, bivariate correlations and simple, linear regression analyses were run, including the variables such as: affective and cognitive trust, transformational and transactional leadership, leadership effectiveness and the observed facial expressions (open smile, closed smile, lip corner down, raised eyebrows and lowered eyebrows). The results did not support the hypothesis that smiling has an impact on trust in the leader and leadership effectiveness. However, there was found a relation between lowered eyebrows and affective trust in the leader, transformational leadership and leadership effectiveness. That would mean, that although
positive facial expressions such as smiling do not have an impact, lowered eyebrows have one. To examine this relationship further, we computed a new variable “negative facial expressions” by aggregating lowered eyebrows with lip corners down. The results show that, also there is found to be a relationship. Therefore, we ran a regression analysis which is significant. In sum, negative facial expressions are found to have an impact on trust, transformational- and transactional leadership and leadership effectiveness. It is reasonable to believe that negative facial expressions lead to having less affective trust in a person, which means, that these first intuitions of considering someone trustworthy are not given. This phenomenon was already found in studies, using trust games. In these trust games, the persons who smiled less, or seemed to be grumpy/angry were less engaged with (Campellone & Kring, 2013). Moreover, there was found to be a positive relationship between job satisfaction and displaying open smiles. Literature suggests that, smiling can be contagious and can entail positive outcomes (Vijayalakshmi & Bhattacharya, 2012). This result is not surprising, as in general, being surrounded by people that are in a good mood, affects overall satisfaction. Affective and cognitive trust are both significantly correlated with transformational and transactional leaders. Additionally, they are significantly correlated with leadership effectiveness, which however can be caused by using the same source (Podsakoff, McKenzie & Erlbaum, 2012). As followers scored their leaders on items based on transformational and transactional characteristics, the scores for cognitive and affective trust were therefore, probably almost the same. That means that, if a leader scored high on both transformational and transactional leadership, he/she consequently scored high on affective and cognitive trust. In order to prevent this common source bias, experts’ ratings on transformational and transactional leadership should be assessed, which in turn can be linked with followers’ perception of trust in the leader. This would give a more precise understanding of the relationship between leadership style and trust.
Literature suggest, that smiling differs per gender. According to LaFrance and collogues (2003), women tend to smile more often than men. The findings of this study find support for this. Female leaders smiled openly more often, whereas men tend to smile in a closed manner, more often. The duration of the two different smiling behaviors differ accordingly. Women smiled openly on average longer and men smiled closely on average longer.
lip corners down have an impact on followers’ perception of leadership effectiveness.
These findings can be useful for leaders to become aware of their facial expressions.
5.1 Practical implications
The findings of this study can be used for future assessment and training of management. By video-coding leaders’ behavior, it can be precisely assessed how often and for how long behavior patterns are carried out. This is a rich data source, as different variables can be tested for correlation. Due to the fact, that these leaders were scored on leadership effectiveness by experts and followers, we could examine the most and least effecftive leaders and subsequently test for nonverbal behavior patterns, which are used by more effective and less effective leaders. When leaders become aware of which behavior has an impact on effectiveness, they can be trained to display these in regular staff meetings purposely. For instance, managers that regularly lower their eyebrows and lip corners during meetings tend to be less trustworthy and effective. Therefore, by becoming aware of it, might help less effective leaders to increase their performance.
5.2 Strength, limitations and future research
The strength of this study is the cross-sectional design with 3 different data sources. The video observation of regular staff meetings and the subjective surveys filled out by followers and experts. The use of different data sources and methods reduces common method bias. Besides the strength of this presented study, there are some limitations to be mentioned. Firstly, the surveys which were filled out by the followers were extensive and time-consuming, which could lead followers to rush through at the end. Additionally, the surveys measured followers’ perception only at one time, which is not precisely and can threat reliability. However, to oppose that threat, the results of the experts and followers can be compared to test whether the perception of both parties is mostly the same. Secondly, the cross-sectional nature of the study makes it more challenging to determine the true direction of causality between the variables used. To improve this, future research may implement a longitudinal study, which can help to assess the incremental development of the variables and causality. Thirdly, the small sample size can be an issue. The dataset for leader consists only of 17 males- and 3 female leaders. Especially, the gender ratio might be too limited in order to draw accurate relationships. Moreover, the leaders and followers were all of one nationality, operating in a public-sector organization, which limits the generalizability. Including, employees with dissimilar cultural backgrounds who operate as well as in public but also in private-sector organizations might have brought different insights. Further research should take these limitations into account. A bigger sample size with an increased number of female leaders should be focused on. Furthermore, the sample should consist of cultural diverse individuals that work in both public and private- sector organizations. Moreover, the surveys which capture the subjective opinion of experts and followers could be filled out in different time elapses, which would increase reliability.
6. Conclusion
The present study gives insight about the effect of displaying facial expressions and its relationship toward affective and cognitive trust and leadership effectiveness. Even though, there was no evidence found that displaying positive facial expression will increase the level of follower trust in their leader (both, affectively and cognitively) and their perceptions of leadership effectiveness, still the opposite was found to be true, which is a negative relationship between negative facial expressions and leadership effectiveness. This means, that the more the leader expresses negative facial cues such as lowered eyebrows and lip corners down, the less effective he or she is. These findings can be used for further assessment and training of management to increase individual performance.
7. Acknowledgement
I am grateful for having the possibility to be part of this interesting and inspiring study and I would like to thank my first supervisor Drs. Jacco Smits for all the help and useful feedback he gave me in order to accomplish my thesis. I am also grateful to my second supervisor Prof. Dr. Celeste Wilderom for her assistance throughout the process of writing this paper.
8. References
Avolio, B. J., & Bass, B. M. (1995). Individual consideration viewed at multiple levels of analysis: a multi-level framework for examining the diffusion of transformational leadership. Leadership Quarterly, 6(2), 199–218.
Bass, B. M., & Riggio, R. E. (2006). Transformational leadership (2nd ed.). Mahwah, NJ: Lawrence Erlbaum Associates.
Bass, B. M. (1990). From transactional to transformational leadership: Learning to share the vision. Organizational Dynamics, (Winter): 19-31. Behling, O., & McFillen, J.M. (1996). A Syncretical model
of Charismatic/Transformational Leadership.
Group and organizational management, 21(2)
Bellou, V. & Gkorezis, P. (2016). Unveiling the link between facets of positive nonverbal communication and perceived leader effectiveness: A moderated mediation model.
Human performance, 29(4), 310-330. doi: 10.1080/08959285.2016.1157597
Bonaccio, S., O’Reilly, J., O’Sullivan, S.L., & Chiocchio, F. (2016). Nonverbal Behavior and Communication in the Workplace: A Review and an Angenda for Research. Journal of Management. DOI: 10.1177/0149206315621146
Bonanno, G.A., & Keltner, D. (1997). Facial expressions of emotion and the course of conjugal bereavement.
J Abnorm. Psychology, 106(1), 126-137
Campellone, T.R., & Kring, A.M. (2013). Who do you trust? The impact of facial emotion and behavior on decision making. Cognition & Emotion, 27(4), 603-620.doi.org/10.1080/02699931.2012.726608 Carletta, J. (1996). Assessing agreement on classification tasks. Computational Linguistics,22(2), 249–254 Cashdan, E. (1998). Speech, and Body Posture: How
Women and Men display Sociometric Status and Power. Journal of Nonverbal Behavior, 22(4) Cavicchio, F., & Poesio, M. (2009). Multimodal corpora
scheme reliability. Lecture Notes in Computer Science,5509,109–121.
Colquitt, J.A., Scott, B.A., & LePine, J.A. (2007). Trust, Trustworthiness, and Trust Propensity: A Meta-Analytic Test of Their Unique Relationships with Risk Taking and Job Performance. Journal of applied Psychology, 92(4). doi: 10.1037/0021-9010.92.4.909
Cunningham, D., Kleiner, M., & Wallraven, C. (2004). The components of conversational facial expressions.
Association for Computing Machinery.
Ding, X., Li, Q., Zhang, H., Sheng, Z., & Wang, Z. (2017). Linking transformational leadership and work outcomes in temporary organizations: A social identity approach. International Journal of Project Management, 35, 543-556. doi.org/10.1016/j.ijproman.2017.02.005
Dong, Y., Li, Y., & Sun, T. (2014). Happy Faces Considered Trustworthy Irrespective of Perceiver’s Mood: Challenges to the Mood Congruency Effect.
Computer and Security. doi:
10.1016/j.cose.2014.04.010.
Ebrahim, R.Y.F. (2016). Leadership styles and Organizational Commitment: Literature Review.
Journal of Management Development, 35.
doi.org/10.1108/JMD-01-2015-0004
Engle, E, M., & Lord, R. G. (1997). Implicit theories, self-schemas, and Leader-Member Exchange. The Academy of Management Journal, 40(4), 988– 1010.
Ekman, P. (2004). Emotional and conversational nonverbal signals. Language, Knowledge and Representation
Ekman, P., & Friesen, W.V. (1982). Felt, false, and miserable smiles. Journal of nonverbal behavior, 6(4)
Erickson, F. (1992). Ethnographic microanalysis of interaction. In the Handbook of Qualitative Research in Education (pp. 201–225). New York, NY: Academic Press.
Hess, U., Beaupré, M.G., & Cheung, N. (2002). Who to whom and why – cultural differences and similarities in the function of smiles Issues, 16(1), 48-64
Johnson-George, C., & Swap, W.C. (1982). Measurement of Specific Interpersonal Trust: Construction and Validation of a Scale to Assess Trust in a Specific Other. Journal of Personality and Social
Psychology, 43(6), 1306-1317
Jong, B.A.D., Elfring, T. (2010). How does trust affect the performance of ongoing teams? The mediating role of reflexivity, monitoring, and effort.
Academy of Management Journal, 53(3), 535– 549
Jones, G.R., & George, J.M. (1998). The Experience and Evolution of Trust: Implications for cooperation and Teamwork. The Academy of Management Review, 23(3), 531-546
Joseph, D.L. (2015). Is a happy leader a good leader? A meta-analytic investigation of leader trait affect and leadership. The Leadership Quartely.
http://dx.doi.org/10.1016/j.leaqua.2015.04.001
Keating, C.F., & Bai, D.L. (1986). Children’s Attributions of Social Dominance from Facial Cues. Child Development, 57(5), 1269-1276
Keating, C.F., & Segall, M.H. (1977). Facial Gestures Which Influence the Perception of Status Authors.
American Sociological Association, 40(4), 374-378 Khan, S., & Anjum, M. A. (2013). Role of leadership style
and its impact on getting competitive advantage.
European Journal of Applied Sciences, 5(2), 53– 61.
https://doi.org/10.5829/idosi.ejas.2013.5.2.1114 Korb, S., With, S., Niedenthal P., Kaiser, S. & Grandjean,
D. (2014). The Perception and Mimicry of Facial Movements Predict Judgements of Smile Authenticity. PLoS ONE, 9(6).
doi:10.1371/journal.pone.0099194
Krumhuber, E., Manstead, A.S.R., & Kappas, A. (2007). Temporal Aspects of Facial Displays in Person and Expression Perception: The Effects of Smile Dynamics, Head-tilt, and Gender. J Nonverbal Behavior, 31, 39-46. DOI 10.1007/s10919-006-0019-x
LaFrance, M., Hecht, M. A., & Paluck, L. (2003). The Contingent Smile: A Meta-Analysis of Sex Differences in Smiling. American Psychological Association, 129 (2), 305-334
Lance, C.E., Butts, M.M., & Michels, L.C. (2006). The Sources of Four Commonly Reported Cutoff Criteria: What Did They Really Say? Sage Journal, 9(2)
Lau, S. (1982). The effect of smiling on person perception.
Journal of Social Psychology, 117, 63-67. Lyndon, S., & Rawat, P.S. (2015). Effect of Leadership on
Organizational Commitment. The Indian Journal of Industrial Relations, 51(1).
Mandal, F. B. (2014). Nonverbal Communication in Humans. Journal of Human Behavior in the Social Environment, 24(4), 417-421. doi:
10.1080/10911359.2013.831288
McAllister, D. J. (1995). Affect- and Cognition-Based Trust as Foundations for Interpersonal Cooperation in Organizations. Academy of Management Journal, 38(1), 24-59.
Meindl, J.R., Sanford, B.E., Ehrlich, S.B., & Dukerich, J.M. (1985). The romance of leadership.
Administrative science quarterly, 30(1), 78-102 Morrow, J.L., Hansen, M.H., & Pearson, A.W. (2004). The
Cognitive and Affective Antecedents of General Trust Within Coopertive Organizations. Journal of Managerial
Noldus, L.P.J.J., Trienes, R.J.H., Hendriksen, A.H.M., Jansen, H., & Jansen, R.G. (2000). The Observer Video-Pro: New software for the collection, management, and presentation of time-structured data from videotapes and digital media
files. Behavior Research Methods, Instruments & Computers, 32, 197-206
Otta, E., Abrosio, F. F. E., & Hoshino, R. L. (1996). Reading a Smiling Face: Messages Conveyed.
Perceptual and Motor Skills, 82. 1111-1121 Podsakoff, P. M., MacKenzie, S. B., & Podsakoff, N. P.
(2012). Sources of method bias in social science research and recommendations on how to control it. Annual Review of Psychology, 63(1), 539–569. https://doi.org/10.1146/annurev-psych-120710-100452
smiling is beautiful and good. European Journal of Social Psychology,20. 259-267.
Rempel, J.K., Holmes, J.G., & Zanna, M.P. (1985). Trust in close relationships. Journal of Personality and Social Psychology, 49, 95-112
Spiers, J. (2004). Tech tips: Using video
management/analysis technology in qualitative research. International Journal of Qualitative Methods, 3(1), 1–8
Todorov, A., Pakrashi, M., & Oosterhof, N.M. (2009). Evaluating face trustworthiness after minimal time exposure. Social Cognition, 27(6), 813-833 Trichas, S., & Schyns, B. (2011). The face of leadership:
Perceiving leaders from facial expressions. The Leadership Quarterly, 23(2012), 545-566. doi:10.1016/j.leaqua.2011.12.007
Vijayalakshmi, V., & Bhattacharyya, S. (2012). Emotional Contagion and its Relevance to Individual Behavior and Organizational Processes: A Position Paper. Journal of Business and Psychology 27(3), 363-374
Yukl, G. (1999). An evaluation of conceptual weaknesses in transformational and charismatic leadership theories. The Leadership Quarterly, 10(2), 285– 305.
https://doi.org/10.1016/S1048-9843(99)00013-2
Yukl, G. (2012). Effective Leadership Behavior: What We Know and What Questions Need More Attention.
Academy of Management Perspectives.