University of Warwick institutional repository: http://go.warwick.ac.uk/wrap
This paper is made available online in accordance with
publisher policies. Please scroll down to view the document
itself. Please refer to the repository record for this item and our
policy information available from the repository home page for
further information.
To see the final version of this paper please visit the publisher’s website.
access to the published version may require a subscription.
Author(s): Scott Weich, James Nazroo, Kerry Sproston, Sally McManus,
Martin Blanchard, Bob Erens, Saffron Karlsen, Miichael King,Keith
Lloyd,, Stephen Stansfield, Peter Tyrer
Article Title: Common mental disorders and ethnicity in England: the
EMPIRIC Study
Year of publication: 2004
Common mental disorders and ethnicity in England :
the EMPIRIC Study
S C O T T W E I C H*, J A M E S N A Z R O O, K E R R Y S P R O S T O N, S A L L Y MCM A N U S, M A R T I N B L A N C H A R D, B O B E R E N S, S A F F R O N K A R L S E N, M I C H A E L K I N G,
K E I T H L L O Y D, S T E P H E N S T A N S F E L DA N D P E T E R T Y R E R
Division of Health in the Community,Warwick Medical School,University of Warwick,Coventry CV4 7AL,
UK;Department of Epidemiology & Public Health,Royal Free & University College Medical School,
1-19 Torrington Place,London WC1,UK;National Centre for Social Research,35 Northampton Square,
London EC1V OAX,UK;Mental Health Research Group,Peninsula Medical School,Wonford House,Exeter EX2 5AF,UK;Department of Psychiatry,Barts and The London,Queen Mary’s School of Medicine and Dentistry,Medical Sciences Building,Mile End Road,London E1 4NS,UK;Department of Psychological
Medicine,Imperial College of Science,Technology and Medicine;Department of Psychological Medicine,
Faculty of Medicine,Charing Cross Campus,Fulham Palace Road,London W6 8RF,UK
ABSTRACT
Background. There is little population-based evidence on ethnic variation in the most common mental disorders (CMD), anxiety and depression. We compared the prevalence of CMD among representative samples of White, Irish, Black Caribbean, Bangladeshi, Indian and Pakistani individuals living in England using a standardized clinical interview.
Method. Cross-sectional survey of 4281 adults aged 16–74 years living in private households in England. CMD were assessed using the Revised Clinical Interview Schedule (CIS-R), a stan-dardized clinical interview.
Results. Ethnic differences in the prevalence of CMD were modest, and some variation with age and sex was noted. Compared to White counterparts, the prevalence of CMD was higher to a statistically significant degree among Irish [adjusted rate ratios (RR) 2.09, 95 % CI 1.16–2.95, p=0.02] and Pakistani (adjusted RR 2.38, 95 % CI 1.25–3.53,p=0.02) men aged 35–54 years, even after adjusting for differences in socio-economic status. Higher rates of CMD were also observed among Indian and Pakistani women aged 55–74 years, compared to White women of similar age. The prevalence of CMD among Bangladeshi women was lower than among White women, although this was restricted to those not interviewed in English. There were no differences in rates between Black Caribbean and White samples.
Conclusions. Middle-aged Irish and Pakistani men, and older Indian and Pakistani women, had significantly higher rates of CMD than their White counterparts. The very low prevalence of CMD among Bangladeshi women contrasted with high levels of socio-economic deprivation among this group. Further study is needed to explore reasons for this variation.
BACKGROUND
There is a dearth of research into ethnic variation in rates of the most common mental disorders
(CMD), anxiety and depression in Britain, compared with an extensive literature on psy-chotic disorders (Kinget al. 1994 ; Bhugraet al. 1997 ; Harrison et al. 1999). The Fourth National Survey of Ethnic Minorities (FNS) (Nazroo, 1997) compared rates of psychiatric disorder among White, Caribbean, Indian, Pakistani, Bangladeshi and Chinese groups in
* Address for correspondence : Professor Scott Weich, Division of Health in the Community, Warwick Medical School, University of Warwick, Coventry CV4 7AL, UK.
(Email : s.weich@warwick.ac.uk)
DOI : 10.1017/S0033291704002715 Printed in the United Kingdom
the UK, but used an abbreviated psychiatric interview. The prevalence of anxiety and de-pression among Black Caribbean and Pakistani informants in that study was similar to that of the White British group, while rates among Indian and Bangladeshi informants were lower than all three groups. ‘ Other ’ White informants (including but not restricted to those of Irish origin) had the highest rates of anxiety and depression. The aim of the current study was to compare the prevalence of CMD in nationally representative samples of the six largest ethnic groups (White, Irish, Black Caribbean, Bangla-deshi, Indian and Pakistani) in England, using a standardized clinical interview.
METHOD
Ethnic minority samples were drawn from the 1999Health Survey for England(HSE 99) (Erens et al. 2001). Over 31 000 addresses were selected in 340 postal sectors in England using a two-stage design based on the small user Postcode Address File (PAF). Sectors were stratified on the basis of ethnic composition. Focused enu-meration (Smith & Prior, 1997) was employed in one of three strata, comprising 178 sectors with between 1 % and 10 % of the resident popu-lation being Black Caribbean, Indian, Pakistani or Bangladeshi. In these sectors, interviewers screened for eligibility at each issued address and asked at the issued address whether any eligible persons lived at two addresses either side of the sampled address. Thus, five addresses were covered by each issued address. If any of the adjacent addresses was thought to include someone eligible, the interviewer made a per-sonal visit at the relevant addresses to carry out the full screening interview. Over 64 000 ad-dresses were sampled in total, and up to four adults were selected at random within each household containing residents from the selec-ted ethnic minority groups using the Kish grid method (Kish, 1965). A fuller description of the sampling methods can be found elsewhere (Erens et al. 2001 ; Sproston & Nazroo, 2002). Ethnicity was defined by self-assessment using the same categories as the 1991 Census (OPCS, 1992). The Irish group was defined as those born in Ireland or with a parent born in Ireland.
The EMPIRIC survey included all HSE 99 informants aged 16–74 years from the Black
Caribbean, Indian, Pakistani, Bangladeshi and Irish ethnic groups who agreed to be re-contacted, comprising 92 % of those eligible. The HSE 99 did not include a Black African sample. The White sample was drawn from the 1998 HSE (Erens & Primatesta, 1999), because a full interview was not administered to White in-formants in the HSE 99. Chinese inin-formants in the HSE 99 were not approached as this group had already been interviewed twice and it was judged that further attrition would result in substantial bias.
Survey materials were translated into five languages by an experienced independent pro-fessional translation service : Hindi, Gujarati, Punjabi, Urdu and Bengali. Proofreading by an independent third-party translator was em-ployed rather than back translation, for a number of reasons. It is standard practice that a translator should only use their mother tongue as their target language. However, there are few if any suitably qualified, registered translators in the UK who translate from Asian languages and have English as their mother tongue. The sen-tence structure of Asian languages means that they are very time consuming to translate into English and the results tend to be very stilted. Consequently much of the checking then refers to problems with the back translation rather than any real problems in the original trans-lation. Furthermore, back translation does not show certain types of error such as spelling and grammatical mistakes, the unwarranted im-portation of words from another language, over use of transliteration, and unnecessarily com-plex language. Informants who were unable to complete the study assessment in English were provided with an interviewer who was able to speak the relevant language. Overall, 83 % of interviews were conducted in English, with Bengali (10.3 % of interviews) being the second most commonly used language. The proportion of interviews in English was 87 % among Indian informants, 69 % among Pakistani informants and 37 % among Bangladeshi informants. Among South Asian informants, this figure was lower for women and fell with age.
The common mental disorders
The CMD were assessed using the Revised Clinical Interview Schedule (CIS-R) (Lewis et al. 1992), which was also used in both UK
national surveys of psychiatric morbidity (Meltzeret al. 1995 ; Singletonet al. 2001). The CIS-R enquires about the presence and severity of 14 non-psychotic psychiatric symptoms during the week prior to interview. These are : somatic complaints associated with low mood or anxiety, fatigue, problems with memory and/ or concentration, sleep disturbance, irritability, worry about physical health, depressed mood, depressive thoughts, non-health-related worry, generalized anxiety, phobic anxiety, panic at-tacks, compulsive behaviours, and obsessional thoughts. Symptoms of anxiety and depression co-occur in the same individuals both con-secutively and concurrently, particularly in community settings (Goldberg & Huxley, 1992). The CIS-R score may be analysed in three ways : (i) as a continuous score, along a single con-tinuum of severity (Krueger, 1999), (ii) as a di-chotomous variable (case thresholdo12) (Lewis et al. 1992), and (iii) as ICD-10 diagnostic cat-egories (Meltzer et al. 1995 ; Singleton et al. 2001). Diagnostic algorithms for use with the CIS-R cover (a) Depressive episodes (classified as mild, moderate or severe), (b) four types of anxiety disorder, namely Generalized Anxiety Disorder (GAD), Panic disorder, Phobias (classified as Agoraphobia, Social phobia and Simple phobia), Obsessive–Compulsive disorder (OCD), and (c) Mixed Anxiety Depressive dis-order (MADD). The latter included those who scored above the case threshold on the CIS-R, but did not meet diagnostic criteria for any other ICD-10 disorder.
Statistical analysis
All analyses were undertaken using the survey commands in STATA 7.0 (Stata Corporation,
2001). Weightings from the HSE 99 were re-tained, and in addition, weights were applied to adjust for the non-response to the EMPIRIC survey. Although the standard approach in the HSE series is to use an equal probability sam-pling strategy, this was not possible for the ethnic minority sample in the HSE 99, which was obtained by boosting relevant population groups (Erenset al. 2001 ; Sproston & Nazroo, 2002). To deal with the unequal sampling probability, three sets of weights were required for the HSE 99 data, to correct for (i) unequal probabilities of selection for postcode sectors ; (ii) unequal probability of household selection
within sectors ; and (iii) varying probabilities of selection of adults within participating house-holds. Weights were inversely proportional to the selection probabilities for postcode sec-tors, addresses, and number of adults living in participating households respectively. Finally, weights were applied to all cases to adjust for non-response at follow-up. Non-response weights were obtained using regression model-ling, based on HSE data for EMPIRIC in-formants and non-inin-formants. Standard errors and confidence intervals were also corrected for autocorrelation within the stratified multi-stage design (Sproston & Nazroo, 2002), including within household. Differences in the prevalence of CMD between ethnic groups were assessed for men and women separately, using risk ratios derived from logistic regression coefficients, be-fore and after stratifying by age. The Wald statistic was used to test for statistically signifi-cant confounding by, or interaction with, age and gender (Stata Corporation, 2001).
RESULTS
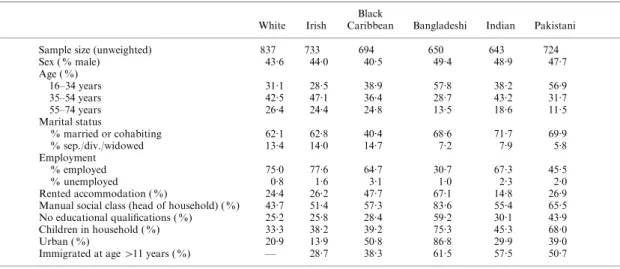
Interviews were achieved with 4281 adults (aged 16–74 years), a response rate of 68.2 % of in-scope individuals. Response rates varied between ethnic groups, being highest among White (71 %) and Irish (72 %) groups, and low-est among the Indian group (62 %). Including those who refused to be re-contacted following participation in HSE 99 reduced the EMPIRIC survey response rate to 63.3 %. White and Irish samples were similar in demographic and socio-economic characteristics (Table 1). Individuals in other ethnic groups were younger (especially the South Asian groups), more likely to live in urban areas, less likely to be employed, to have educational qualifications, or to live in house-holds headed by an individual in a non-manual social class.
Prevalence of CMD
respectively, the ethnic gradient in the pre-valence of CMD varied with age to a statistically significant extent among Bangladeshi (W=3.41, df=2, p=0.04) and Pakistani men (W=4.38, df=2, p=0.03), and among Indian women (W=4.15, df=2, p=0.02). On stratifying by age, it was apparent that the statistically sig-nificant excess morbidity among Irish men was restricted to the 35–54 years age group, while a similar excess of CMD was also revealed among Pakistani men of similar age. Among women, an
excess prevalence of CMD was found in those of Pakistani and Indian ethnicity aged 55–74 years. The prevalence of CMD among Bangladeshi women was consistently lower than that among both White and other South Asian women across the age span. The difference between Bangladeshi and White women did not reach statistical significance, while the contrast with other South Asian women was statistically sig-nificant in the oldest age group, and when compared with Pakistani women aged 16–34 Table 1. Characteristics of study sample,showing proportions(%)of each ethnic group by age,sex, marital status,employment status,housing tenure,occupational social class,education,children in the household and urban residence
White Irish
Black
Caribbean Bangladeshi Indian Pakistani Sample size (unweighted) 837 733 694 650 643 724 Sex ( % male) 43.6 44.0 40.5 49.4 48.9 47.7 Age ( %)
16–34 years 31.1 28.5 38.9 57.8 38.2 56.9 35–54 years 42.5 47.1 36.4 28.7 43.2 31.7 55–74 years 26.4 24.4 24.8 13.5 18.6 11.5 Marital status
% married or cohabiting 62.1 62.8 40.4 68.6 71.7 69.9 % sep./div./widowed 13.4 14.0 14.7 7.2 7.9 5.8 Employment
% employed 75.0 77.6 64.7 30.7 67.3 45.5 % unemployed 0.8 1.6 3.1 1.0 2.3 2.0 Rented accommodation ( %) 24.4 26.2 47.7 67.1 14.8 26.9 Manual social class (head of household) ( %) 43.7 51.4 57.3 83.6 55.4 65.5 No educational qualifications ( %) 25.2 25.8 28.4 59.2 30.1 43.9 Children in household ( %) 33.3 38.2 39.2 75.3 45.3 68.0 Urban ( %) 20.9 13.9 50.8 86.8 29.9 39.0 Immigrated at age>11 years ( %) — 28.7 38.3 61.5 57.5 50.7
Table 2. Prevalence of common mental disorders (CMD),and rate ratios (RR) (95 % CI)for the prevalence of CMD in each ethnic group by gender, and by age and gender. The White group is the reference population in each age stratum
White Irish Black Caribbean Bangladeshi Indian Pakistani Men
% cases of CMD 11.6 18.4 13.8 12.9 12.1 12.6
Unadjusted summary RR 1.00 1.59 (1.11–2.28)* 1.19 (0.80–1.79) 1.10 (0.73–1.64) 1.03 (0.69–1.56) 1.07 (0.72–0.84) RR by age group (v. White)
16–34 years 1.00 0.89 (0.34–1.80) 0.87 (0.37–2.73) 0.56 (0.23–1.19) 0.83 (0.36–1.57) 0.50 (0.21–1.09) 35–54 years 1.00 2.12 (1.17–3.05)* 1.18 (0.52–2.22) 1.77 (0.88–2.83) 1.07 (0.52–1.92) 2.10 (1.14–3.05)* 55–74 years 1.00 1.56 (0.74–2.55) 1.48 (0.69–2.47) 1.88 (0.81–3.03) 1.42 (0.64–2.46) 1.17 (0.51–2.17) Women
% cases CMD 19.0 18.6 19.8 12.3 23.8 26.0
Unadjusted summary RR 1.00 0.98 (0.74–1.29) 1.04 (0.80–1.37) 0.65 (0.47–0.92)* 1.25 (0.96–1.64) 1.37 (1.07–1.77)* RR by age group (v. White)
16–34 years 1.00 0.85 (0.44–1.43) 0.91 (0.49–1.46) 0.63 (0.32–1.09) 0.89 (0.44–1.53) 1.36 (0.89–1.81) 35–54 years 1.00 0.94 (0.60–1.31) 1.05 (0.66–1.45) 0.67 (0.27–1.32) 1.08 (0.65–1.54) 1.07 (0.67–1.49) 55–74 years 1.00 1.07 (0.46–2.06) 1.18 (0.51–2.20) 0.78 (0.20–2.24) 3.15 (1.65–3.93)** 2.80 (1.29–3.83)*
* p<0.05, **p<0.01.
years. Table 3 shows the unweighted and weighted bases for these estimates. Since weights were for non-response only, adjusted base sizes did not differ greatly from unweighted bases.
Confounding by socio-economic status
There were few socio-economic differences between middle-aged White and Irish men, al-though these groups did differ to a statistically significant degree in the proportion without educational qualifications (15.7 % of White men versus 26.1 % of Irish men aged 35–54 years) (x2=4.3, p=0.04), and the proportion in
households headed by someone in a manual occupation (42.2 % of Whites versus55.9 % of Irish men) (x2=
5.4,p=0.02). However, adjust-ing for these associations did not significantly reduce the excess prevalence of CMD among Irish men in this age group, compared with their White counterparts [adjusted rate ratio (RR) 2.09, 95 % CI 1.16–2.95, p=0.02]. Similar re-sults were found for Pakistani men aged 35–54 years, who differed to a statistically significant degree from middle-aged White men in being less likely to have educational qualifications, and more likely to live in rented accommo-dation, and in a ‘ manual ’ household. Pakistani
men in this age group were also more likely than White men to be married (92.2 % v. 77.8 %). Adjusting for all four variables served only to increase the RR for CMD among Pakistani men compared to White men aged 35–54 years (adjusted RR 2.38, 95 % CI 1.25–3.53,p=0.02). Bangladeshi women were more likely than their White counterparts to live in rented ac-commodation (73.5 % of Bangladeshi women versus27.8 % of White women) (p<0.0001), and manual households (86.1 % of Bangladeshi wo-men versus 41.4 % White women) (p<0.0001), and to have no educational qualifications (63.5 % of Bangladeshi women versus 28.5 % White women) (p<0.0001). Adjusting for these variables (plus age) increased the gradient in the prevalence of CMD between these groups slightly (adjusted RR 0.52, 95 % CI 0.27–0.93, p=0.03). Small sample sizes precluded statisti-cal tests for confounding of the increased prevalence of CMD among older Pakistani and Indian women.
Prevalence of CMD using ICD-10 diagnostic categories
The majority of those with scores above the case threshold on the CIS-R met criteria for only MADD, ranging from 59.1 % of cases among Table 3. Unweighted and weighted survey bases for analyses shown in Table 2,by ethnic group,
age and gender
White Irish
Black
Caribbean Bangladeshi Indian Pakistani Unweighted bases
Men (years)
16–34 102 71 108 153 102 171 35–54 166 164 86 96 148 117
55–74 100 94 86 63 65 49
Total 368 329 280 312 315 337 Women (years)
16–34 126 108 140 209 125 232 35–54 205 196 184 94 147 119 55–74 138 100 90 35 56 32 Total 469 404 414 338 328 383 Weighted bases
Men (years)
16–34 115 80 117 166 115 180 35–54 155 156 81 98 140 114
55–74 94 87 82 57 62 51
Total 364 323 280 321 317 345 Women (years)
16–34 145 129 152 210 133 231 35–54 200 189 171 88 140 115
55–74 126 92 89 30 59 32
Black Caribbean men to 79.8 % of cases among Indian men. Overall, just 2.1 % of men and 3.8 % of women met criteria for an ICD-10 depressive episode, while 3.7 % of men and 4.6 % of women met criteria for an anxiety disorder. No statistically significant ethnic vari-ation was detected in the prevalence of anxiety of depressive disorders, or MADD, among either men or women.
Prevalence of CMD and language at interview Overall, no English was employed at all in 17.2 % of interviews. The group most likely to be interviewed in a language other than English were Bangladeshi women (68.3 %). An associ-ation was found between being interviewed in English and a higher prevalence of CMD, although this association only reached statistical significance among the Bangladeshi group. After adjusting for both current age and age at migration, this association was greater among women (adjusted OR 6.16, 95 % CI 2.46–15.44, p<0.001) than men (adjusted OR 2.73, 95 % CI 1.02–7.28,p=0.05).
The lower prevalence of CMD among Ban-gladeshi women compared to White women was only observed among those who were not in-terviewed in English (unadjusted RR 0.30, 95 % CI 0.17–0.53, p<0.001). No such association was found among Bangladeshi women inter-viewed in English (unadjusted RR 1.25, 95 % CI 0.77–1.80, p=0.35). These findings were not confounded by adjusting for current age and age at migration. No such difference was found among Bangladeshi men, of whom 57.4 % were interviewed in a language other than English.
DISCUSSION Main findings
This was the largest and most comprehensive in-vestigation to date of non-psychotic psychiatric morbidity among ethnic groups in England. We found modest but important differences in the prevalence of the most CMD between the main ethnic groups living in England. The prevalence of CMD was higher to a statistically significant degree among Irish and Pakistani men aged 35–54 years, and Indian and Pakistani women aged 55–74 years than among White in-formants of the same age and gender. These findings were not altered on adjusting for
between-group differences on a number of measures of socio-economic status, including housing tenure, employment, social class and education.
Using the HSE 99 sample allowed us to capi-talize on a survey of 64 000 addresses, but meant that the final sample was subject to two waves of attrition. Although this attrition may have led us to under- or over-estimate the prevalence of CMD, response rates varied little between groups (range 62–72 %), and great care was taken in weighting for non-response. We note also that rates of CMD in our White sample were very similar to those reported among men (12.4 %) and women (18.1 %) in the most recent ONS UK national survey of psychiatric mor-bidity (Singleton et al. 2001), which also used the CIS-R.
Comparison with previous studies
In common with the FNS (Nazroo, 1997), we found low rates of CMD among Bangladeshi informants, and no evidence of higher rates of CMD among those of Black Caribbean eth-nicity. Contrary to the FNS findings, our results suggest that the prevalence of CMD among Pakistani women was higher than that found among White women. This difference may be partly methodological in origin, since the FNS omitted CIS-R somatic symptom items. The high prevalence of CMD among Pakistani women is consistent with the study by Commander et al. (1997), and with surveys in Pakistan (Mumfordet al. 1996, 1997, 2000). Previous re-search also indicates that those of Irish ethnicity in Britain experience worse physical and mental health than their White British counterparts, and that this is not explained by greater socio-economic adversity or by differences in smoking or alcohol consumption (Harding & Balarajan, 1996, 2001 ; Kelleher & Hillier, 1996 ; Bracken et al. 1998 ; Abbottset al. 2001).
Methodological limitations of transcultural research
Assessing psychiatric morbidity in different ethnic groups is complicated by linguistic and cultural variation in idioms of distress. A major strength of this study was the deployment of interviewers able to conduct assessments in each informant’s preferred language. While effects arising from translation may have contributed
to certain of our findings, particularly among the Bangladeshi group, this was unlikely to ex-plain the increased prevalence of CMD among Irish and Pakistani men aged 35–54 years, 99 % and 73 % of whom completed the interview in English respectively.
Bias arising from differences in the expression of psychological distress is more difficult to exclude. This issue is commonly highlighted among South Asian groups, who are said to ‘ somatize ’ psychological distress (Mumford et al. 1997). This may reflect differences in be-liefs about the relationship between mind and body, as well as in the perceived stigma associ-ated with mental illness (Raguram et al. 1996 ; Bhui, 1999). Rates of CMD could therefore be under- or over-estimated in some groups by giving insufficient weight to certain items (such as somatic complaints), or by overlooking dif-ferent types of psychological symptoms (Bhui, 1999). In the FNS, South Asian informants who scored positively on depression screening items derived from the CIS-R were significantly less likely than their White and Black Caribbean counterparts to meet diagnostic criteria for an anxiety or depressive disorder at a follow-up interview using the Present State Examination (Nazroo, 1997). Although previous research showing that the factor structure of the CIS-R is relatively invariant across different cultures, languages and geographical settings argues against this (Jacob et al. 1998), we cannot ex-clude this as a possible explanation for some of our findings.
Evidence from a parallel qualitative study suggested that while emotional experiences of mental distress appeared to be broadly similar across ethnic groups, there was some vari-ation in experience and idiom (O’Connor & Nazroo, 2002). The perceived ‘ fit ’ of itemized measures of mental health, such as the CIS-R, varied to some extent across ethnic groups, and appeared least applicable to those interviewed in languages other than English, particularly Ban-gladeshi respondents. Our quantitative findings also reveal that Bangladeshi respondents, and Bangladeshi women in particular, were signifi-cantly more likely to be identified as cases of CMD if interviewed in English. Indeed, the lower prevalence of CMD observed in the group of Bangladeshi women as a whole compared to their White counterparts was restricted to those
Bangladeshi women not interviewed in English. In contrast to the FNS (Nazroo, 1997), these findings were not confounded by age on migration or age at interview. Differences in the idiom of distress, or the lack of cultural equiv-alence of CIS-R items, could certainly have contributed to the low prevalence of CMD among non-English-speaking Bangladeshi wo-men. This cannot be excluded as an explanation for our findings among this group, and warrants further investigation. However, it is not im-mediately clear how this would account for the very high prevalence of CMD found among Indian and Pakistani women aged 55–74 years, many of whom (45–70 %) also completed the interview in a language other than English.
Under-enumeration at the 1991 UK Census was unlikely to have altered our findings. Only weights for non-response between HSE and EMPIRIC interviews were used in our analyses, which do not use estimates of the general population. Every effort was made during the HSE 99 to sample and recruit representative samples of individuals from all ethnic groups, including the focused enumeration method in wards with low proportions of ethnic minority residents.
As a final caveat, we should acknowledge the limitations of the term ‘ ethnicity ’ itself (Kaplan & Bennett, 2003). ‘ Ethnicity ’ (like ‘ race ’) is often defined ambiguously, and is of unproven reliability and validity. Independent assessments of ethnicity can vary between raters, and self-reported ethnicity may change with time and circumstances. Given these difficulties, expert consensus recommends that terms should be used as transparently as possibly, reflecting methods used to collect data as closely as poss-ible. Since participants were recruited to the EMPIRIC Study on the basis of self-reported ethnicity using the same categories as the 1991 UK Census, we have continued to use the same terminology in all of our reports.
were not significantly elevated compared to their White counterparts. While Bangladeshi women were the most likely to have come to this country after the age of 11 years, the lower prevalence of CMD compared to White and other South Asian women extended across the entire age span. However, we cannot exclude the possibility that these differences are due to some other, unmeasured aspect of acculturation. It is possible that the findings in Table 2 were due to chance (Type I error), arising from mul-tiple statistical tests. By contrast, there were a number of relatively small base sizes in some age-and sex-specific groups (Table 3) which resulted in relatively large standard errors, and hence the risk of Type II error. These results must therefore be treated cautiously, reinforcing the view that such differences as exist between ethnic groups in England are likely to be modest at best.
Directions for future research
The reasons for high rates of CMD in Pakistani men and women, and middle-aged Irish men remain unclear, and warrant further investi-gation. There is certainly a particular dearth of research among the Irish group, which may be partly due to the tendency to equate ethnicity with skin colour. The low rate of CMD among Bangladeshi informants (and non-English-speaking women in particular) runs counter to expectation, given the high levels of socio-economic deprivation among this group (Nazroo, 1998). Further research is needed to examine this, and to determine whether there are features of Bangladeshi communities, such as abundant social support or community-level social capital that are conducive to good mental health. Whilst racism remains a potent and poorly researched paradigm (McKenzie, 2003), it is not immediately clear how differences in adverse experiences of this nature are consistent with the relatively invariant prevalence of CMD among different ethnic groups found in this study.
ACKNOWLEDGEMENTS
The National Centre for Social Research carried out the fieldwork and provided considerable statistical advice. We are especially grateful to Kavita Deepchand, Christos Korovessis, Kevin Pickering and Susan Purdon. The study was
funded by the Department of Health, and we express our appreciation to John O’Shea, Richard Bond, Anthony Boucher, Janet Davies and Anna Higgitt.
DECLARATION OF INTEREST
None.
REFERENCES
Abbotts, J., Williams, R. & Ford, G.(2001). Morbidity and Irish Catholic descent in Britain : relating health disadvantage to socio-economic position.Social Science and Medicine52, 999–1005.
Bhugra, D., Leff, J., Mallet, R., Der, G., Corridan, B. & Rudge, S.
(1997). Incidence and outcome of schizophrenia in whites, African Caribbeans and Asians in London. Psychological Medicine26, 791–798.
Bhui, K. (1999). Common mental disorders among people with origins in or immigrant from India and Pakistan.International Review of Psychiatry11, 136–144.
Bracken, P. J., Greenslade, L., Griffin, B. & Smyth, M. (1998). Mental health and ethnicity : an Irish dimension.British Journal of Psychiatry172, 103–105.
Commander, M. J., Sashidharan, S. P., Odell, S. M. & Surtees, P. G.
(1997). Access to mental health services in an inner city health district. II : associations with demographic factors.British Journal of Psychiatry170, 317–320.
Erens, B. & Primatesta, P.(1999).Health Survey for England : Car-diovascular Disease ’98. TSO : London.
Erens, B., Primatesta, P. & Prior, G.(2001).Health Survey for Eng-land 1999 : The Health of Minority Ethnic Groups. TSO : London.
Goldberg, D. & Huxley, P.(1992).Common Mental Disorders : A Bio-Social Model. Routledge : London.
Harding, S. & Balarajan, R.(2001). Mortality of third generation Irish people living in England and Wales.British Medical Journal 322, 466–467.
Harding, S., Balarajan, R. & Balarajan, R.(1996). Patterns of mor-tality in second generation Irish living in England and Wales : longitudinal study.British Medical Journal312, 1389–1392.
Harrison, G., Amin, S., Singh, S. P., Croudace, T. & Jones, P.(1999). Outcome of psychosis in people of African-Caribbean origin. Population-based first-episode study.British Journal of Psychiatry 175, 43–49.
Jacob, K. S., Everitt, B. S., Patel, V., Weich, S., Araya, R. & Lewis, G. (1998). The comparison of latent variable models of non-psychotic psychiatric morbidity in four culturally diverse populations.Psychological Medicine28, 145–152.
Kaplan, J. B. & Bennett, T.(2003). Use of race and ethnicity in bio-medical publication.Journal of the American Medical Association 289, 2709–2716.
Kelleher, D. & Hillier, S.(1996). The health of the Irish in England. InResearching Cultural Differences in Health(ed. D. Kelleher and S. Hillier), pp. 103–123. Routledge : London.
King, M., Coker, E., Leavey, G., Hoare, A. & Johnson-Sabine, E.
(1994). Incidence of psychotic illness in London : comparison of ethnic groups.British Medical Journal309, 1115–1119.
Kish, L.(1965).Survey Sampling. Wiley : London.
Krueger, R. F.(1999). The structure of the common mental disorders.
Archives of General Psychiatry56, 921–926.
Lewis, G., Pelosi, A. J., Araya, R. & Dunn, G.(1992). Measuring psychiatric disorder in the community : a standardised assessment for use by lay interviewers.Psychological Medicine22, 465–486.
McKenzie, K.(2003). Racism and health.British Medical Journal 326, 65–66.
Meltzer, H., Gill, B. & Petticrew, M.(1995).OPCS Surveys of Psy-chiatric Morbidity in Great Britain. Report No. 1. The prevalence of
psychiatric morbidity among adults aged 16–64 living in private households in Great Britain. HMSO : London.
Mumford, D. B., Minhas, F. A., Akhtar, I., Akhtar, S. & Mubbasshar, M. H.(2000). Stress and psychiatric disorder in urban Rawalpindi.
British Journal of Psychiatry177, 557–562.
Mumford, D. B., Nazir, M., Jilani, F. U. & Baig, I. Y.(1996). Stress and psychiatric disorder in the Hindu Kush : a community survey of mountain villages in Chitral, Pakistan. British Journal of Psychiatry168, 299–307.
Mumford, D. B., Saeed, K., Ahmad, I., Latif, S. & Mubbasshar, M. H.
(1997). Stress and psychiatric disorder in rural Punjab. A com-munity survey.British Journal of Psychiatry170, 473–478.
Nazroo, J. Y.(1997).Ethnicity and Mental Health. Policy Studies Institute : London.
Nazroo, J. Y.(1998). Genetic, cultural or socio-economic vulner-ability ? Explaining ethnic inequalities in health. InThe Sociology of Health Inequalities(ed. M. Bartley, D. Blane and G. Davey Smith), pp. 151–170. Blackwell : Oxford.
O’Connor, W. & Nazroo, J. (eds)(2002).Ethnic Differences in the Context and Experience of Psychiatric Illness : A Qualitative Study. TSO : London.
OPCS (1992). 1991 Census Definitions Great Britain. HMSO : London.
Raguram, R., Weiss, M. G., Channabasavanna, S. M. & Devins, G. M.(1996). Stigma, depression and somatization in South India.
American Journal of Psychiatry153, 1043–1049.
Singleton, N., Bumpstead, R., O’Brien, M., Lee, A. & Meltzer, H.
(2001).Psychiatric morbidity among adults living in private house-holds, 2000. The Stationery Office : London.
Smith, P. & Prior, G.(1997).The Fourth National Survey of Ethnic Minorities : Technical Report. Social and Comunity Planning Research : London.
Sproston, K. & Nazroo, J. (eds)(2002).Ethnic Minority Psychiatric Illness Rates in the Community(EMPIRIC). TSO : London.