Consumers’ assocations with organic food
University of Twente.
Masterthesis - Psychology of Conflict, Risk and Safety
Manon Jurgens
November 2015
Dr. Margôt Kuttschreuter
Femke Hilverda, MSc
2
Acknowledgements
In my search for a research topic for my master thesis I came across a project proposed by Margôt and Femke on organic food, as part of their own research. This project immediately spiked my interest and it was not long before I decided to see whether they would have me as their graduate student. The period of the past months in which I have worked on this research project has been both stimulating and enervating. At times I became frustrated and grew weary of the project when progress was slow. However, I never tired with the topic which is quite an accomplishment in itself. With my stress-levels at times sky-rocketing the end result that now lays before you is ever more rewarding.
In my belief my supervisors, Femke and Margôt, must have at times been quite sceptic of my plans, and perhaps once or twice even of whether I would ever be able to manage everything to come to a good end. However sceptic they may have been, they always remained interested in and concerned for my progress, keeping me focused to continue, but also halting me when I desired to proceed faster than was wise. I therefore first and foremost owe many thanks to them, for their guidance, ideas, expertise and patience. With their help I have increased my knowledge on how to conduct a research project, on consumers’ ideas and behaviour when it comes to organic food, and, what I found perhaps
most fascinating and frustating at once, they helped me delve into the psyche of the questionnaire respondent – which is a scary thing to discover.
Furthermore, I heartily thank my friends for all the fun and relaxing times I spent with them, even though many of them have called me nuts and questioned my stresslevels on more than one occasion. They did a mighty job getting my mind off this thesis project, creating the opportunity for me to reload to get back on track.
Above all I want to thank my parents for their help, interest, patience, the way they always pushed my ambition, and their never-ending belief and support.
3
Summary
We established a framework of the conceptualisations of organic food by consumers with different purchase behaviours in order to increase the ability to respond to the growth of the organic food market by policy makers, advertisers, and food production companies. The current research therefore aimed to investigate what associations consumers with different purchase behaviours have with organic food on the basis of the Construal Level Theory. Specifically, we investigated consumers’ associations with organic food as well as organic meat and vegetables, in order to compare more abstract and concrete instances of the concept. We also examined differences in associations with organic food between consumers with different purchase behaviours of organic food to increase understanding of the differences in perceptions of organic food. Furthermore, we examined differences in characteristics between the consumergroups in order to increase understanding of the consumers who always, occasionally, or never purchase organic food.
We carried out a prototype analysis using convenience samples in two studies to investigate what associations consumers have with organic food and what associations are most central. We also explored consumers’ psychological distance to organic food, their human-centred, animal-centred and
environment-centred values, and their socio-demographic features. Overall, the results showed consumers associate organic food mostly with animal welfare, price, health, pesticides, and naturalness. Associations related to environment, health, honesty, pesticides, and sustainability were deemed most central. The results also showed that consumers who always purchase organic food have a more positive and concrete conceptualisation of organic food than consumers who occasionally and never purchase organic food.
Research into consumers of organic food has largely focused on consumers’ motivations to purchase
4
Contents
1. INTRODUCTION ... 5
1.1 ORGANIC FOOD HISTORY ... 5
1.2 MAKING SENSE OF ORGANIC FOOD ... 7
1.2.1 Consumers’ moral attitudes toward organic food ... 8
1.2.1 Consumers’ motivating factors to purchase organic food ... 8
1.2.1 Differences between food, meat, and vegetables ... 10
1.2.1 Differences between consumers with different purchase behaviours ... 10
1.3 RESEARCH QUESTIONS ... 11
2. STUDY 1 ... 13
2.1 METHOD ... 13
2.1.1 Respondents ... 13
2.1.2 Measurements ... 14
2.1.3 Procedure ... 15
2.1.4 Data-analysis ... 16
2.2 RESULTS ... 16
2.2.1 Consumers’ associations ... 16
2.2.2 Assessment of variations in traits between consumergroups ... 20
2.2.3 Conclusion of Study 1 ... 23
3. STUDY 2 ... 25
3.1 METHOD ... 25
3.1.1 Respondents ... 25
3.1.2 Measurements ... 25
3.1.3 Procedure ... 25
3.1.4 Data-analysis ... 26
3.2 RESULTS ... 26
3.3 CONCLUSION OF STUDY 2 ... 27
4. DISCUSSION ... 29
4.1 CONSUMERS’ ASSOCIATIONS ... 29
4.2 DIFFERENCES BETWEEN FOODGROUPS ... 31
4.3 DIFFERENCES BETWEEN CONSUMERGROUPS ... 31
4.4 LIMITATIONS AND FURTHER RESEARCH ... 33
5. BIBLIOGRAPHY ... 35
5
1.
Introduction
Sales of organic products increase and organic production is evermore in the spotlights. To be able to better adjust to the challenges consumerism poses, research focuses on policy making and consumer motivations to purchase organic food. We now have a working definition of the concepts of “organic” and “organic food” to use in policy making. We now also know that the concern for health and
wellbeing appears to be central to consumers' purchase motivations, that consumers differ in their level of experience and expertise, and that consumers with different levels of experience perceive attributes differently. However, it is still unclear what associations consumers have with organic food, while they are of vital importance to develop a coherent framework of the concept of organic food in consumers’ minds. The development of such a framework provides new information on how
consumers experience organic food and how they make sense of the concept. This, in turn, may serve as a platform for the creative use of consumers’ associations in policy making and marketing communications. The consumers’ minds may be (nearly) clean slates with hardly any associations
with the concept; associations may be traced to different levels of experience and expertise which left different impressions in the consumers’ minds; and consumers’ associations may be mixed in valence,
leaving open the question whether positive or negative associations are more prevalent in the consumers’ minds.
This study principally investigates what associations consumers have with organic food, how these associations differ in amount and valence, how these assocations differ according to the framing of organic food, and how these associations differ between different consumergroups. Furthermore, this study investigates how consumers make sense of the concept of organic food by using the Construal Level Theory (CLT). This theory is used to analyse how concrete the concept is in consumers’ minds by measuring the consumers’ psychological distance to the concept, using temporal, spatial, social,
hypothetical, informational and affective distance. Additionally, this study investigates how consumers differ on their values, and what characteristics distinguish consumers who always, occasionally, and never purchase organic food.
1.1
Organic food history
Organic agriculture emerged in the 1930s and 1940s in the major industrial countries as an alternative to the increasing intensification of the usual agriculture (Lotter, 2003). The first use of the term “organic farming” appeared in 1940 in the book Look to the Land by Lord Northbourne (Paull, 2006,
6
integrates soil, crops, animals, and society (Lotter, 2003; Paull, 2006, 2010). This approach is fundamental to understanding the decisions of the organic agriculture community regarding its practices (or its opposition to certain 'regular' practices), its discomfort with mainstream commercialisation and its inclusion of ethical and social issues (Lotter, 2003).
The organic food market is growing at a rapid rate with production and sales of organic food increasing profoundly (Soil Association, 2014; Willer, Lemoud, & Kilcher, 2013). According to the European Commission, the farming of organic food relies on a number of objectives, principles, and common practices designed to minimise the human impact on the environment, with the agricultural system operating in a way more closely resembling and respecting nature (European Commission, n.d.-b). The resulting organic food is defined by how it is produced, and rather by how it cannot be made than how it can be made, which means that it must be produced without the use of sewer-sludge or (most) synthetic fertilisers and pesticides, genetic engineering, growth hormones, irradiation, food additives, processing aids, and livestock antibiotics (Ahmad & Juhdi, 2010; European Commission, n.d.-b; Soil Association, 2014). The process of organic farming is aimed at combining the best environmental practices, and does so through responsible use of energy and natural resources, maintaining biodiversity, water quality and ecological balance, enhancing soil fertility, and respecting animals by promoting animal health and welfare (European Commission, n.d.-a, n.d.-b).
There is thus a working definition of the concept of “organic food” in policy making, but this
definition is not wide-spread knowledge among the general public of consumers. The findings of Harper and Makatouni (2002) showed that consumers often confuse organic and free-range products because they believe that “organic” is equivalent to “free-range” food. While “free-range” is part of the definition of the term “organic”, it is not the same. In line with these findings, Eden (2011) showed
that labels on organic and functional foods were given very different meanings by regulators and consumers, especially with reference to technological modification.The term “organic” is defined through European Regulation 834/2007 as “coming from or related to organic production” (Council of
the European Union, 2007, p. 4), with the latter involving the use of the production method that is compliant with the rules established in the Regulation, at all stages of production, preparation and distribution. In the Regulation, organic production is described in terms of allowable production practices; organic production should combine best environmental practices with a high level of biodiversity and the preservation of natural resources. It also includes a reference to the application of animal welfare standards and the permissibility of certain inputs and treatments, refering to the preference of certain consumers for products that are produced using natural substances and processes (Council of the European Union, 2007).
7 perceive organic food. To understand how consumers conceptualise organic food it is important to understand what they associate with the concept and what they to be its vital aspects. Furthermore, it is important to know whether, and if so, how, the way consumers perceive organic food differs between consumers with different purchase behaviours regarding organic food.
1.2
Making sense of organic food
Construal Level Theory, as explained by Trope and Liberman (2010), propopes that we transcend the present to include distal entities by forming an abstract mental construal of these distal entities. In that way we can plan for the distant future, take someone else’s perspective, speculate about what might
have been and imagine hypothetical alternatives to reality – all mental constructions that are different from immediate experience. These constructions are predictions, memories, or speculations that represent psychologically distant entities. The basic premise of the theory is that the distance of an entity is linked to the level of mental construal in a dual manner, with increasingly higher levels of construal bringing to mind more distant entities and vice versa. As the psychological distance increases, the mental construals thus become more abstract. Increasing levels of abstractness, in turn, increase the psychological distance, meanwhile retaining central features of the entity and omitting features that are increasingly incidental.
Even though the concept of psychological distance is a fully subjective experience, there are different ways in which an entity might be removed from the individual in the present time (Trope & Liberman, 2010). The psychological distance may be, for instance, temporal, spatial, social, hypothetical, informational, or affective. When an entity, for example an organic zucchini, is removed from the self in the here and now on the temporal dimension, the zucchini is in the past or the future. The psychological distance increases as the zucchini is further away in time. For instance, “I will purchase
8
The psychological distance may also appear in people’s perceptions of organic food and the meaning
they attribute to the concept. The dimensions of psychological distance appear to be related and the concept of psychological distance appears to be an aspect of meaning (Trope & Liberman, 2010). With entities differing in levels of abstractness, the conceptualisation of organic food may also include more or less specific features. The higher the level of abstractness, the more inclusive, simple, and coherent the concept is, with more room for alternative interpretations. People may, therefore, attribute different meaning to the concept of “organic food” compared to a less abstract, less inclusive concept like “organic meat” or “organic vegetables”.
Apart from forming mental construals about entities, people also make sense of information by actively constructing and interpreting their own ideas. In her study on organic and functional food labelling, Eden (2011) uses the concept of boundary objects to concentrate attention on how a diversity of consumers gives meaning to the same label. She notes the necessity of a theoretical frame for how consumers make sense of food information on labels, in a way that may or may not have been intended by the provider of the product. Eden’s study also addresses the concept of organic food as a relational concept. The meaning of the concept is constituted by the different perspectives of consumers with different levels of experience and expertise. The different perspectives of consumers might be, partly, due to different moral attitudes, different perceptions of organic food, and different socio-demographic backgrounds. In the present study these determinants are explored.
1.2.1 Consumers’ moral attitudes toward organic food
Makatouni (2002) identified three main broad categories of life values that correspond to the key motivating factors for consumers to purchase organic food. These categories are consumers' human, animal, and environment centred values. Although consumers do not necessarily see the purchase of organic food as a moral imperative, the moral aspects related to organic food, like the consequences for animal welfare and the environment, are more likely to elicit a positive response (Arvola et al., 2008). Since an individual’s moral norm predicts intentions to act, and since the perceived moral
correctness may make it more likely that the intention is translated into action - if the behaviour is construed in moral terms (Godin, Conner, & Sheeran, 2005) - a consumer’s values may influence whether or not (s)he purchases organic food.
1.2.1 Consumers’ motivating factors to purchase organic food
Consumers’ different perspectives of organic food might also be due to differing associations with
9 people’s motivations for purchasing organic food. Central to consumers' motivations related to the
consumer are aspects related to health (Harper & Makatouni, 2002; Hughner et al., 2007; Zanoli & Naspetti, 2002), like wellbeing (Hughner et al., 2007; Zanoli & Naspetti, 2002), safety of the product (Harper & Makatouni, 2002; Hughner et al., 2007), and nutritional concern (Hughner et al., 2007).
Consumers’ motivations also include concerns for animal welfare (Harper & Makatouni, 2002;
Hughner et al., 2007), which are highly prevalent in the definition and agricultural system of organic farming. But while animal welfare may be one of the main reasons to purchase organic food, it is not yet clear what the exact focus is of these ethical concerns. The consumers may be motivated by concern for the welfare of the animal itself, but they may also be concerned with the impact of the quality of life of the animal on the food product they eventually eat (Harper & Makatouni, 2002).
Other concerns that are more peripheral motivations for consumers to purchase organic food are the concern for the environment, the superior taste of organic food, a lack of confidence in the conventional non-organic food industry, its support of the local economy (as organic farming aims for a decrease of transportation of the goods), and its fashionable character (Hughner et al., 2007). Moreover, being free from genetic modifications and food additives are motivations to purchase organic food as well (Makatouni, 2002).
On the other hand, barriers to not purchase organic produce are the costs and lack of availability of organic foods (Lea & Worsley, 2005). Regarding the costs of organic food, Pretty et al. (2000) build a case to defend the higher price. They state that the price of non-organic food is low because the over the counter payment is only one of three ways one pays for the product. While indeed organic food is usually more expensive than non-organic food, because crop rotations, organic animal feed, and other practices result in higher production costs, consumers pay hidden costs for non-organic food. Therefore non-organic food only appears to be cheaper. The first payment is done over the counter, the second via taxation to fund agricultural subsidies, and the third to remedy the environmental pollution that is caused by the conventional intensive farming practices.
Other deterrents to purchase organic produce are poor merchandise, a sceptic view of the consumer of the certification boards and labels, and satisfaction with the current conventional food source and seeing no reason to change (Hughner, 2007). But even if consumers perceive organic products as difficult to find and expensive, most consumers do judge them positively (Zanoli & Naspetti, 2002).
10
abstract concept of food, or more specific instances such as meat and vegetables. These associations may also differ between consumers with different purchase behaviours.
1.2.1 Differences between food, meat, and vegetables
The associations consumers have with organic food as the general concept may be different from associations with meat or vegetables as specific instances of organic food. Animal welfare, for instance, is intuitively strongly related to meat, but has little to do with vegetables. It is therefore important to include in an inquiry into consumers’ associations with organic food the possibility that
associations are distinctly different when they concern either food, meat, or vegetables.
While concern about health is the primary motivator of consumers to purchase organically produced goods, consumers are also concerned about the environmental impact on intensive farming, and about the welfare of intensively-produced farm animals. Consumer concern about animal welfare has increased in reaction to the intensification of agricultural animal production. However, there is little data available on the meanings consumers attach to “organic” food and “animal welfare” (Harper &
Makatouni, 2002).
On the other hand, consumer surveys reveal that fruits and vegetables are the leading categories for organic sales. These consistently are purchased most often and they are the product types that are first purchased by non-regular organic food consumers. In the future, the scale of organic farming is expected to increase, which gives organic food the opportunity to expand beyond its traditional base, with many more mainstream grocery groups going to enter the organic sector to satisfy consumer needs. Meat and cereals have a great deal of potential growth, because the variability is great and organic shoppers prefer the same convenience and range of food they find in the conventional offerings (Aschemann, Hamm, Naspetti, & Zanoli, 2007). But while expectations may be the same for both categories, the meanings and associations connected to the organic variants may not.
It is unclear whether consumers' ethical concerns with animal welfare relate specifically to the welfare of the animal or to the impact the welfare has on the food product that the animal will become (Harper & Makatouni, 2002). If the latter is the case, consumers' concerns with organic meat products would very likely not be any different from consumers' concerns with organic vegetables. If the consumers' concern does concentrate on the welfare of animal in its own right, the question becomes whether associations of consumers are different between the two types of products groups.
1.2.1 Differences between consumers with different purchase behaviours
11 quite set, however broad, the meaning of the word “organic” is variable with respect to the perspective
of consumers. According to Hughner et al., 2007 consumers interpret the term “organic” in a variety of ways and in a multitude of differing contexts. Besides this, consumers of organic food are not homogeneous in demographics or in their beliefs (Hughner et al., 2007). Lea and Worsley (2005), for instance, found that the majority of their participants believed that organic food is healthier, tastier, and better for the environment than conventional (non-organic) food, with women being generally more positive about organic food than men. They found that gender was the second dominant predictor of positive beliefs of organic food, after the universal personal value factor that includes unity with nature, preserving the environment and equal opportunity for all.
Harper and Makatouni (2002) distinguish three different types of consumers, non-organic food consumers, regular organic food consumers, and occasional organic food consumers. The negative aspects of organic food were found to be more relevant for regular consumers than to those occasionally buying organic food. The latter ones were mostly concerned with the lack of availability of organic food. Zanoli and Naspetti (2002) as well found attributes to be perceived differently by different groups of consumers having more or less experience with organic food purchase. They found occasional consumers to be particularly attracted by personal satisfaction resulting from purchasing organic food, while the appearance of the food was experienced as a deterrent from purchase, however tasty the consumers thought the food to be. The occasional consumers also lack transcendental values related to purchasing organic food, like altruism and the realisation of a sustainable future.
Such differences between consumers with different organic food purchase behaviours may also show in their associations with organic food. In line with Harper and Makatouni (2002) we therefore distinguish three types of consumers in this research, namely those consumers who (almost) always, occasionally, and seldom or never purchase organic food.
1.3
Research questions
We therefore explore whether associations, mental construals, values, and socio-demographics differ between consumers who always, occasionally or never purchase organic food. This culminates in the following main research question that aims to encapsulate every element: What associations do consumers with different purchase behaviour have with organic food? The exploration of the specific elements are expressed in the following subquestions:
RQ-a-1: What associations do consumers have with organic food?
RQ-a-2: What associations with organic food are most central?
12
RQ-c: How do associations with organic food vary between consumers who always, occasionally, and never purchase organic food?
RQ-d: How do consumers who always, occasionally, and never purchase organic food vary with regard to their psychological distance to organic food, their values, and their
socio-demographic information?
The research in order to answer these questions consists of two studies. In the first study the respondents were asked using a digital questionnaire to write down their associations with either ‘organic food’, or ‘organic meat’ and ‘organic vegetables’. Furthermore the respondents were asked to
13
2.
Study 1
In this chapter the method and results of the first study are discussed.
2.1
Method
In this first study respondents were approached to fill out a digital questionnaire, the results of which were (in part) later on used for the construction of Study 2.
2.1.1 Respondents
The questionnaire of Study 1 was presented to possible respondents through the social network of the researchers, and blogs and fora that discuss food in general or organic food in particular. The total number of respondents was 154 of whom 113 (73%) were female and 41 (27%) male. Two respondents were deleted, because their responses indicated they had not seriously answered the question (they only referred to feces). The respondents had a mean age of 36 years old (range = 15 - 77 years old). The respondents mainly had a higher education (76%). 19% Of the respondents had a professional education and 6% a secondary education. 52% Of the respondents could live (very) comfortably with their financial situation, 38% could get by, 9% had difficulty or struggled to get by, and 1% does not know. Concerning eating habits, 81% of the respondents ate beef, 60% ate pork, 80% ate fish, 74% ate poultry, 93% ate eggs, and 88% ate dairy products.
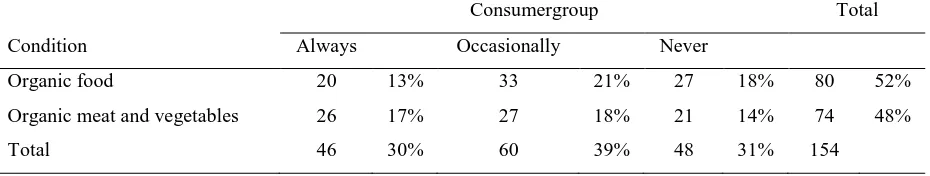
The first question of the questionnaire aimed to divide the respondents into three groups based on their purchase behaviour: consumers who (almost) always, occasionnally and (seldom or) never purchase organic food. These consumergroups are throughout this thesis described as ‘always’, ‘occasionally’ and ‘never’. Table 1 shows the number of respondents in the two different conditions (organic food, or
[image:13.595.67.532.586.674.2]organic meat and vegetables) and the three consumergroups.
Table 1
Number of respondents in the three consumer groups and the two food groups
Condition
Consumergroup Total
Always Occasionally Never
Organic food 20 13% 33 21% 27 18% 80 52%
Organic meat and vegetables 26 17% 27 18% 21 14% 74 48%
14
2.1.2 Measurements
Study 1consisted of a questionnaire of which the questions related to associations, mental construals, and values concerning organic food, and questions about the respondents’ socio-demographic information. In this section these elementsare discussed in turn.
2.1.2.1 Associations with organic food
The questionnaire continued with a question to elicit the listing of associations with organic food. A potential source of bias was identified based on the prototypicality analysis by Fehr (1988). Respondents might generate different associations for the broader concept of organic food or specific product types. Therefore, half of the respondents were asked to generate their associations with the (broader) concept of ‘organic food’ and the other half with the specific product types (‘organic meat’ and ‘organic vegetables’). In the latter case the two product types were counterbalanced. In the instructions it was made explicit that single word associations and short sentences (up to 6 words) were permitted. The example used was chosen for its neutrality and respondents were told “If you were asked to list what comes to mind when you think about the Netherlands, you might write…” (or,
in Dutch: “Als u bijvoorbeeld zou worden gevraagd om te benoemen waar u aan denkt bij Nederland,
zou u mogelijk schrijven...”). This was then followed by a list of attributes such as orange, Amsterdam is the capital, friendly people, and so on. In both cases, respondents were instructed to list as many associations with the concept as came to mind and to include even the obvious, though not to take more than about five minutes to list the associations.
2.1.2.2 Psychological distance
The measurement of the psychological distance to organic food was measured by 18 items regarding the temporal, social, spatial, hypothetical, information, and affective distance. Every subscale was measured by three items. The response scales for these items was a sevenpoint Likertscale, ranging from ‘strongly disagree’ to ‘strongly agree’. A factor analysis using Varimax rotation showed five
15 2.1.2.3 Values
The values were measured by 17 items regarding the human-centred, animal-centred, environment-centred, price-environment-centred, and attractiveness-centred values. The price-centred values subscale was measured by five items, all others by three items. The response scales for these items was a sevenpoint Likertscale, ranging from ‘strongly disagree’ to ‘strongly agree’. Factor analysis using Varimax
rotation showed the items for price-centred and attractiveness-centred values to load on separate factors. The items concerning animal-centred and environment-centred values, along with two items concerning human-centred values loaded on the same factor. To not lose information due to generalisation, these subscales were kept separate. The third item concerning human-centred values did not load on any factor. Due to a low internal consistency of the three items for human-centred values, this one item was excluded. The correlation between the other two items was sufficient to form a scale, r(152) = .59, p < .00, which than became human-health-centred. The internal consistency of the other 14 items was (marginally) sufficient for the items representing animal-centred (α = .86), environment-centred (α = .87), attractiveness-centred (α = .58), and price-centred values (α = .85). These respective items were therefore used to construct four subscales.
2.1.2.4 Socio-demographics
The measurement of socio-demographic variables included gender, age, level of education, financial situation, family composition, and eating habits. The responent’s financial situation was measured by a
question whether the respondent could comfortably make a living. The respondent’s family composition was measured using seven categories for age and the number of household members into the respective categories (0, 1, 2, or 3 or more). Furthermore, the respondents were asked to answer whether they did or did not eat beef, pork, fish, poultry, eggs, or dairy products.
2.1.3 Procedure
Study 1 consisted of a questionnaire that started out with a question what group described the respondent best in terms of purchase behaviour. The instruction was added that if one never purchases any food products, one should imagine what one would do. This resulted in the three consumergroups. The consumergroup of the respondent had no influence on the respective version of the questionnaire. The next part of the questionnaire was a question with the purpose to elicit the associations of consumers with the concept of organic food, or meat and vegetables. Moreover, the questionnaire included questions to explicate the respondents’ mental construals with the concept of organic food,
16
2.1.4 Data-analysis
The responses for the presence of associations with each concept were screened and listed. The procedure for coding features was adapted from Rosenberg and Jones (1972). Each subject’s responses were categorised by two judges (a graduate and a postgraduate student in psychology). Coding the associations included identification of monolexemic types, such as lekker (‘tasty’). When a subject used a phrase, a judgement was necessary as to whether it referred to a single feature or could, in fact, be divided into two or more linguistic units (associations). Phrases judged as single units where those in which the association was simply preceded or followed by a modifier or modifying phrase, such as
minder bewerkt (‘less modified’). Phrases judged as more than one linguistic unit were those in which each part could stand alone as a separate association with the concept, such as puur en zuiver.
The coded associations were listed and compared according to the three different types of consumers to discern which associations were different between the three groups. A χ2
-test, with the consumergroups as an independent variable and the frequencies of associations (adjusted to account for the difference in sample size per consumergroup) as a dependent variable, was used to assess whether certain associations were more prevalent in a consumergroup. Likewise, the coded associations were listed and compared according to the three different types of product to discern which associations were limited to meat or to vegetables (if any). A χ2-test, with the foodgroups as an independent variable and the frequencies of associations (adjusted to account for the difference in sample size per food group) as a dependent variable, was used to assess whether certain associations were more prevalent in a consumergroup.
Furthermore the consumer characteristics were examined to elucidate which characteristics were more prevalent in number in one (or two) of the consumer types, or limited to one group of consumers. A Pearson’s χ2
-test was conducted on the respondents’ gender, an ANOVA on the respondents’ age, and Kruskal-Wallis H tests on the respondents’ level of education and financial situation.
2.2
Results
The results of Study 1 provide insight into consumers’ associations and their variations between different consumergroups and foodgroups, and consumers’ psychological distance to organic food, values, and socio-demographic information. These results are discussed in turn in the following section.
2.2.1 Consumers’ associations
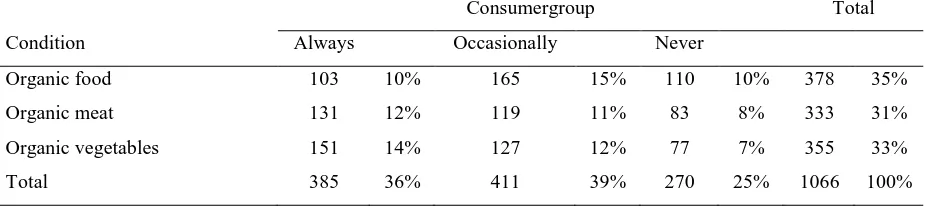
17 any other. This resulted in 1066 working associations. The total number of associations per consumergroup and per foodgroup are shown in table 2.
Table 2
Number of associations in the three consumergroups and the two foodgroups
Condition
Consumergroup Total
Always Occasionally Never
Organic food 103 10% 165 15% 110 10% 378 35%
Organic meat 131 12% 119 11% 83 8% 333 31%
Organic vegetables 151 14% 127 12% 77 7% 355 33%
Total 385 36% 411 39% 270 25% 1066 100%
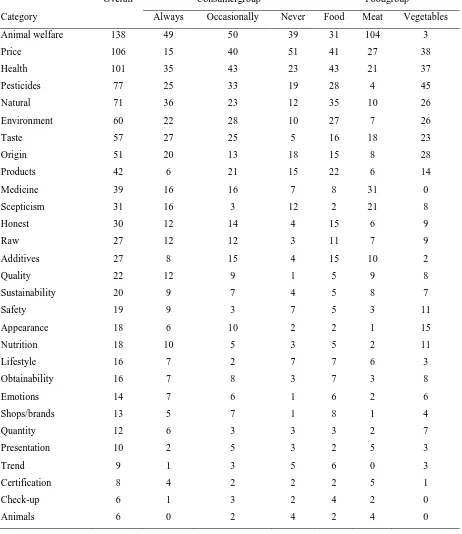
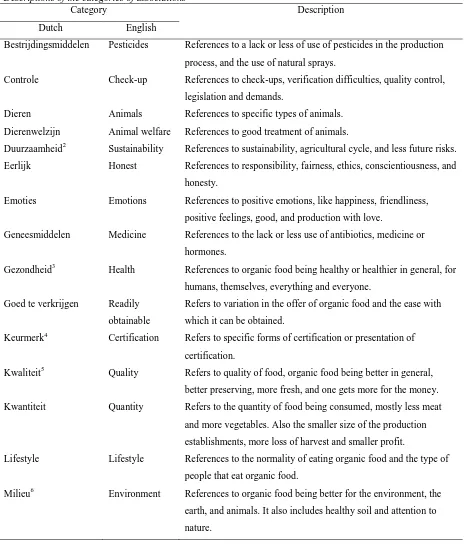
The analysis of the associations resulted in a total of 30 categories. The absolute frequencies of the associations in these categories are shown in table 3. This table also shows the number of associations in each consumergroup as well as each foodgroup. Hereby the total set of associations is separated twice according to the consumergroup of the respondent who mentions the association and the foodgroup-cue that elicited the association. The total number of associations in each respective group is therefore equal to the overall number of associations. The original Dutch name of the categories and their descriptions are shown in table 10 in Appendix A. Overall, respondents mentioned associations concerning animal welfare, price, health, pesticides and natural most often.
2.2.1.1 Assessment of variations in associations between food, meat, and vegetables
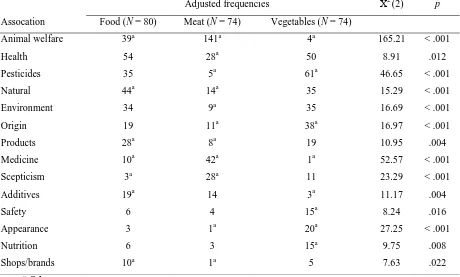
The frequencies of associations between foodgroups were analysed using a χ2-goodness-of-fit test. The most prominent differences are discussed here, table 4 shows all significant results of this analysis. Of the associations that were overall mentioned most often the analysis showed no significant differences between foodgroups on price. Associations related to animal welfare were considerably more often mentioned when cued by organic meat than when cued by organic food or organic vegetables. In the latter case animal welfare was hardly ever mentioned. The cue organic food resulted in the highest frequency for related associations. Organic meat resulted in the lowest frequency for natural-related, pesticides-related and health-related associations, while organic vegetables showed the highest frequency for pesticides-related associations.
18
Table 3
The absolute frequencies of the associations in every category overall, per consumergroup, and per foodgroup
Category
Overall Consumergroup Foodgroup
Always Occasionally Never Food Meat Vegetables
Animal welfare 138 49 50 39 31 104 3
Price 106 15 40 51 41 27 38
Health 101 35 43 23 43 21 37
Pesticides 77 25 33 19 28 4 45
Natural 71 36 23 12 35 10 26
Environment 60 22 28 10 27 7 26
Taste 57 27 25 5 16 18 23
Origin 51 20 13 18 15 8 28
Products 42 6 21 15 22 6 14
Medicine 39 16 16 7 8 31 0
Scepticism 31 16 3 12 2 21 8
Honest 30 12 14 4 15 6 9
Raw 27 12 12 3 11 7 9
Additives 27 8 15 4 15 10 2
Quality 22 12 9 1 5 9 8
Sustainability 20 9 7 4 5 8 7
Safety 19 9 3 7 5 3 11
Appearance 18 6 10 2 2 1 15
Nutrition 18 10 5 3 5 2 11
Lifestyle 16 7 2 7 7 6 3
Obtainability 16 7 8 3 7 3 8
Emotions 14 7 6 1 6 2 6
Shops/brands 13 5 7 1 8 1 4
Quantity 12 6 3 3 3 2 7
Presentation 10 2 5 3 2 5 3
Trend 9 1 3 5 6 0 3
Certification 8 4 2 2 2 5 1
Check-up 6 1 3 2 4 2 0
Animals 6 0 2 4 2 4 0
19 Table 4
The significant results of χ2-goodness-of-fit test to determine whether observed frequencies of associations (per category; adjusted for sample size) differ significantly from expected frequencies between three foodgroups
Adjusted frequencies Χ2 (2) p
Assocation Food (N = 80) Meat (N = 74) Vegetables (N = 74)
Animal welfare 39a 141a 4a 165.21 < .001
Health 54 28a 50 8.91 .012
Pesticides 35 5a 61a 46.65 < .001
Natural 44a 14a 35 15.29 < .001
Environment 34 9a 35 16.69 < .001
Origin 19 11a 38a 16.97 < .001
Products 28a 8a 19 10.95 .004
Medicine 10a 42a 1a 52.57 < .001
Scepticism 3a 28a 11 23.29 < .001
Additives 19a 14 3a 11.17 .004
Safety 6 4 15a 8.24 .016
Appearance 3 1a 20a 27.25 < .001
Nutrition 6 3 15a 9.75 .008
Shops/brands 10a 1a 5 7.63 .022
Note: “a” denotes a significant difference in the proportion of associations from the expected proportion (33%)
Note: The frequencies of associations are adjusted to equal sample sizes (N = 100) by dividing the original frequency by the original sample size times 100.
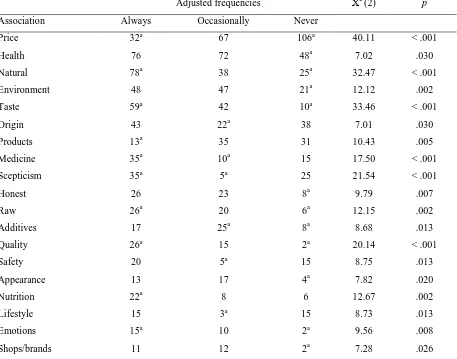
2.2.1.2 Assessment of variations in associations between consumergroups
The frequencies of associations between consumergroups were analysed using a χ2-goodness-of-fit test. The most prominent differences are discussed here, table 5 shows all significant results of this analysis. Of the associations that overall were mentioned most often the analysis showed no significant differences between consumergroups on the frequencies of associations with animal welfare and pesticides. On the other hand, consumers who always buy organic food mention natural significantly more often than the other consumergroups and price less often. Health-related associations were significantly less often mentioned by consumers who never buy organic food.
20 Table 5
The significant results of χ2-goodness-of-fit test to determine whether observed frequencies of associations (per
category; adjusted for sample size) differ significantly from expected frequencies between three consumergroups
Adjusted frequencies Χ2 (2) p
Association Always Occasionally Never
Price 32a 67 106a 40.11 < .001
Health 76 72 48a 7.02 .030
Natural 78a 38 25a 32.47 < .001
Environment 48 47 21a 12.12 .002
Taste 59a 42 10a 33.46 < .001
Origin 43 22a 38 7.01 .030
Products 13a 35 31 10.43 .005
Medicine 35a 10a 15 17.50 < .001
Scepticism 35a 5a 25 21.54 < .001
Honest 26 23 8a 9.79 .007
Raw 26a 20 6a 12.15 .002
Additives 17 25a 8a 8.68 .013
Quality 26a 15 2a 20.14 < .001
Safety 20 5a 15 8.75 .013
Appearance 13 17 4a 7.82 .020
Nutrition 22a 8 6 12.67 .002
Lifestyle 15 3a 15 8.73 .013
Emotions 15a 10 2a 9.56 .008
Shops/brands 11 12 2a 7.28 .026
Note: “a” denotes a significant difference in the proportion of associations from the expected proportion (33%)
Note: The frequencies of associations are adjusted to equal sample sizes (N = 100) by dividing the original frequency by the original sample size times 100
2.2.2 Assessment of variations in traits between consumergroups
2.2.2.1 Psychological distance
Table 6 shows descriptive statistics of the six different subscales of psychological distance. In line with what one would expect, the results show that the distance to organic food is smallest for the always consumergroup on all subscales and greatest for the never consumergroup. Overall, the results showed that all respondents perceive their spatial and temporal distance to organic food to be rather small, since the mean scores are below average with only small differences between the three groups. This indicates that organic food is quite easy to come by, while organic food is not very prevalent in the respondents’ social environment.
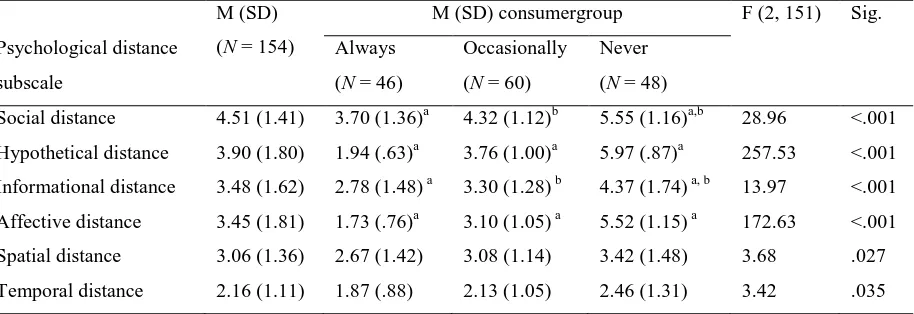
21 on psychological distance, Λ = .20, F(12, 292) = 30.62, p < .001, η2 = .58. This significant effect shows that the three consumergroups differ on their psychological distance to the concept of organic food.
[image:21.595.73.530.338.495.2]The MANOVA was followed up by six univariate ANOVAs for each of the subscales of psychological distance (table 6). The results of these analyses showed that there was a significant effect of the consumergroups on the social, hypothetical, informational, and affective distance subscales. There was no effect of the consumergroups found on the temporal and spatial distance to organic food. Bonferroni post-hoc analysis showed that the distance to organic food for the always consumergroup is smallest on the hypothetical and affective distance dimensions, and increase for the occasional and never consumergroups, respectively. The distance to organic food is greatest for the never consumergroup on the social and informational dimensions.
Table 6
Descriptive statistics and the results of the ANOVAs on the effect of the consumergroups on the subscales of psychological distance
Psychological distance
subscale
M (SD)
(N = 154)
M (SD) consumergroup F (2, 151) Sig.
Always
(N = 46)
Occasionally
(N = 60)
Never
(N = 48)
Social distance 4.51 (1.41) 3.70 (1.36)a 4.32 (1.12)b 5.55 (1.16)a,b 28.96 <.001
Hypothetical distance 3.90 (1.80) 1.94 (.63)a 3.76 (1.00)a 5.97 (.87)a 257.53 <.001
Informational distance 3.48 (1.62) 2.78 (1.48) a 3.30 (1.28) b 4.37 (1.74) a, b 13.97 <.001
Affective distance 3.45 (1.81) 1.73 (.76)a 3.10 (1.05) a 5.52 (1.15) a 172.63 <.001
Spatial distance 3.06 (1.36) 2.67 (1.42) 3.08 (1.14) 3.42 (1.48) 3.68 .027
Temporal distance 2.16 (1.11) 1.87 (.88) 2.13 (1.05) 2.46 (1.31) 3.42 .035
Note: Low scores indicate a small distance and high scores a great distance to organic food on the respective subscale
Note: “a” Denotes a significant difference between the mean scores of the consumergroups on the respective subscale
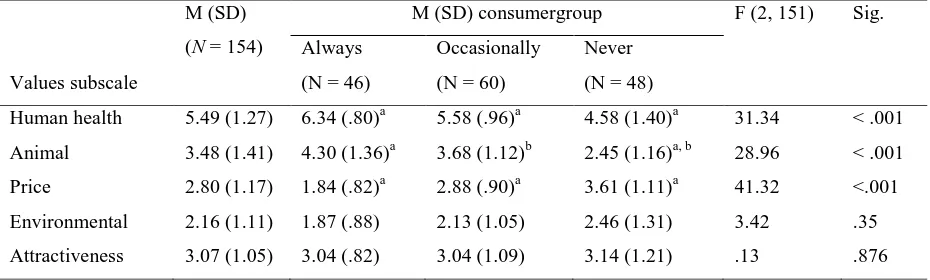
2.2.2.2 Values
22
A MANOVA was conducted on the five subscales of values with the consumergroups as independent variable. Using Wilks’s lambda, there was a significant effect of the consumergroups on the values,
Λ = .46, F(10, 294) = 13.99, p < .001, η2 = .98. This significant effect shows that the three
consumergroups differ on their values related to the concept of organic food.
[image:22.595.66.531.376.516.2]The MANOVA was followed up by five univariate ANOVAs for each of the subscales of the values. The results of these analyses showed that there was a significant effect of the consumergroups on their human health-centred, animal-centred, and price-centred values (table 7). For the environment-centred and attractiveness-centred values no significant effects were found. Bonferroni post-hoc analysis showed that the respondents in the always consumergroup value their health and the living conditions of animals highest. They attribute the least value to the price of organic food. There was no difference found between the always and occasionally consumergroups on animal-centred values, but the latter group attributes less value to human health and more value to price. The never consumergroup attributes least value to human health and animals, and most to price.
Table 7
Descriptive statistics and the results of the ANOVAs on the effect of the consumergroups on the subscales of values
Values subscale
M (SD)
(N = 154)
M (SD) consumergroup F (2, 151) Sig.
Always
(N = 46)
Occasionally
(N = 60)
Never
(N = 48)
Human health 5.49 (1.27) 6.34 (.80)a 5.58 (.96)a 4.58 (1.40)a 31.34 < .001
Animal 3.48 (1.41) 4.30 (1.36)a 3.68 (1.12)b 2.45 (1.16)a, b 28.96 < .001
Price 2.80 (1.17) 1.84 (.82)a 2.88 (.90)a 3.61 (1.11)a 41.32 <.001
Environmental 2.16 (1.11) 1.87 (.88) 2.13 (1.05) 2.46 (1.31) 3.42 .35
Attractiveness 3.07 (1.05) 3.04 (.82) 3.04 (1.09) 3.14 (1.21) .13 .876
Note: Low scores indicate little attributed value and high scores great attributed value to the respective subscale
Note: “a” Denotes a significant difference between the mean scores of the consumergroups on the respective subscale
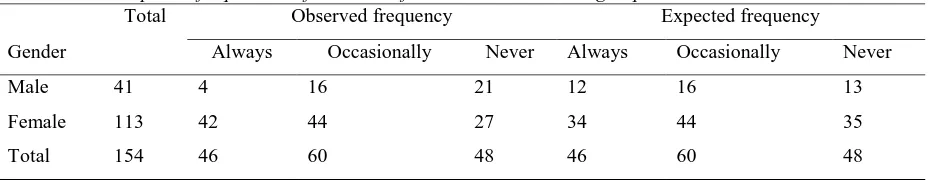
2.2.2.3 Socio-demographics
This section discusses the socio-demograhic information and the differences between the consumergroups in this regard. The results of a Pearson’s χ2
-test on the consumergroups and the respondents’ gender showed that the percentages of men and women in the respective consumergroups
are significantly different from an equal division across the consumergroups, χ2(2) = 14.78, p = .001. Post-hoc analysis using standardised residuals with a critical value of +/- 1.96 showed that significantly less males (than one would expect based on equal division across the consumergroups) always purchase organic food (z = -2.4) and significantly more males than expected never purchase organic food (z = 2.3). For females the standardised residual was not significant for the three groups (z
23 consumergroups differ foremost on their male population. Table 8 shows the observed and expected frequencies of males and females in each consumergroup.
Table 8
Observed and expected frequencies of males and females in the consumergroups
Gender
Total Observed frequency Expected frequency
Always Occasionally Never Always Occasionally Never
Male 41 4 16 21 12 16 13
Female 113 42 44 27 34 44 35
Total 154 46 60 48 46 60 48
The results of an ANOVA on the age of the respondents showed a significant difference between the three consumer groups (p = .02). Bonferroni post-hoc analysis showed that this difference (p = .03) can be attributed to consumers who always purchase organic food (M = 39) to be older than those who never purchase organic food (M = 32).
Kruskal-Wallis H tests were conducted to analyse whether the consumergroups differed on the level of education and financial situation. For both level of education χ2(2) = .37, p = .83 and financial situation χ2(2) = 2.44, p = .30 the tests showed no significant differences between the consumer groups.
2.2.3 Conclusion of Study 1
Overall, respondents mentioned associations concerning animal welfare, price, health, pesticides, and natural most often. The frequency of associations varied between the cues ‘food’, ‘meat’, and ‘vegetables’. Organic food was mostly associated with health, natural and animal welfare. Organic
meat was by far mostly associated with animal welfare, while respondents also often mentioned medicine, scepticism, and health, although they mentioned health less often than when prompted by food or vegetables. Organic vegetables prompted pesticides, health, and origin. The frequency of associations also varied between the three consumergroups. The always consumergroup mostly stated associations related to natural, health and taste. The occasionally consumergroup mostly mentioned health (on a par with the always consumergroup), price, and environment. The never consumergroup mentioned associations concerning price most often, considerably more often than the other groups and more often than other associations. They also often mentioned health, although considerably less often than the other groups, and origin.
24
most often choose for organic food, they most often desire more information, and experience most positive affect. In short, the psychological distance of the always consumergroup to organic food is small. This distance is greater for the occasional consumergroup, and even greater for the never consumergroup as the distance on the respective subscales of psychological distance increases.
The results additionally show that all consumergroups greatly value their health. They value animals, price, and attractiveness somewhat less, and attribute little value to the environment. The always consumergroup greatly values their health and animal welfare, while they do not attribute much value to price. The occasionally consumergroup attributes less value to health and animals, and more to price. This is even more strongly the case for the never consumergroup. These relations are also reflected in the associations.
The consumergroups also differ on their age and gender, indicating that consumers who never purchase organic food are more likely to be young and men. There are no apparent difference between women, indicating that all women are equally likely to be or not be consumers of organic food.
25
3.
Study 2
3.1
Method
In Study 2 another group of respondents analysed the categories of associations obtained in Study 1 on their prototypicality. The purpose of this study was to discover which associations are considered to be central and typical to the concept and what associations to be more peripheral.
3.1.1 Respondents
Respondents of the questionnaire for Study 2 were attracted by bringing the questionnaire to the attention of the social network of the researchers. Respondents of Study 1 and Study 2 did not overlap and were comparable, although the respondents in Study 1 were somewhat higher educated. The total number of respondents was 52 of whom 26 were in the organic food condition and 26 in the organic meat and vegetables condition. 26 (50%) Respondents were female and 23 (44%) male (3 missing responses). The respondents had a mean age of 39 years old (range = 19 - 71 years old). The respondents mainly had a higher education (60%). 31% Of the respondents had a professional education and 4% a secondary education. 46% Of the respondents could live (very) comfortably with their financial situation, 39% could get by, 6% had difficulty or struggled to get by, and 4% does not know. 19% Of the respondents always eats organic food, 42% occasionally, and 33% never.
3.1.2 Measurements
Study 2was a questionnaire consisting of questions with the purpose to elucidate the centrality of the associations with organic food, which were obtained through Study 1. The respondents were asked to rate the categories of associations on how typical they thought them to be for organic food, or meat and vegetables (in Dutch: “In hoeverre vindt u de volgende kenmerken passen bij biologische voeding?”). Two versions of the latter were constructed to counterbalance the order in which respondents were presented with organic meat and organic vegetables.The response scales for these items was a sevenpoint Likertscale, ranging from ‘not fitting’ to ‘very fitting’. The measurement of
socio-demographic variables included gender, age, level of education, financial situation, family composition, and purchase behaviour. The responent’s financial situation was measured by a question
whether the respondent could comfortably make a living. Their purchase behaviour was measured by a question whether they (nearly) always, occasionally or (nearly) never purchase organic food.
3.1.3 Procedure
26
of this study, and because ‘readily obtainable’ and ‘difficult to obtain’ are two extremes of the same continuum they were measured using just the former. A low result then indicates that ‘difficult to obtain’ is deemed more central to ‘organic food’. Moreover, the questionnaire included questions about the respondents’ socio-demographic information.
3.1.4 Data-analysis
For every association the mean centrality rating was calculated per foodgroup (organic food / organic meat / organic vegetables) and over all three groups. These are compared by means of a descriptive analysis across the groups on the centrality of the associations in general and on what associations are most central and most peripheral.
3.2
Results
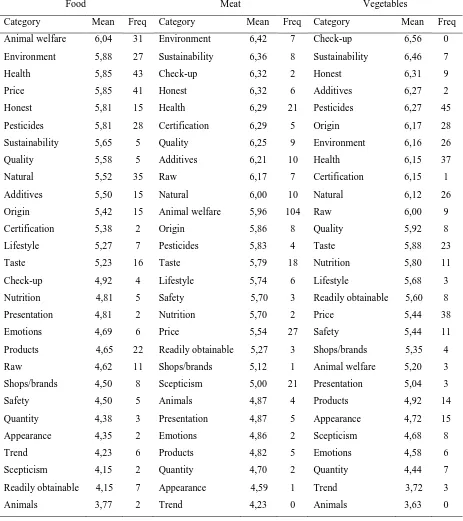
Table 9 shows the mean centrality ratings of the associations per foodgroup. The associations are sorted in this table along the mean centrality ratings per foodgroup. To assess which associations are most central and which should be regarded as peripheral to organic food, we follow Fehr (1988) in using the median split of the centrality ratings as the basis of the division. The median split of the centrality ratings of ‘food’ is 5.08, of ‘meat’ 5.77, and of ‘vegetables’ 5.74, meaning that all
associations with a higher centrality rating on the 7-point scale are considered central1. The remaining halfs are considered peripheral.
The results show that associations related to the environment, health, honesty, pesticides, sustainability, quality, natural, additives, origin, certification, and taste were deemed most central to organic food over all foodgroups. Interestingly, associations were generally rated lower on the centrality scale when they concerned ‘organic food’ than associations that concerned ‘organic meat’ and ‘organic vegetables’. The main difference between the general conception ‘food’ and the more specific instances ‘meat’ and ‘vegetables’ was that the centrality ratings were much lower for food
than for meat and vegetables, which resulted in a much lower median split. Consequently, lifestyle is central to food and not to meat and vegetables, even though the centrality rating was lower in the case of food. Price, on the other hand, was rated considerably more central to food than to meat and vegetables. Animal welfare was not deemed central to vegetables in line with what one would expect. Associations that were central to meat and vegetables, though not to food, were check-up and raw. Nutrition was rated central only to vegetables.
1
Fehr (1988) hereby notes that it is important to take into account that all associations are to some extent related
to the concept. Consequently, centrality ratings are expected to be somewhat higher than the midpoint of the
27 Comparing the centrality ratings for the foodgroups with the frequency of the associations (table 9) no surprising effects were found for associations with organic food. The associations with organic food that are mentioned most often in Study 1, thus, also have high centrality ratings. Interestingly, this relation does not hold for the associations with organic meat and vegetables. As for assocations with organic meat, associations concerning the environment, sustainability, honesty and check-up had the highest centrality ratings, though they were mentioned only a few times and check-up hardly at all. Health was the only association for which the centrality rating corresponded to its frequency. For organic vegetables pesticides, origin, environment and health were mentioned most often, and their centrality ratings are quite high. The ratings are only higher for check-up, additives, sustainability and honest. Assocations concerning the latter two were, however, not mentioned often, and associations concerning the former two hardly and not at all.
3.3
Conclusion of Study 2
28 Table 9
Mean centrality ratings and frequencies (from Study 1) of the associations with organic food, meat and vegetables
Food Meat Vegetables
Category Mean Freq Category Mean Freq Category Mean Freq
Animal welfare 6,04 31 Environment 6,42 7 Check-up 6,56 0
Environment 5,88 27 Sustainability 6,36 8 Sustainability 6,46 7
Health 5,85 43 Check-up 6,32 2 Honest 6,31 9
Price 5,85 41 Honest 6,32 6 Additives 6,27 2
Honest 5,81 15 Health 6,29 21 Pesticides 6,27 45
Pesticides 5,81 28 Certification 6,29 5 Origin 6,17 28
Sustainability 5,65 5 Quality 6,25 9 Environment 6,16 26
Quality 5,58 5 Additives 6,21 10 Health 6,15 37
Natural 5,52 35 Raw 6,17 7 Certification 6,15 1
Additives 5,50 15 Natural 6,00 10 Natural 6,12 26
Origin 5,42 15 Animal welfare 5,96 104 Raw 6,00 9
Certification 5,38 2 Origin 5,86 8 Quality 5,92 8
Lifestyle 5,27 7 Pesticides 5,83 4 Taste 5,88 23
Taste 5,23 16 Taste 5,79 18 Nutrition 5,80 11
Check-up 4,92 4 Lifestyle 5,74 6 Lifestyle 5,68 3
Nutrition 4,81 5 Safety 5,70 3 Readily obtainable 5,60 8
Presentation 4,81 2 Nutrition 5,70 2 Price 5,44 38
Emotions 4,69 6 Price 5,54 27 Safety 5,44 11
Products 4,65 22 Readily obtainable 5,27 3 Shops/brands 5,35 4
Raw 4,62 11 Shops/brands 5,12 1 Animal welfare 5,20 3
Shops/brands 4,50 8 Scepticism 5,00 21 Presentation 5,04 3
Safety 4,50 5 Animals 4,87 4 Products 4,92 14
Quantity 4,38 3 Presentation 4,87 5 Appearance 4,72 15
Appearance 4,35 2 Emotions 4,86 2 Scepticism 4,68 8
Trend 4,23 6 Products 4,82 5 Emotions 4,58 6
Scepticism 4,15 2 Quantity 4,70 2 Quantity 4,44 7
Readily obtainable 4,15 7 Appearance 4,59 1 Trend 3,72 3
29
4.
Discussion
Research into consumers of organic food has largely focused on consumers’ motivations to purchase
organic food. However, little is known about their associations with organic food, while this is essential to be able to properly respond to the growth of the organic food market. The identification of associations and an understanding of the differences between consumers is essential to properly adapt policy making and advertising to consumers’ perceptions of organic food. Comprehension of the associations is important in order to understand consumers’ conceptualisations of organic food,
regardless of whether it is a reason to purchase the product. How these conceptualisations differ between consumers with different purchase behaviours of organic food leads to an increased understanding of the differences in perception of organic food. Furthermore, to increase this understanding it is important to compare the perceptions of organic food between consumers with different purchase behaviours.
The current research therefore aimed to investigate what associations consumers with different purchase behaviours have with organic food. Specifically, we investigated consumers’ associations with organic food as well as organic meat and vegetables, in order to compare more abstract and concrete instances of the concept. We also examined differences in associations with organic food between consumers with different purchase behaviours of organic food to increase understanding of the differences in perceptions of organic food. Furthermore, we examined differences in characteristics between the consumergroups in order to increase understanding of the consumers who do or do not (often) purchase organic food.
4.1
Consumers’ associations
We carried out a prototype analysis using convenience samples in two studies to investigate what associations consumers have with organic food and what associations are most central. We also explored consumers’ psychological distance to organic food, their human-centred, animal-centred and
30
this regard. Interestingly, while health is a very prevalent association and safety and nutrition are quite prevalent, wellbeing was not mentioned at all as an association with organic food. These discrepancies might exist because these motivations are not directly associated with organic food itself, but are more concerned with a certain lifestyle in which people are conscious consumers of food.
Unlike the research into motivations, consumers in the current research hardly ever mentioned associations regarding a lack of confidence in the non-organic food industry or organic food to be local. Scepticism was addressed mainly towards organic meat. They did not mention at all that organic food supports the local economy. These motivations may not be associated with organic food as such, but instead concern the overall practice of organic food production.
Furthermore, barriers to not purchase organic food that appear from the research into consumers’ motivations are the costs and lack of availability of organic foods. While price is indeed a prevalent association with regard to the number of times it was mentioned, it was perceived as a peripheral association with organic meat and vegetables. Consumers also did not greatly value price, though always consumers thought it to be of value even less than never consumers. The relation, therefore, between the costs of organic food and its purchase might be more complex and dependent on additional factors. The lack of availability of organic food appears to be a motivation of consumers not to purchase it. Consumers would have to go to great lenghts to make the purchase and it is understandable that consumers would not want to make such an effort. However, it is appears from the associations as well as the spatial distance that organic food is quite prevalent in the physical environment.
Among the more peripheral motivations is also concern for the environment. Interestingly, environmental concern scored high on the mean centrality ratings. Regarding values, however, scores on environmental values were all low, possibly because the statements used to assess environment-centred values were posed in comparison to the price. What was most surprising was that the scores of the always consumergroup was lowest and the never consumergroup highest. This difference showed not to be significant in this study, but we might still explore the idea that consumers with different purchase behaviour have different takes on environmental concern. The difference might be explained by the possibly greater negative influence of organic meat production on the environment than ‘regular’ meat production, which was addressed by several respondents. Consumers who always
purchase organic food may value the animal-centred values more highly than environment-centred values, while this difference does not exist in consumers who never purchase organic food. Both animal-centred and environment-centred values were measured by comparing them to the price. A different comparison, for instance to each other or a different value such as one’s health, might have
31
4.2
Differences between foodgroups
The results showed an interesting difference between different foodgroups. Consumers do not particularly associate meat with healthiness and the environment, and, instead, are more sceptical about meat than vegetables. The reason for this might be that consumers do not find organic meat more healthy or environment-friendly. Instead, their associations might be mainly focused on the animal, which also shows in the prominance of animal welfare. Vegetables, on the other hand, are more associated with appearance, nutrition, and safety, which indicates that consumers are mostly concerned with their own health in relation to vegetables.
Interestingly, the frequency of the associations with organic food corresponds with the centrality ratings in the case of organic food, but there is inconsistency in the cases of organic meat and organic vegetables. The associations that were mentioned most often in the first study in relation to organic meat or vegetables do not fully correspond with the centrality ratings for the respective assocations. A possible reason for this discrepancy may be that the association is such an obvious aspect of or inherent to organic food that it simply does not come to one’s mind. Furthermore, respondents
possibly noted associations that they may not have found directly related to the specific food type, but which they nonetheless wrote down because they found it at least related to the general topic of the study.
Then, to make sense of organic food and how more and less specific instances relate to each other by incorporating the information gathered we return to the Construal Level Theory. Following CLT we would predict that ‘organic food’ should bring to mind more abstract and distant entities than ‘organic meat’ and ‘organic vegetables’. Such a distinct difference was not found in this research as the
associations were considerably analogue. However, there was distinct dissimilarity in the general centrality ratings. These ratings were overall considerably lower for associations with organic food than meat and vegetables. Organic food as a general concept thus possibly brought to mind more abstract associations that were deemed more distant. This would in turn result in a low centrality rating, since these associations are then not necessarily perceived to be very central and prototypical for the concept.