Predictability of Vesicoureteral Reflux Using Interlobar
Renal Arterial Resistive Indices in Sonographically Normal
Pediatric Kidneys-Preliminary Results
John Amodio1*, Rafael Rivera2, Lynne Pinkney2, Naomi Strubel2, Nancy Fefferman2 1
Department of Radiology, SUNY Downstate Medical Center, New York, USA 2
Department of Radiology, New York University School of Medicine, New York, USA Email: *John.Amodio@Downstate.edu
Received May 17, 2012; revised June 20, 2012; accepted June 30,2012
ABSTRACT
Objective: To prospectively evaluate the diagnostic utility of interlobar renal arterial resistive index values, in
predict-ing the presence of vesicoureteral reflux in children with sonographically normal appearpredict-ing kidneys. Methods: We
investigated 35 children with a history of urinary tract infection with grayscale and color Doppler ultrasound (US) fol-lowed by a standard voiding cystouretherogram to assess the presence of vesicoureteral reflux. All renal units (individ-ual kidneys) were morphologically normal without evidence of hydronephrosis. Resistive index (RI) was measured at the level of the interlobar arteries. Results: Of a total of 67 kidney units, 3 kidney units yielded no diagnostic results due to technical factors (crying, agitation). 46 kidney units (69%) were not associated with any degree of reflux. 17 kidney units (25%) were associated with low-mid grade reflux (grades I - III). 4 kidney units (6%) were associated with high grade reflux (grades IV - V). No statistically significant correlation was found between the interlobar resistive in-dices of sonographically normal appearing kidneys and the presence, absence, or degree of vesicoureteral reflux. Con-clusions: The results of this study suggest that resistive index measurements taken in the interlobar arteries of sono-graphically normal appearing kidneys cannot be used to predict the presence or absence of vesicoureteral reflux.
Keywords: Kidney; Reflux; Resistive Index; Ultrasound; Urinary Tract Infection; Pediatrics
1. Introduction
Urinary tract infections are very common in the pediatric population, especially in girls. Most children with vesi-coureteral reflux and urinary tract infections have an ex-cellent prognosis with resolution of reflux by 4 years of age. The greatest risk of renal involvement in urinary tract infection is in newborn boys and pre-school age girls [1].
According to the guidelines of the American Academy of Pediatrics (AAP), a sonogram should be performed on all infants and young children with fever and their first documented UTI; prior to 2011, according to the AAP guidelines of 1999, voiding cystourethrography (VCUG) or radionuclide cystography (RCN) were recommended. New AAP guidelines [2] have recently been proposed for children with urinary tract infections (UTI). It is now re- commended that VCUG or RCN not be done after the first febrile UTI. This is based on the fact that “the risks, costs, and discomfort of the VCUG are hard to justify, because there is no evidence that patients benefit from
having their VUR diagnosed” [2].
Regardless of the new AAP recommendations, it has been shown that a normal renal sonogram does not ex-clude the presence of vesicoureteral reflux, even in chil-dren aged 5 years or older. Therefore, if reflux is consid-ered, a VCUG must be performed even in older children, regardless of the sonographic findings [3].
There are some studies regarding the effects of reflux on renal blood flow. Paltiel [4] studied the effect of chro- nic, low pressure reflux on renal growth and function in a porcine model. The results of that study showed that such reflux, in pigs, led to mild chronic interstitial inflamma-tion and fibrosis after 1 year. However, the imaging find- ings were normal.
Helin [5] studied blood flow parameters, including re-nal vascular resistance, in piglets with unilateral ureteric pressure elevation, as may happen in vesicouretero reflux. In that study no significant changes in renal vascular re-sistance was found between normal kidneys and those in which there was elevated ureteric pressure.
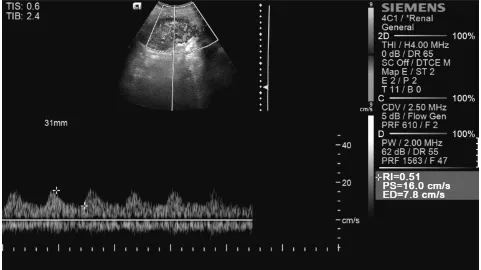
Resistive index (RI) is defined, in Doppler ultrasound, as the ratio of the peak systolic velocity minus the end *Corresponding author.
diastolic velocity/peak systolic velocity. RI is widely used a measurement of resistance of arterial flow, and elimi-nates the need for precise angle-measurements of blood flow. Most ultrasound machines can automatically cal-culate the RI within an arterial structure automatically, as illustrated in Figure 1.
Radmayr [6] studied the relationship for resistive in-dex (RI), reflux and scarring. Patients with VUR grades IV and V demonstrated a statistically significant increase in RI compared to those with low grade or no reflux. The author concluded that a possible cause of these elevated RIs may be the presence of renal scarring, found in many children with higher grades of reflux. The author also recommended routine determination of RI during renal ultrasound examinations to detect renal injury and scar-ring in patients with VUR.
Our study was performed in effort to evaluate the fol-lowing research questions:
1) Is there an alteration of the resistive indices of the interlobar arteries, in children with reflux and sonogra- phically normal appearing kidneys?
2) If such an alteration in RI exists, can these measure- ments be used to predict the presence or absence of vesi- coureteral reflux?
3) Is there a correlation between resistive index and the grade of reflux?
Given the known pathophysiology of reflux and renal blood flow in animals with reflux, our hypothesis was
that resistive index would not be a positive predictor of reflux in children, and therefore, not a useful tool to pre-dict the presence or absence of reflux in normal appear-ing kidneys on sonography.
2. Materials and Methods
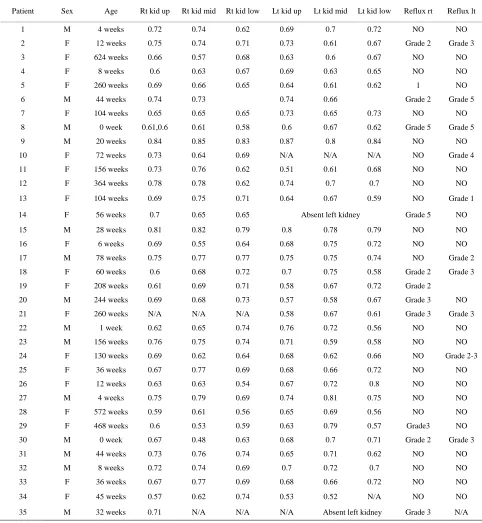
After obtaining IRB approval, we investigated 35 chil-dren with a history of UTI with grayscale and color Dop-pler US followed by a standard voiding cystourethero-gram to assess the presence of vesicoureteral reflux. Ages ranged from newborn - 12 years of age. There were 14 males and 21 females. All renal units (individual kid-neys) were morphologically normal without evidence of hydronephrosis or renal scarring. Resistive index (RI) was measured at the level of the interlobar arteries. The arcuate arteries were not selected due to technical diffi-culties in obtaining Doppler measurements in such small structures, which relies on patient cooperation. Three measurements of the interlobar RIs were obtained at the level of the upper, mid, and lower poles of each kidney.
[image:2.595.57.538.440.710.2]All sonograms were performed on the Siemens Anta- res unit. Each sonogram was performed by one of two experienced ultrasound technicians. All VCUGs were performed fluoroscopically and the results of each study were tabulated by one of five experienced pediatric radi-ologists (with a range of 5 - 20 years of experience). Re-flux grade was assigned according to the international reflux grading system (Grades I - V). RI values were then
abulated with VCUG results. t
3. Results
of the results of this study is presented in
(25%) were associated with low-mid grade reflux (grades
ed in the three positions of ea
rates the number and percentages of in
p sence, absence, and grade of reflux.
Patient Sex Reflux rt Reflux lt
A tabulation
[image:3.595.56.538.215.738.2]Table 1. A total of 67 kidney units were assessed. 3 kid-ney units yielded no diagnostic results due to technical factors (crying, agitation). 46 kidney units (69%) were not associated with any degree of reflux. 17 kidney units
Table 1. Summary of RI values and
I - III). 4 kidney units (6%) were associated with high grade reflux (grades IV - V).
The mean RI values obtain
ch kidney are summarized in Table 2. The overall
mean RI was 0.68. Table 3 demonst
fants with each grade of reflux in both kidneys. Here,
re
Age Rt kid up Rt kid mid Rt kid low Lt kid up Lt kid mid Lt kid low
1 M 4 weeks 0.72 0.74 0.62 0.69 0.7 0.72 NO NO
2 F 12 weeks 0.75 0.74 0.71 0.73 0.61 0.67 Gr G
260
Gr G
0. 0
0. Gr G
20
G
G
Absent left kidney Gr
0.8 0.79
G
Gr
NO
G
156
Gr 3
572
G
G
44
t left k Grade 3
ade 2 rade 3
3 F 624 weeks 0.66 0.57 0.68 0.63 0.6 0.67 NO NO
4 F 8 weeks 0.6 0.63 0.67 0.69 0.63 0.65 NO NO
5 F weeks 0.69 0.66 0.65 0.64 0.61 0.62 1 NO
6 M 44 weeks 0.74 0.73 0.74 0.66 ade 2 rade 5
7 F 104 weeks 0.65 0.65 65 0.73 0.65 .73 NO NO
8 M 0 week 61,0.6 0.61 0.58 0.6 0.67 0.62 ade 5 rade 5
9 M weeks 0.84 0.85 0.83 0.87 0.8 0.84 NO NO
10 F 72 weeks 0.73 0.64 0.69 N/A N/A N/A NO rade 4
11 F 156 weeks 0.73 0.76 0.62 0.51 0.61 0.68 NO NO
12 F 364 weeks 0.78 0.78 0.62 0.74 0.7 0.7 NO NO
13 F 104 weeks 0.69 0.75 0.71 0.64 0.67 0.59 NO rade 1
14 F 56 weeks 0.7 0.65 0.65 ade 5 NO
15 M 28 weeks 0.81 0.82 0.79 0.78 NO NO
16 F 6 weeks 0.69 0.55 0.64 0.68 0.75 0.72 NO NO
17 M 78 weeks 0.75 0.77 0.77 0.75 0.75 0.74 NO rade 2
18 F 60 weeks 0.6 0.68 0.72 0.7 0.75 0.58 ade 2 Grade 3
19 F 208 weeks 0.61 0.69 0.71 0.58 0.67 0.72 Grade 2
20 M 244 weeks 0.69 0.68 0.73 0.57 0.58 0.67 Grade 3
21 F 260 weeks N/A N/A N/A 0.58 0.67 0.61 Grade 3 rade 3
22 M 1 week 0.62 0.65 0.74 0.76 0.72 0.56 NO NO
23 M weeks 0.76 0.75 0.74 0.71 0.59 0.58 NO NO
24 F 130 weeks 0.69 0.62 0.64 0.68 0.62 0.66 NO ade
2-25 F 36 weeks 0.67 0.77 0.69 0.68 0.66 0.72 NO NO
26 F 12 weeks 0.63 0.63 0.54 0.67 0.72 0.8 NO NO
27 M 4 weeks 0.75 0.79 0.69 0.74 0.81 0.75 NO NO
28 F weeks 0.59 0.61 0.56 0.65 0.69 0.56 NO NO
29 F 468 weeks 0.6 0.53 0.59 0.63 0.79 0.57 rade3 NO
30 M 0 week 0.67 0.48 0.63 0.68 0.7 0.71 Grade 2 rade 3
31 M weeks 0.73 0.76 0.74 0.65 0.71 0.62 NO NO
32 M 8 weeks 0.72 0.74 0.69 0.7 0.72 0.7 NO NO
33 F 36 weeks 0.67 0.77 0.69 0.68 0.66 0.72 NO NO
34 F 45 weeks 0.57 0.62 0.74 0.53 0.52 N/A NO NO
67 of the sample ht k ys dem rated
(±standard deviation) of the
Left kidney
.65% size’s rig idne onst
no reflux, and 69.70% of the study population’s left kid-neys demonstrated no reflux.
Each p value in Table 4 is two-sided, and was not ad-justed for the fact that multiple hypothesis tests were performed. Since a multiple hypothesis correction will increase each p value, and no p value is less than 0.05, then the overall conclusion is that there are no significant results (irrespective of correction).
[image:4.595.56.289.340.402.2]Our study had 80% power at the 5% significance level to detect a decline of at least 0.065 in the resistive index associated with reflux in either the left or right kidney. More specifically, a test to determine whether reflux is associated with a decline in resistive index would have approximately 80% power if the true mean of the resis-tive index is 0.065 units lower among infants with reflux than among those without it.
Table 2. Resistive index mean
resistive index in the upper, middle, and lower poles of the right and left kidneys.
Position Right kidney
Lower pole 0.679 +/– 0.07 0.676 +/– 0.07
Mid pole 0.687 +/– 0.09 0.680 +/– 0.07
Upper pole 0.688 +/– 0.07 0.676 +/– 0.08
d percentage of
Tab umber an in
ft kidney
le 3. The n fants with each
grade of reflux in the right and left kidneys.
Right kidney Le
Reflux grade
Count Percent Count Percent
0 (none) 23 67.65 23 69.70
1 1 2.94 1 3.03
2 5 14.71 1 3.03
3 3 8.82 5 15.15 4 0 0.00 1 3.03
5 2 5.88 2 6.06
Tab on ue b the resistive
inde h location and each ki
Ag wa juste multip othe
since the unc d p were er th 5.
Th
re
lues are related to ss than a year of age, the maximum RI 0.08. In the second year of life on, the
Resistive index location Correlation with reflux grade in
[image:4.595.56.289.439.564.2]Total 34 100 33 100
Table 4. p values to compare infants with and without reflux in the left kidney, right kidne and at least one kidney with respect to the resistive index in each position of the kidney.
Resistive index location
y,
Kidney Position
Right kidney Left kidney Reflux in reflux: absent reflux: either versus present absent verses
present
kidney: yes vs. no
Left Lower 0.084 0.250 0.085
Left Middle 0.527 0.930 0.597
Left Upper 0.095 0.948 0.246
Right Lower 0.487 0.803 0.908
Right Middle 0.095 0.413 0.140
le 5 dem strates the p val etween x in eac
ain, it
reflux grade i d for
n le hyp
dney. sis tests, s not ad
orrecte values great an 0.0
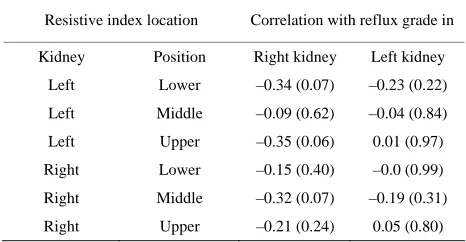
e conclusion is that there is no significant correlation between resistive index and reflux grade, irrespective of whether a multiple hypothesis correction is applied.
Lastly, Table 6 demonstrates the statistical signifi-cance in predicting reflux at various parts of the kidney with a given resistive index, adjusted after the potential confounding effects of age and gender. This logistical
gression analysis had an 80% power at the 5% signifi-cance level to detect an odds ratio of 2.85. It, moreover, successfully concludes that there is no significant predic-tive value of resispredic-tive index in reflux. The left lower re-sistive index demonstrated a p value of less than 0.1 in predicting reflux in at least one kidney.
4. Discussion
What is the normal RI value of the interlobar arteries in children? Radmayr [6] found that RI va
age. In children le value is 0.77 +/–
[image:4.595.306.539.444.565.2]RIs are less than 0.7. The mean RI taken at all ages is 0.6 +/– 0.06. All of the RIs obtained in our study were within this range and therefore normal.
Table 5. Spearman correlation (p value) between the resistive index in each location and the reflux grade in the kidney.
Kidney Position Right kidney Left kidney
Left Lower –0.34 (0.07) –0.23 (0.22)
Left Middle –0.09 (0.62) –0.04 (0.84)
Left Upper –0.35 (0.06) 0.01 (0.97)
Right Lower –0.15 (0.40) –0.0 (0.99)
Right Middle –0.32 (0.07) –0.19 (0.31)
Right Upper –0.21 (0.24) 0.05 (0.80)
Table ue assessme from gressi
dicti ux in the idney , o e
of th idneys, after adjustin ge and gender. 6. p val
ng refl
nt, right k
logistic re , left kidney
on, of pre-r at least on
e two k g for infant a
Resistive index location Predicting reflux in
Kidney Position Right kidney Left kidney At least 1
Left Lower 0.127 0.194 0.093
Left Middle 0.619 0.664
Right
Right
Right
0.752
Left Upper 0.120 0.703 0.217
Lower 0.472 0.998 0.984
Middle Upper 0.078 0. 0.164 0. 308 0. 984 0. 133 605
[image:4.595.55.284.613.734.2]Measureme esistiv ex is nvasi
g-nos it tudyi anges ovas -
sis Sinc ratio indep t of t
p-ple e, RI re eal w stud
n-tra
ch variable thus far (i.e. RI or reflux), bu
ically significant correlation exists be
However, elevated renal RIs may suggest re
, Vol. 19, No. 2, 2004, pp. 148-152. doi:10.1007/s00467-003-1305-z
nt of r e ind a noni ve dia
tic modal y for s ng ch in ren cular re
tance. e it is a , and enden he Do
r angl values a an id ay of ying i
renal resistance in difficult or non cooperative patients. Elevated RIs (RI > 0.7) can be encountered in diseases involving the tubulointerstitial or vascular system (e.g. lupus nephritis) [7,8].
It is well known that intrarenal reflux has a predilec-tion for affecting the upper and lower poles of the kidney, which is thought to be the result of the morphology and vertical orientation of the renal papillae in these regions. [9]. Funson and Cremin [10] found that there is an abun-dance of compound papillae in the upper and lower pole regions and were more subject to intra renal reflux, espe-cially at lower pressures. Therefore, might the RIs be dif- ferent in the upper and lower poles compared to the mid pole region? Three regions of each kidney were studied with Doppler sonography in our study, to determine if there are any differences in RI measurements in these locations in refluxing kidneys. However, no statistically significant differences in the RI values in the various poles of the kidneys, associated with reflux alone, were seen.
Kawauchi et al. [11] studied two populations of chil-dren, and both groups demonstrated vesicoureteral reflux. One group, however, did not demonstrate renal scarring on radionuclide studies, while the other group did dem-onstrate evidence of renal scarring. The results of this study showed that the RIs were significantly elevated in kidneys with scars compared to those without scars. The authors concluded that it must be renal scarring which produces parenchymal damage, which in turn, elevates the RI and not reflux alone. The authors also concluded that the increased RI in refluxing kidneys may predict the presence of renal scarring and is therefore useful for fol-low up in patients with documented reflux on VCUG. The results of our study would suggest this may be true.
There are several limitations of our study. The sample size is small and this study is continuing to acquire more data. Given our results, a higher sample size may have theoretically produced a statistically significant associa-tion between RI and vesicoureteral reflux. While the sta-tistical power in our study was enough to demonstrate a difference had one existed, a larger sample size may have yielded p values less than 0.05.
Secondly, none of our patients had radionuclide imag-ing to document the presence or absence of renal scarrimag-ing. We assumed that no significant parenchymal damage existed, since all of the kidneys were morphologically normal on sonography. However, nuclear imaging is more sensitive for the detection of renal scarring than ultrasound [12].
Our study, however, is a harbinger for future studies. It
is the first, using sonographically normal kidneys, to in-vestigate the predictive value of resistive indices in vesi-coureteral reflux. Other studies have demonstrated the importance of ea
t have not used a model of clinically normal kidneys to extract a possible relationship. Such an undertaking ac-curately simulates clinical scenarios. In addition, the prior literature suggests that elevated RIs are the result of parenchymal scarring. Therefore, elevated renal RIs in the face of reflux might be a predictor of renal scarring, and might prompt the investigation of such using ra-dionuclide imaging.
In summary, our preliminary results suggest that resis-tive index measurements taken in the interlobar arteries of sonographically normal appearing kidneys do not pre-dict the absence or presence of vesicoureteral reflux. Ad-ditionally, no statist
tween RI values and reflux grade. Our results also confirm prior studies, in that elevated RIs are not related to reflux per se, but are more likely to be a predictor of renal scarring.
In the imaging workup of children with urinary tract infections and sonographically normal appearing kidneys, interlobar RI values are not predictive of vesicoureteral reflux. A VCUG is still required to evaluate for the pres-ence of reflux.
nal scarring, in the presence of reflux, and lead to fur-ther work-up with radionuclide imaging.
REFERENCES
[1] G. Ozcelij, T. B. Polat, S. Aktas, et al., “Resistive Index in Febrile Urinary Tract Infections: Predictive Value of Renal Outcome,” Pediatric Nephrology
[2] “Urinary Trac ctice Guideline for
ffect
r, C. Maneschg, et al., “Importance of Renal Resistive Index in Children Suffering from Vesi-
t Infection: Clinical Pra
the Diagnosis and Management of the Initial UTI in Feb- rile Infants and Children 2 to 24 Months,”Pediatrics, Vol. 128, No. 3, 2011, pp. 595-610.
http://pediatrics.aappublications.org/content/128/3/595.ab stract?sid=55efde08-204d-42ff-8055-dc65999b96b2
[3] M. A. Di Pietro, C. E. Blane and J. M. Zerin, “Vesicoure- tral Reflux in Older Children: Concordance of US and Voiding Cystourethrographic Findings,” Radiology, Vol. 205, No. 3, 1997, pp. 821-822.
[4] H. Paltiel, R. Mulkern, A. Perez-Atayade, et al., “E of Chronic, Low Pressure, Sterile Vesicoureteral Reflux on Renal Growth and Function in a Porcine Model: A Ra- diologic and Pathologic Study,” Radiology, Vol. 217, No. 2, 2000, pp. 507-515.
[5] I. Helin, L. Okmian and T. Olin, “Renal Blood Flow and Elevated Ureteric Pressure,” Scandinavian Journal of Urology and Nephrology, Vol. 28, No. 1, 1975, pp. 53- 69.
coureteral Reflux,” European Urology, Vol. 36, No. 1, 1999, pp. 75-79. doi:10.1159/000019931
[7] M. Arima, M. Ishibashi, M. Usami, et al., “Analysis of the Arterial Blood Flow Patterns of Normal and
Al-upus Nephritis:
aller, Eds., Caffey’s Pediatric Diagnostic
ecropsy Kidneys,” British Journal of Radiology, lografted Kidneys by the Directional Ultrasonic Doppler
Technique,” Journal of Urology, Vol. 122, No. 1, 1979, pp. 587-590.
[8] J. F. Platt, J. M. Rubin and J. H. Ellis, “L
Vol.
Predictive Value of Conventional and Doppler US and Comparison with Serologic and Biopsy Parameters,” Ra-diology, Vol. 203, No. 1, 1997, pp. 82-86.
[9] J. Haller, “Urinary Tract and Retroperitoneum,” In: K. Slovis and H
Imaging, 10th Edition, Mosby, Philadelphia, 2004, p.
1860.
[10] M. R. Funston and B. J. Cremin, “Intrarenal Reflux— Papillary Morphology and Pressure Relationships in Child- ren’s N
51, No. 609, 1978, pp. 665-670. doi:10.1259/0007-1285-51-609-665
[11] A. Kawauchi, Y. Yamao, O. Ukimura, et al., “Evaluation of Reflux Using Renal Resistive Inde
logy, Vol. 165, No. 6, 2001, pp. 2010
x,” Journal of Uro-
-2012. doi:10.1016/S0022-5347(05)66282-9
[12] A. Calado, U. Barroso, V. Barroso, et al., “Ultrasound Evaluation of Renal Scarring in Children w
coureteral Reflux,” Brazilian Journal
ith