z
Determination Functionality and Inf
Regional Development Perspective from Developing Country (India)
1,*Suman PAUL
Krishnagar Govt. College, West Bengal, India
2
Department of
ARTICLE INFO ABSTRACT
Urbanization and regional development are closely
specialization of business influence urban growth which diffuses its benefits to the surrounding countryside. Subsequently, socio
cannot be sustained rather declining growth will certainly set in long run. Optimum level of its growth depends on the capacity of an urban centre to provide required facilities to the people in fair manner. Hierarchical growth urban centres in association with location of civic amenities induces regional development in hierarchical dimension which is the common problem in developing economy. Subsequently, few of the urban centres are having large number of facilities while o
pragmatic planning model is the rescue of wiping out such problems. It is an attempt to analyze the hierarchical growth of urban centres associated with their functional potentiality
impulses to the surrounding rural part. Further, it proposes a model for developing economy like India to solve the problem of regional variations of development. Besides, it examines the adequacy and inadequacy of faci in the urban centres and puts forward planning recommendations, so that a balanced regional development would be achieved by not leaving any rural part out of the zone of functional influence of urban centre.
INTRODUCTION
India is predominantly a rural country where most of the people live
in villages, hamlets or a small group of huts (Verma, 2006
noticeable that, India is experiencing rapid rate of population growth and urbanization. In 2001, it recorded 27.78 per cent urbanization which was much lower than the world average 47 per cent, Asian average 38 per cent, but little higher than Bangladesh i.e., 25 per cent and Sri Lanka i.e., 23 per cent (United Nations 2001).
of urbanization is a complex system which comprises a set of interdependent entities, objectives, activities, infrastructure an (Tiwari et al., 1986) and however it is the testimony of socio
economic and cultural development of a region or human group (Ali et al., 2008). In India, the process is the consequences of
industrialization (Bhagat 2002). Therefore, it is equipped with the
potentialities of development of the non-agricultural sectors (
et al., 2007). Urban growth is occurred due to the movement of people from rural area to towns, smaller towns to bigger towns or cities and peripheral village to towns. Such a movement is generated due to the pull factors which attract immigrants towards urban centres and push factors which cause outmigration (
2006). Urban centres with location of seats of government, education,
medical, financial and industrial units radiate growth impulses outward and subsequently bring significant economic
region (Mandal, 2000). Besides, they provide a variety of highly
centralized services for the surrounding rural part, like, marketin agricultural products, supply of fertilizers, engineering goods, agricultural implements which are important
development (Hoselitz, 1971). In due course of time, specialization of
business is generated in the urban centres and later, the
benefits diffused to the countryside (Lampard, 1955
proper growth and development of
*Corresponding author: [email protected]
ISSN: 0975-833X
Article History:
Received 30th November, 2012 Received in revised form 19th December, 2012 Accepted 22th January, 2013 Published online 14th February, 2013
Key words: Urban Growth, Regional Development, Urban Influence, Functional Weightage.
RESEARCH ARTICLE
Determination Functionality and Influence of Urban Centres: An Approach of
Regional Development Perspective from Developing Country (India)
Suman PAUL and
2Kanan CHATTERJEE
Krishnagar Govt. College, West Bengal, India
Department of Geography, University of Calcutta, Kolkata, India
ABSTRACT
Urbanization and regional development are closely associated. Allocation of higher and lower order facilities and specialization of business influence urban growth which diffuses its benefits to the surrounding countryside. Subsequently, socio-economic development of the region comes into being. The conti
cannot be sustained rather declining growth will certainly set in long run. Optimum level of its growth depends on the capacity of an urban centre to provide required facilities to the people in fair manner. Hierarchical growth urban centres in association with location of civic amenities induces regional development in hierarchical dimension which is the common problem in developing economy. Subsequently, few of the urban centres are having large number of facilities while others are lacking corresponding to their population size. Formulation of pragmatic planning model is the rescue of wiping out such problems. It is an attempt to analyze the hierarchical growth of urban centres associated with their functional potentiality
impulses to the surrounding rural part. Further, it proposes a model for developing economy like India to solve the problem of regional variations of development. Besides, it examines the adequacy and inadequacy of faci in the urban centres and puts forward planning recommendations, so that a balanced regional development would be achieved by not leaving any rural part out of the zone of functional influence of urban centre.
Copy Right, IJCR, 2013, Academic Jo
India is predominantly a rural country where most of the people live
Verma, 2006). It is noticeable that, India is experiencing rapid rate of population growth and urbanization. In 2001, it recorded 27.78 per cent urbanization which was much lower than the world average 47 per cent, Asian cent, but little higher than Bangladesh i.e., 25 per cent (United Nations 2001). The process of urbanization is a complex system which comprises a set of interdependent entities, objectives, activities, infrastructure and land ) and however it is the testimony of
socio-on or human group ). In India, the process is the consequences of
is equipped with the
agricultural sectors (Ali
). Urban growth is occurred due to the movement of people from rural area to towns, smaller towns to bigger towns or lage to towns. Such a movement is generated ct immigrants towards urban
cause outmigration (Ahmad et al.,
). Urban centres with location of seats of government, education, , financial and industrial units radiate growth impulses outward and subsequently bring significant economic change in the ). Besides, they provide a variety of highly centralized services for the surrounding rural part, like, marketing of agricultural products, supply of fertilizers, engineering goods, implements which are important for regional ). In due course of time, specialization of business is generated in the urban centres and later, the fruits of its
Lampard, 1955). Therefore, the
urban centres is imperative for regional economic progress (
1971). Urban centres do not grow in isolation, rather in response to
changing situation (Thakur 2002
concentration of population in response to the availability of diverse amenities and facilities in the urban centre. Subsequently, urba population is found distributed among the settlements of varying sizes from smaller towns to giant cities (
functional importance. Small urban centres might have been villages but with time due to the increasing agglomeration e
gradually become urban centres by virtue of their nodality, function and services – local as well as central (
pattern, small and intermediate towns grow slowly as compared to large cities in early phase of urbani
towns grow as the consequence of congestion and crowding in large and intermediate towns. Therefore, growth of towns follows the cycle of urbanization from the phases of smaller town, intermediate town
and primate city (Geyer and Kontuly 1993
It is worthy to mention that continuous increase of urban size cannot be sustained. The decline in growth rate will certainly set in with increasing size of urban centres in long run (
However, their natural growth should be allowed in order to reap the benefits of their growth momentum. But the optimality of urban size is elusive and finally finds its own in due course of time (
2005). The optimum level of its growth depends upon the capacity of
the urban centre in providing all required facilities to the people in fair manner. High capacity enhances the level of optimum while huge inflow of migrants than the capacity causes over burden on the civic finances for providing basic amenities. Such a stage o urbanization gives rise to all evils in urban centre, i.e., housing problem, water scarcity, lack of medical facility, unemployment, increasing poverty and suicide, spread of slums and squatters, increase of beggars and pavement dwellers, delinquenc
kidnapping, traffic congestion and overcrowding, atmospheric
Available online at http://www.journalcra.com
International Journal of Current Research
Vol. 5, Issue, 02, pp.360-370, February, 2013
INTERNATIONAL
uence of Urban Centres: An Approach of
Regional Development Perspective from Developing Country (India)
Geography, University of Calcutta, Kolkata, India
associated. Allocation of higher and lower order facilities and specialization of business influence urban growth which diffuses its benefits to the surrounding countryside. economic development of the region comes into being. The continuous increase of urban size cannot be sustained rather declining growth will certainly set in long run. Optimum level of its growth depends on the capacity of an urban centre to provide required facilities to the people in fair manner. Hierarchical growth of urban centres in association with location of civic amenities induces regional development in hierarchical dimension which is the common problem in developing economy. Subsequently, few of the urban centres are thers are lacking corresponding to their population size. Formulation of pragmatic planning model is the rescue of wiping out such problems. It is an attempt to analyze the hierarchical growth of urban centres associated with their functional potentiality and diffusion of urban developmental impulses to the surrounding rural part. Further, it proposes a model for developing economy like India to solve the problem of regional variations of development. Besides, it examines the adequacy and inadequacy of facilities in the urban centres and puts forward planning recommendations, so that a balanced regional development would be achieved by not leaving any rural part out of the zone of functional influence of urban centre.
, Academic Journals. All rights reserved.
urban centres is imperative for regional economic progress (Hoselitz,
centres do not grow in isolation, rather in response to
Thakur 2002). Urban growth is the outcome of concentration of population in response to the availability of diverse amenities and facilities in the urban centre. Subsequently, urban population is found distributed among the settlements of varying
sizes from smaller towns to giant cities (Pascione 2001) as per their
functional importance. Small urban centres might have been villages but with time due to the increasing agglomeration economies they gradually become urban centres by virtue of their nodality, function
local as well as central (Verma 2006). In its evolving
pattern, small and intermediate towns grow slowly as compared to large cities in early phase of urbanization, but in latter phase, small towns grow as the consequence of congestion and crowding in large and intermediate towns. Therefore, growth of towns follows the cycle of urbanization from the phases of smaller town, intermediate town
Kontuly 1993).
It is worthy to mention that continuous increase of urban size cannot be sustained. The decline in growth rate will certainly set in with
increasing size of urban centres in long run (Mills and Becker 1986).
growth should be allowed in order to reap the benefits of their growth momentum. But the optimality of urban size
is elusive and finally finds its own in due course of time (Bhagat
). The optimum level of its growth depends upon the capacity of ban centre in providing all required facilities to the people in fair manner. High capacity enhances the level of optimum while huge inflow of migrants than the capacity causes over burden on the civic finances for providing basic amenities. Such a stage of over-urbanization gives rise to all evils in urban centre, i.e., housing problem, water scarcity, lack of medical facility, unemployment, increasing poverty and suicide, spread of slums and squatters, increase of beggars and pavement dwellers, delinquency, snatching, kidnapping, traffic congestion and overcrowding, atmospheric
pollution and so on. These problems are the outcome of continuum process of urbanization mainly seen in very few big cities of India (Verma 2006, Mandal 2000). Such a situation is the reflection of optimum growth of an urban centre and thereafter declination of its growth begins. The main thrust of this research is to raise some ground realities related to the functional hierarchy of urban centres, their differential influence over surrounding countryside which are the characteristic feature of developing economy with the growth potentialities of these urban centres. Such issues are the traditional and meaningless in developed economy where new economic policies like Export Processing Zone (EPZ), Special Economic Zone (SEZ), Exclusive Economic Zone (EEZ), e-Commerce and Advance Trading are practicing in full swing for the great achievement of urban growth, urban planning, enhancing employment level and consequent regional development. Though, India and other developing countries have adopted such policies but small size urban centres are still suffering from the lack of developmental facilities. Subsequently, their little radius of functional influence could not encompass the larger surrounding area of rural part. Therefore, the only solution to wipe out the regional inequalities of socio-economic development is to grow the small order of urban centres up to their full extreme potentiality so that they may radiate their developmental influence over the surrounding countryside. Such model is still imperative for the regional planning for socio-economic development in the developing economy.
Study Area
The district of North 24 Parganas in West Bengal extends from latitude 22º 11' 06" north to 23º 15' 02" north and from longitude 88º 20' east to 89º 05' east. It is bordered by Nadia in the north, Bangladesh (Khulna Division) in north and east, South 24 Parganas and Kolkata to the south and Kolkata, Howrah and Hooghly to the west. Barasat is the district headquarters of North 24 Parganas district. North 24 Parganas is the most populous district in West Bengal. It is also the tenth-largest district in the State by area and second-most populated district in the country, after Thane district of Maharashtra (Census of India, 2011).
Figure 1 here
Objectives
Following basic objectives have been taken to pursue the present research work:
To analyze the spatial distribution of socio-economic facilities to
find the functionality of the urban centres,
To delineate the zone of influence of urban centres and
To make suggestive remarks for the proper growth and
development of urban centres.
Methodological Issues
To accomplish the above objectives as well as to ascertain the laws through testing above hypotheses, secondary information has been collected from different sources published by government. The data have been analyzed using different advanced statistical techniques to deduce and generalize the facts. To work out the ranking of towns on the basis of functional importance, it is necessary to assign a certain weight to all the facilities under study.
Functionality of Urban Centre
Demarcation of Influence zone of Urban Centre is the consequence of locational network, distributional pattern of population, status of infrastructure, facilities and accessibility to the centre. These factors lead to interaction of people who prefer a particular service centre, because proximity based on least travel time, cost and efforts. Eventually, functionality has been calculated for the Urban Centres of North 24 Parganas district. The weightage for selected functions has
been determined by applying Bhat’s (1976) formula:
Wi = N / Fi
Where, Wi = Weightage to the ith Function, N= Total number of
Urban Centres of the District under study and Fi = Total number of
Urban Centres having ith Function. After applying the weightage
score values per unit to all the functions, Functionality of each Urban Centres have been calculated by using following expression:
FW1 + FW2 + FW3 +… Fn
Functionality of Urban Centre = --- X 100 ∑ W
Where, FW= Weightage of Function, ∑W = Summation of weightage score of all the Urban Centres of the district of North 24 Parganas.
Sphere of Influence of Urban Centre
An attempt has been made to delimit the sphere of influence of all considered Urban Centres in study region to examine their functional relationship with region. The sphere of influence constitutes economic and social zone of control. A brief review of various methods used in calculating the zone of influence indicates that use of empirical methods need intensity field work and it consumes more time and labor. The zone of influence of each urban centre has been delineated using modified quantitative technique devised by V.L.S. Prakash Rao (Lokhande and Pawar 2004) which is as follows:
R = TFA/C and S.I. = √TFA/C
where, R = Radius of circle indicating the sphere of influence (km.), S.I. = Sphere of Influence of urban centre (sq. km.), TF = Total Functionality score of urban centre, A = Total area (sq. km) of the study district and C = Total Functionality score of all urban centre.
Relative Level of Urban Functional Ratio
To examine the adequacy or inadequacy of socio-economic functions in relation to the existing population, following method of Relative Level of Urban Functional Ratio has been adopted applying the
formula of Julfikaret al. (2012):
Ps Ft
Rij = (–––– X ––––) X 1000 Pt Fs
Where, Rij = relative level of urban function between an urban centre of the study area, Ps = urban population of study area, Pt = population of the urban centre, Ft = functionality of the urban centre, Fs = total urban functionality of the study urban centres. The ratio of function in a urban centre more than 01 refers to the adequacy, while ratio less than 01 refers to the inadequacy of function in the town.
RESULTS AND DISCUSSION
Level of Functionality of Urban Centres
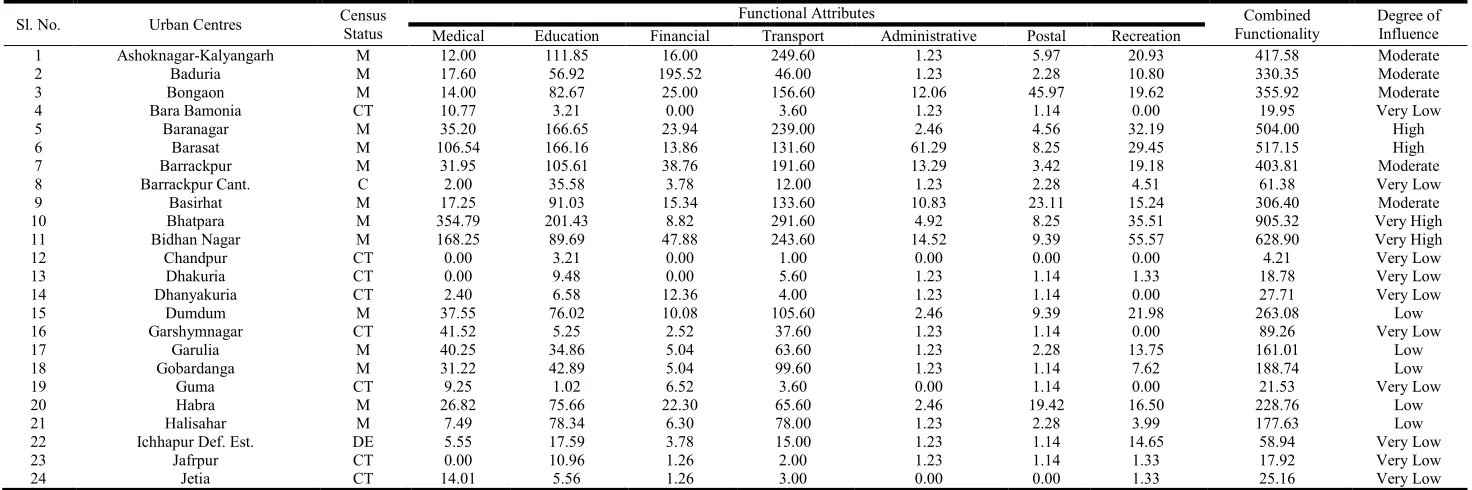
The analysis of spatio-temporal dynamism of phenomena is the main thrust of geographical research. Likewise diverse physical, cultural, social and economic aspects, the distribution of population and facilities is not uniform across the region. But over the earth’s surface, the nature of distribution of both population and facilities happens together, as both are interdependent to each other. People requires different facilities to sustain their socio-economic life as well as to fulfill needs and desires, while proper functioning of facilities depends on the size and purchasing power of patrons. Therefore, higher important facilities which are fewer in number available only in bigger size urban centres, while lower important facilities are available in both bigger as well as smaller size urban centres. Functional magnitude is the reliable indicator of functionality and on which the zone of influence has determined. Therefore considering the urban economy and urban character of the forty eight urban centres, 23 functions like - education, health, transport, communication, administrative functions, credit/finance societies
existing at service centres, have been taken into account. Some available higher order functions were also selected for the purpose of ranking of urban centres. Eventually, a combined functionality index (Table 1) has been determined by applying Bhat’s formula. After computation of combined functionality index, 48 urban centres have been classified into five categories i.e. very high (above 600.00), high (451.00-600.00), moderate (301.00-450.00), low (150.00-300.00) and very low (below 150.00) level of functionality.
On the other hand by applying Rao’s (2006) formula zone of
influence of urban centres have also been derived.
From the Table 2, functionality scores of urban centres have been found which give an idea about the pull factors and the concentration of the urban population. All the forty eight urban centres are grouped into five categories. Very high functionality urban centres having combined functionality value of above 600.0. Bhatpara, South DumDum, Panihati and Bidhan Nagar are the urban centres fallen under category. High functionality urban centres having the value of 450.0 to 600.0 and Barasat, Baranagar, Kamarhati and Naihati are the urban centres (Table 2) under this category. Ashoknagar-Kalyangarh, Barrackpur, Khardaha, Baduria, North DumDum, Bongaon, Madhyamgram, Basirhat these 8 urban centres falling under moderate functionality category having value of 301.0 to 450.0. Eleven urban centres i.e. Taki, North Barrackpur, DumDum, Garulia, Rajarhat-Gopalpur, Habra, Kanchrapara, Titagarh, New Barrackpur, Gobardanga and Halisahar are having functionality value within 150.0 – 300.0 falling under low category. All the census town are falling under very low category (below 150.0 functionality value)
which are Kaugachhi, Garshymnagar, Nebadhai-Duttapukur,
Barrackpur Cantonment, Ichhapur Defense Estate, Jetia, Sonatikiri , Raigachhi, Maslandapur, Dhanyakuria, Nokpul, Guma, Patulia, Sadpur, Dhakuria, Jafarpur, Ruiya, Muragachha, Talbandha, Chandpur, Bara Bamonia.
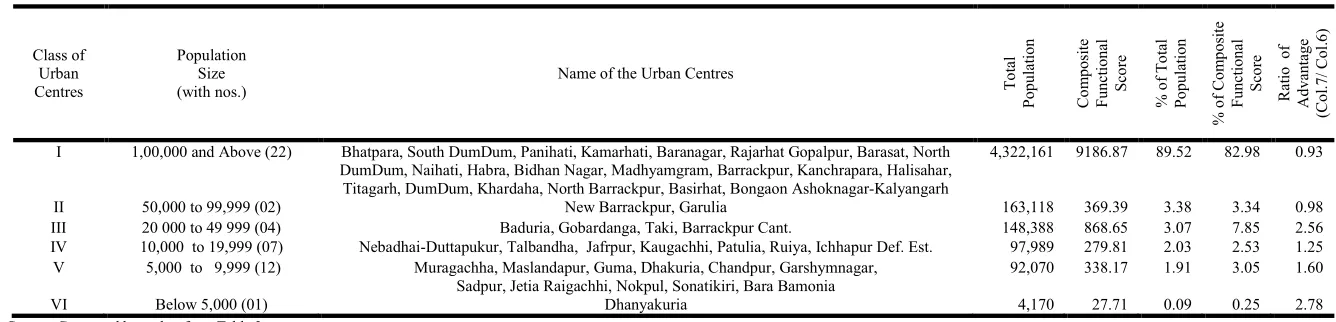
Table 3 reveals the distribution of 48 urban centres or towns in six categories (city-size according to Census of India) according to their population size. Table 6.3 also indicates the total urban population and composite score of functionality (total importance of all facilities in an urban centre in each size category. Bhatpara is the biggest town in North 24 Parganas district with its total 442385 persons in 2001 (9.16 per cent of total urban population in the district) and Composite Functional Score (CFS) of 905.32 (3.77 per cent of total urban functional importance), comes under the category of Class I towns in India. However, total 22 urban centres of class I category having the highest concentration of urban population i.e. 4322161 (89.52 per
cent) having Composite Functional Score (CFS) of 9186.87 (82.98 per cent of total urban functional importance). Other urban centres in
the class I category are South DumDum, Panihati, Kamarhati, Baranagar, Rajarhat Gopalpur, Barasat, North DumDum, Naihati, Habra, Bidhan Nagar, Madhyamgram, Barrackpur, Kanchrapara, Halisahar, Titagarh, DumDum, Khardaha, North Barrackpur, Basirhat, Ashoknagar-Kalyangarh, Bongaon. New Barrackpur (83192) and Garulia (79926) are the only urban centres found in Class II town in the district having 3.38 per cent urban population and 3.34 per cent (CFS 369.39) urban functional importance.
Figure 2 here
In the district, Class III urban centres (i.e., Baduria, Gobardanga, Taki and Barrackpur Cant.), Class IV urban centres (i.e., Nebadhai-Duttapukur, Talbandha, Jafrpur, Kaugachhi, Patulia, Ruiya, Ichhapur Def. Est.) Class V urban centres (i.e., Muragachha, Maslandapur, Guma, Dhakuria, Chandpur, Garshymnagar, Sadpur, Jetia, Raigachhi, Nokpul, Sonatikiri and Bara Bamonia) and Class VI (Dhanyakuria) urban centres accommodate 3.07 per cent, 2.03 per cent, 1.91 per cent and 0.09 per cent of total urban population of the district respectively, but they scored 7.85 per cent, 2.53 per cent, 3.05 per and 0.25 per cent of urban functional importance respectively Table 3.
Table 3 further reveals the relative ratio of advantage of population and functional importance. Such an analysis is significant to estimate the probability of extension of an urban centre in future. People flows
towards the centre where there are ample opportunities of education, employment, medical, etc. as socio-economic pull factors. Therefore, an urban centre having more functions but lesser population has more prospect of further growth. In this view, it may be argued that an urban centre with ratio of advantage more than 01 or unity is supposed to have more functional importance in proportion to its existing population size, subsequently has an advantage of further expansion by attracting and accommodating more people. In contrary, urban centres with ratio less than 01 have lesser probability to be expanded. In the study area, Class I and Class II urban centres has scored the ratio of 0.93 (i.e., <1) and town 0.98 followed by Class III urban centres (2.56), Class IV urban centres (1.25), Class V urban centres (1.60) and Class VI urban centre (2.78) (Table 3). It may be inferred that Class I and Class II urban centres has lesser probability of its further growth than the smaller size towns in the district. However, Baduria, Gobardanga, Taki and Barrackpur Cantonment have better prospect of its further growth in terms of both population and area consequent upon in-migration of people from surrounding rural part.
Again, irregular distribution of population and facilities among the size class of town has been analyzed based on the Gini’s Coefficient of Concentration Method. The ratio of concentration of population in different size class of towns has been examined, where Gini’s ratio of 0.63 ascertains that large number of urban population is disproportionately concentrated at few number of bigger size urban centres in the district, while large number of smaller size towns accommodates proportionally fewer population. However, Gini’s value of 0.63 reveals that likewise population, functions are also disproportionately concentrated in fewer bigger size towns while large number of smaller size towns is lacking of it. It is clear that the Gini’s value of 0.63 determines unequal distribution of functions in relation to the proportional distribution of population among size group of urban centres. In other words, both population and facilities are not concentrated in uniform proportion in different size of urban centres. It may be inferred that, higher concentration of functions in an urban centre leads to higher concentration of population. Therefore, the growth of urban centres in terms of availability of socio-economic functions is subjected to the increase of population in that urban centre as both are complementary to each other. It is emerged out from the above analysis that a town having higher availability of socio-economic facilities must have an excellent potentiality of inward pulling of people as well as the prospect of its further growth. Functional importance is the sum of all the pulling factors available in an urban centre.
Therefore, higher functional importance having variety of both higher and lower order functions exerts a greater pulling effect that attracts people towards an urban centre. Thus, a smaller urban centre turns into a bigger urban centre progressively. Functional importance is the qualitative identity of an urban centre, as it refers to the pulling gravity of later. Since the functional importance varies across urban centre, their size of population and area also vary positively. Therefore, within a defined region, hierarchy of urban centres is emerged out in which towns are differing from each other in terms of their pulling gravity. Different terms used for the city indicate some
hierarchical and functional variations among them (Thakur, 1994).
From this philosophical essence, it may be argued that a town having higher advantage of pulling factor has an equal advantage of more people to be in-migrated as well as accommodated in future. While in contrary, a town having lesser advantage of pulling factor has lesser possibility of being attracted by people to be in-migrated and accommodated there. Basically it has been found from the analysis that, all the urban centres having municipality status are falling under very high to low category of functionality score. It is clear from the Table 2 that, except Basirhat, Baduria and Bongaon, all the urban centres are from western part of district of North 24 Parganas. Nearly 70 per cent (Table 4) of urban population concentrated in these urban centres. Due to availability of different functions in the western part and location of Kolkata pull them to concentrate in this part.
Although along the Hoogly River several industries are found which
also create chain migration (Pramanik 2005) from the rural eastern
part of the district. All the census towns (20 in number) are found very low level of functionality in this district in which only 4.48 per cent of population concentrate. These are the small urban centres basically developed within the municipality boundary or beside the transport line (National Highway / State Highway or railway). These urban centres are basically used by the commuters.
Zone of Influence of Urban Centres
Each urban centre forms the centre of a larger area and dominates
over certain area which is actually its sphere of influence (Murphy
1974). Urban centres do not function in isolation; rather they
provide goods and services to the area lying beyond the urban boundary. People from the surrounding area commute an urban centre to avail the required facilities. But, people visit urban centres from a certain distance. The distance, which patrons willing to travel, depends on the importance of facility so that it should be the
economy of the distance (Pawar and Lokhande 2001, Yasenovskiy
and Hodgson 2007). Therefore, both importance of facility and
the distance traveled by the patrons are positively related. Again, an urban centre having large number and higher order of facilities is being visited by patrons from longer distance. In other words, an urban centre with higher functional importance exerts an influence
upon larger area of its surrounding (Lokhande and Pawar 2004).
Such, an area surrounding the urban centre reveals the complexity of interaction and interdependence between town and surrounding
rural area that is popularly known as functional region (Glasson
1978). It may be inferred that a town having higher functional
importance covers larger zone of influence and vice-versa.
Physical configuration of the urban centre’s peripheral region, geographical location with respect to the transportation lines,
availability of socio-cultural-cum-economic functions and
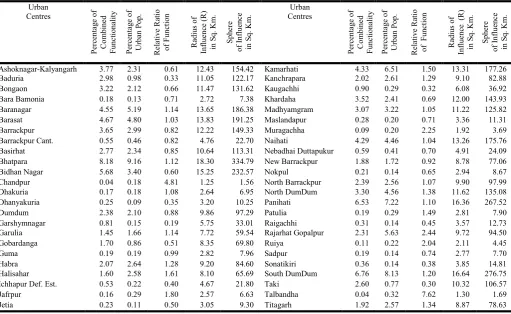
infrastructure determine the exclusive influence zones of an urban centre. As a planning unit, this zone exerts a dominant role in determining development plans for the future. On the basis of various functional attributes, the sphere of influence zones (Kukadapwar and Adene, 2006) of the urban centres has been worked out. Sphere of influence of all considered urban centres in study region is to examine their functional relationship with region. In the analysis by adopting V.L.S. Prakash Rao’s modified method, the zone of influence of each urban centre has been delineated. Table 5 exhibits that Bhatpara exerts its influence up to 18. 30 km and covers the area of 339.79 sq. km. It is followed by South DumDum with its
radius of influence 16.64 km. and sphere of influence 276.75 sq. km., Panihati with its radius 16.36 km. and sphere of
influence 267.52 sq. km. However, Chandpur has been identified at bottom position in its functional influence with radius of 1.25 km. and sphere of influence of 1.56 sq. Km (Table 5).
Figure 3 depicts the circular form of sphere of influence of urban. Urban centres with higher functionality importance encompass larger dependent area within which dependent area of lower order centres come under. Bhatpara being a largest order urban centre in the district radiates its influence up to the highest distance from the centre with radius of influence 18.30 km. Its influence reaches even outside the district boundary, i.e., northern, southern, western, southern part and encompasses almost all the lower order urban centres including their dependent area (Fig. 3). It supports the philosophy that all lower order centres by providing lower order functions create rather smaller sphere of influence, but the inhabitants from such a sphere commute higher order centres to avail further higher order functions. Bhatpara is followed by South DumDum, Panihati, Bidhan Nagar, Barasat, Baranagar, Kamarhati and Naihati urban centres with radius of influence 16.64 km., 16.36 km., 15.25 km., 13.83 km., 13.65 km., 13.31 km. and 13.26 km. respectively. There is an overlapping of spheres of influence of Ashoknagar-Kalyangarh, Habra, Bongaon, Basirhat, Baduria and Taki in eastern and north-eastern part of the district. It may be argued that this part of the district is not sufficiently served by the closely located urban centres led to higher
socio-economic development. Moreover, this part does not get benefits of nearness of Kolkata urban agglomeration-the biggest
urban as well as service centre of the state.Chandpur – lowest order
centre with radius of influence 1.25 km. comes under the zone of influence of Bhatpara, Madhyamgram and Barasat which also comes under the zone made by though all these are under high to moderate functionality urban centres (Fig. 3). The same figure further depicts that the extreme south-eastern part of the district do not comes under the sphere of influence of any urban centre. Such information is crucial for urban planning purpose in order to attain socio-economic change in these areas.
Relative Level of Urban Functional Ratio
In the analysis of functional gap or functional level, the resultant relative ratio of 1.0 is meant for the balancing level of population in accordance to the existing facilities, however above or below of it refers to the urban centre is served adequately or inadequately respectively. Such an analysis has two objectives, i.e., first, to recommend for the additional facilities in inadequately served urban centres to reach at the standard level of population–function ratio (ratio of 1), and second, to identify the existing functional potentiality of urban centre to attract more migrants as well as possibility of its further growth. It is clear from the Table 6.6 that, among the inadequately served urban centres with relative ratio less than 1, i.e., Madhyamgram (0.98), Ashoknagar-Kalyangarh (0.87) and Khardaha (0.85) where as Chandpur has recorded least ratio of population and function (0.0007). It reveals that the existing amenities and facilities are not sufficient for the present population size leading to larger stress of overburden of population on civic amenities and facilities. Chandpur is followed by Talbandha, where also existing facilities does not correspond to the population size. Therefore, allocation of facilities must be made to raise its ratio at standard level of 1 from 0.0013 which may widen its sphere of influence. Subsequently, socio-economic development of larger surrounding area would be achieved as a consequence.
The analysis of relative ratio of functional level in Table 6 further reveals that, Bhatpara (7.49), South DumDum (5.49), Panihati (4.71), Kamarhati (2.82), Baranagar (2.36), Barasat (2.24), Bidhan Nagar (1.93), Naihati (1.91), North DumDum (1.50), Rajarhat-Gopalpur (1.29) and Barrackpur (1.09) urban centres are well above the standard ratio of 1, therefore only few facilities may be provided there. These urban centres are much older (except Rajarhat-Gopalpur and Bidhan Nagar) and aligned very near to Kolkata urban agglomeration with higher regional connectivity have potentiality of their growth by attracting people from surrounding area. Such an analysis of functional level of each facility of all the urban centres is more pragmatic as well as more specific for planning purposes, though not covered under the present study. Keeping in view the goal of urban as well as regional socio-economic development in order to achieve some sort of human well-being, planning recommendations have to taken by the stakeholders of the society. Urban growth should be concrete in nature and should be accompanied by economic development of an area.
The number of residents in an urban centre and facilities available for them must maintain equilibrium. On the other hand distribution of facilities should be in such a manner that their location may ensure easy accessibility in and around the areas of urbanization. To maintain the standard level of living, different types of higher as well as lower order facilities should be allocated in lower functionality centres with least sphere of influence. In order to reap the regional socio-economic development, allocation of facilities is rather much imperative to enlarge its radius of influence. To encompass the eastern and south-eastern part of the district under the zone of urban functional influence, more facilities especially of higher order should be allocated in Hasnabad, Taki, Baduria urban centres. Consequently, the functional importance of these towns will sufficiently be increased and patrons from surrounding parts can easily avail developmental facilities. Such an approach may enable
Table 1: Weightage Pattern of Each Function / Attribute and Sub-function for Centrality of Urban Centres, District North 24 Parganas
EDUCATIONAL POSTAL
Primary School 1.02 Post Office 1.00
Middle School 1.07 Telegraph Office 24.00
Secondary School 1.12 Post and Telegraph Office 16.00
Higher Secondary School 1.33 Telephone Exchange 3.69
College 2.29 RECREATION
Polytechnic 16.00 Stadium 5.33
University 48.00 Cinema 1.78
Other 9.60 Auditorium 1.85
MEDICAL Public Library 1.33
Hospital 2.00 ADMINISTRATIVE
Family Planning 24.00 District Headquarters 48.00
Health Centre 2.40 Sub divisional Headquarters 9.60
Dispensary 1.85 Police Stations 1.30
Nursing Home 2.00 LITERACY (in Per Cent)
Other 2.82 Connect with NH/SH/ Imp. Road 1.30
FINANCIAL INSTITUTIONS Connect with Rail 1.60
Bank 1.26
Agricultural Credit Societies 4.00
Non-agricultural Credit Societies 4.36
Source: by Author.
Table 2: Combined Functionality of Urban Centres, District North 24 Parganas
Sl. No. Urban Centres Census
Status
Functional Attributes Combined
Functionality
Degree of Influence Medical Education Financial Transport Administrative Postal Recreation
1 Ashoknagar-Kalyangarh M 12.00 111.85 16.00 249.60 1.23 5.97 20.93 417.58 Moderate
2 Baduria M 17.60 56.92 195.52 46.00 1.23 2.28 10.80 330.35 Moderate
3 Bongaon M 14.00 82.67 25.00 156.60 12.06 45.97 19.62 355.92 Moderate
4 Bara Bamonia CT 10.77 3.21 0.00 3.60 1.23 1.14 0.00 19.95 Very Low
5 Baranagar M 35.20 166.65 23.94 239.00 2.46 4.56 32.19 504.00 High
6 Barasat M 106.54 166.16 13.86 131.60 61.29 8.25 29.45 517.15 High
7 Barrackpur M 31.95 105.61 38.76 191.60 13.29 3.42 19.18 403.81 Moderate
8 Barrackpur Cant. C 2.00 35.58 3.78 12.00 1.23 2.28 4.51 61.38 Very Low
9 Basirhat M 17.25 91.03 15.34 133.60 10.83 23.11 15.24 306.40 Moderate
10 Bhatpara M 354.79 201.43 8.82 291.60 4.92 8.25 35.51 905.32 Very High
11 Bidhan Nagar M 168.25 89.69 47.88 243.60 14.52 9.39 55.57 628.90 Very High
12 Chandpur CT 0.00 3.21 0.00 1.00 0.00 0.00 0.00 4.21 Very Low
13 Dhakuria CT 0.00 9.48 0.00 5.60 1.23 1.14 1.33 18.78 Very Low
14 Dhanyakuria CT 2.40 6.58 12.36 4.00 1.23 1.14 0.00 27.71 Very Low
15 Dumdum M 37.55 76.02 10.08 105.60 2.46 9.39 21.98 263.08 Low
16 Garshymnagar CT 41.52 5.25 2.52 37.60 1.23 1.14 0.00 89.26 Very Low
17 Garulia M 40.25 34.86 5.04 63.60 1.23 2.28 13.75 161.01 Low
18 Gobardanga M 31.22 42.89 5.04 99.60 1.23 1.14 7.62 188.74 Low
19 Guma CT 9.25 1.02 6.52 3.60 0.00 1.14 0.00 21.53 Very Low
20 Habra M 26.82 75.66 22.30 65.60 2.46 19.42 16.50 228.76 Low
21 Halisahar M 7.49 78.34 6.30 78.00 1.23 2.28 3.99 177.63 Low
22 Ichhapur Def. Est. DE 5.55 17.59 3.78 15.00 1.23 1.14 14.65 58.94 Very Low
23 Jafrpur CT 0.00 10.96 1.26 2.00 1.23 1.14 1.33 17.92 Very Low
24 Jetia CT 14.01 5.56 1.26 3.00 0.00 0.00 1.33 25.16 Very Low
[image:5.842.53.789.301.546.2]25 Kamarhati M 32.00 181.13 29.46 196.60 1.23 9.39 29.51 479.32 High
26 Kanchrapara M 15.85 81.69 5.04 99.60 1.23 2.28 18.43 224.12 Low
27 Kaugachhi CT 44.16 6.27 1.26 47.00 0.00 1.14 0.00 99.83 Very Low
28 Khardaha M 33.20 118.68 17.54 200.60 3.69 3.42 12.06 389.19 Moderate
29 Madhyamgram M 94.50 47.16 23.16 151.60 1.23 3.42 19.17 340.24 Moderate
30 Maslandapur CT 9.22 4.13 5.26 9.60 1.23 1.14 0.00 30.58 Very Low
31 Muragachha CT 2.40 3.21 0.00 2.00 1.23 1.14 0.00 9.98 Very Low
32 Naihati M 97.77 118.72 13.86 181.60 2.46 7.11 53.74 475.26 High
33 Nebadhai Duttapukur CT 24.40 19.74 1.26 11.60 1.23 1.14 5.77 65.14 Very Low
34 New Barrackpur M 20.50 67.48 3.78 101.60 2.46 2.28 10.28 208.38 Low
35 Nokpul CT 0.00 6.27 5.26 6.60 0.00 0.00 5.32 23.45 Very Low
36 North Barrackpur M 31.35 98.36 9.04 103.60 1.23 7.11 14.29 264.98 Low
37 North DumDum M 51.73 103.12 6.30 185.60 3.69 4.56 10.28 365.28 Moderate
38 Panihati M 70.98 200.16 118.50 201.60 3.69 9.39 119.08 723.40 Very High
39 Patulia CT 0.00 8.77 1.26 10.00 0.00 0.00 1.33 21.36 Very Low
40 Raigachhi CT 20.11 6.17 0.00 7.00 0.00 1.14 0.00 34.42 Very Low
41 Rajarhat Gopalpur M 93.25 42.46 13.86 50.00 2.46 28.56 24.94 255.53 Low
42 Ruiya CT 0.00 2.04 0.00 10.00 0.00 0.00 0.00 12.04 Very Low
43 Sadpur CT 2.40 6.58 4.00 6.60 1.23 0.00 0.00 20.81 Very Low
44 Sonatikiri CT 0.00 13.16 16.36 7.60 0.00 1.14 1.78 40.04 Very Low
45 South DumDum M 46.82 230.91 90.60 185.00 4.92 8.25 181.87 748.37 Very High
46 Taki M 44.85 34.98 100.24 73.00 1.23 2.28 31.60 288.18 Low
47 Talbandha CT 0.00 1.02 0.00 1.00 1.23 0.00 1.33 4.58 Very Low
48 Titagarh M 12.82 65.22 5.04 91.60 1.23 8.25 28.47 212.63 Low
Source: Computed by author from Census of India, West Bengal Series, District North 24 Parganas, 2001.
[image:6.842.82.750.340.501.2]N.B. M – Municipality, CT – Census Town, DE – Defense Estate and C – Cantonment Board.
Table 3:Distribution of Population and Facilities among Classes of Urban Centres, North 24 Parganas District
Class of Urban Centres
Population Size (with nos.)
Name of the Urban Centres
To
tal
Populat
ion
Co
m
posi
te
Funct
ional
Sco
re
% o
f T
o
tal
Populat
ion
% o
f Com
p
os
ite
Funct
ional
Sco
re
Ra
ti
o
of
Advan
tage
(Co
l.7/
Col.
6
)
I 1,00,000 and Above (22) Bhatpara, South DumDum, Panihati, Kamarhati, Baranagar, Rajarhat Gopalpur, Barasat, North DumDum, Naihati, Habra, Bidhan Nagar, Madhyamgram, Barrackpur, Kanchrapara, Halisahar, Titagarh, DumDum, Khardaha, North Barrackpur, Basirhat, Bongaon Ashoknagar-Kalyangarh
4,322,161 9186.87 89.52 82.98 0.93
II 50,000 to 99,999 (02) New Barrackpur, Garulia 163,118 369.39 3.38 3.34 0.98
III 20 000 to 49 999 (04) Baduria, Gobardanga, Taki, Barrackpur Cant. 148,388 868.65 3.07 7.85 2.56
IV 10,000 to 19,999 (07) Nebadhai-Duttapukur, Talbandha, Jafrpur, Kaugachhi, Patulia, Ruiya, Ichhapur Def. Est. 97,989 279.81 2.03 2.53 1.25 V 5,000 to 9,999 (12) Muragachha, Maslandapur, Guma, Dhakuria, Chandpur, Garshymnagar,
Sadpur, Jetia Raigachhi, Nokpul, Sonatikiri, Bara Bamonia
92,070 338.17 1.91 3.05 1.60
VI Below 5,000 (01) Dhanyakuria 4,170 27.71 0.09 0.25 2.78
Source: Computed by author from Table 2.
Table 4: Level of Functionality among Urban Centres, North 24 Parganas District Combined Functionality Value Nature of Functionality
Name of the Urban Centres
No. of the Urban Centres with Percentage
Concentration of Urban Population
(in %)
Above 600.0 Very High Bhatpara, Panihati,
South DumDum, Bidhan Nagar
4 (8.33 %) 27.91
451.0 – 600.0 High Barasat, Baranagar, Kamarhati, Naihati 4 (8.33 %) 20.96
301.0 – 450.0 Moderate Ashoknagar-Kalyangarh, Barrackpur,
Khardaha, Baduria, North DumDum, Bongaon, Madhyamgram, Basirhat
8 (16.67 %) 20.93
150.0 – 300.0
Low
Taki, North Barrackpur, DumDum, Garulia, Rajarhat-Gopalpur, Habra, Kanchrapara, Titagarh, New Barrackpur,
Gobardanga, Halisahar
11 (22.92 %) 25.71
Below 150.0 Very Low Kaugachhi, Garshymnagar, Ruiya, Muragachha, Nebadhai-Duttapukur, Barrackpur Cantonment, Raigachhi, Ichhapur Def. Est., Jetia, Sonatikiri ,
Maslandapur, Dhanyakuria, Nokpul, Guma, Patulia, Sadpur, Dhakuria, Jafarpur, Talbandha, Chandpur, Bara Bamonia,
21 (43.75 %) 4.48
[image:7.595.44.556.284.598.2]Source: Table 2.
Table 5: Percentage of Combined Functionality, Population, Relative Ratio of Functions and Sphere of Influence (sq. km.) of Urban Centres, North 24 Parganas District
Urban Centres Perce n tag e of Co m b ined Funct ionali ty Perce n tag e of Ur b an Po p. Re lativ e Ra tio of Func tio n Radi us of Influence (R) in S q. Km . Sphere of In fluence in S q. Km
. Centres Urban
Perce n tag e of Co m b ined Funct ionali ty Perce n tag e of Ur b an Po p. Re lativ e Ra tio o
f F
u n ctio n Radi us of Influence (R ) in S q. Km . Sphere of In fluence in S q. Km .
Ashoknagar-Kalyangarh 3.77 2.31 0.61 12.43 154.42 Kamarhati 4.33 6.51 1.50 13.31 177.26
Baduria 2.98 0.98 0.33 11.05 122.17 Kanchrapara 2.02 2.61 1.29 9.10 82.88
Bongaon 3.22 2.12 0.66 11.47 131.62 Kaugachhi 0.90 0.29 0.32 6.08 36.92
Bara Bamonia 0.18 0.13 0.71 2.72 7.38 Khardaha 3.52 2.41 0.69 12.00 143.93
Baranagar 4.55 5.19 1.14 13.65 186.38 Madhyamgram 3.07 3.22 1.05 11.22 125.82
Barasat 4.67 4.80 1.03 13.83 191.25 Maslandapur 0.28 0.20 0.71 3.36 11.31
Barrackpur 3.65 2.99 0.82 12.22 149.33 Muragachha 0.09 0.20 2.25 1.92 3.69
Barrackpur Cant. 0.55 0.46 0.82 4.76 22.70 Naihati 4.29 4.46 1.04 13.26 175.76
Basirhat 2.77 2.34 0.85 10.64 113.31 Nebadhai Duttapukur 0.59 0.41 0.70 4.91 24.09
Bhatpara 8.18 9.16 1.12 18.30 334.79 New Barrackpur 1.88 1.72 0.92 8.78 77.06
Bidhan Nagar 5.68 3.40 0.60 15.25 232.57 Nokpul 0.21 0.14 0.65 2.94 8.67
Chandpur 0.04 0.18 4.81 1.25 1.56 North Barrackpur 2.39 2.56 1.07 9.90 97.99
Dhakuria 0.17 0.18 1.08 2.64 6.95 North DumDum 3.30 4.56 1.38 11.62 135.08
Dhanyakuria 0.25 0.09 0.35 3.20 10.25 Panihati 6.53 7.22 1.10 16.36 267.52
Dumdum 2.38 2.10 0.88 9.86 97.29 Patulia 0.19 0.29 1.49 2.81 7.90
Garshymnagar 0.81 0.15 0.19 5.75 33.01 Raigachhi 0.31 0.14 0.45 3.57 12.73
Garulia 1.45 1.66 1.14 7.72 59.54 Rajarhat Gopalpur 2.31 5.63 2.44 9.72 94.50
Gobardanga 1.70 0.86 0.51 8.35 69.80 Ruiya 0.11 0.22 2.04 2.11 4.45
Guma 0.19 0.19 0.99 2.82 7.96 Sadpur 0.19 0.14 0.74 2.77 7.70
Habra 2.07 2.64 1.28 9.20 84.60 Sonatikiri 0.36 0.14 0.38 3.85 14.81
Halisahar 1.60 2.58 1.61 8.10 65.69 South DumDum 6.76 8.13 1.20 16.64 276.75
Ichhapur Def. Est. 0.53 0.22 0.40 4.67 21.80 Taki 2.60 0.77 0.30 10.32 106.57
Jafrpur 0.16 0.29 1.80 2.57 6.63 Talbandha 0.04 0.32 7.62 1.30 1.69
Jetia 0.23 0.11 0.50 3.05 9.30 Titagarh 1.92 2.57 1.34 8.87 78.63
Source: Calculation is based on data obtained from District Census Abstract, North 24 Parganas District, 2001 and Table 2
.
Table 6: Relative Level of Functional Ratio of Urban Centres, North 24 Parganas District
Ur b an Centres Re lative Level o f Funct ionali ty Ur b an Centres Re lative Level o f Funct ionali ty Ur b an Centres Re lative Level o f Funct ionali ty Ur b an Centres Re lative Level o f Funct ionali ty
Bhatpara 7.4933 Ashoknagar-alyangarh 0.8720 Garulia 0.2408 Raigachhi 0.0043
South DumDum 5.4950 Khardaha 0.8481 Taki 0.2011 Guma 0.0037
Panihati 4.7160 Bongaon 0.6803 Gobardanga 0.1470 Dhakuria 0.0031
Kamarhati 2.8205 Basirhat 0.6487 Kaugachhi 0.0260 Nokpul 0.0029
Baranagar 2.3647 North Barrackpur 0.6131 Barrackpur Cant. 0.0253 Sadpur 0.0026
Barasat 2.2402 Habra 0.5461 Duttapukur 0.0242 Jetia 0.0026
Bidhan Nagar 1.9323 Kanchrapara 0.5292 Garshymnagar 0.0123 Ruiya 0.0024
Naihati 1.9145 Dumdum 0.4986 Ichhapur Def. Est. 0.0115 Bara Bamonia 0.0023
North DumDum 1.5038 Titagarh 0.4942 Patulia 0.0055 Dhanyakuria 0.0022
Rajarhat Gopalpur 1.2995 Halisahar 0.4138 Maslandapur 0.0054 Muragachha 0.0018
Barrackpur 1.0909 New Barrackpur 0.3243 Sonatikiri 0.0050 Talbandha 0.0013
Madhyamgram 0.9896 Baduria 0.2931 Jafrpur 0.0047 Chandpur 0.0007
Source: Computed based on Table 5.
[image:7.595.40.537.631.804.2]towns to achieve balanced regional development as a consequence of urban growth. Another significant planning approach should be made to connect all the urban centres by efficient transportation facility and finally, they should be connected with Kolkata (State Capital) and Barasat (District Capital) urban centre in the study area. Besides, a comprehensive planning policy should be taken to promote urban growth to such an extent that the functional importance of each centres of all hierarchical order may radiate into all corner of rural. Therefore, a significant influence can change their living standard and quality of life in the district.
Keeping in view the goal of urban as well as regional socio-economic development in order to achieve some sort of human well-being, planning recommendations have been made as follows:
Urban growth should be concrete in nature and should be
accompanied by economic development of an area. The number of residents in an urban centre and facilities available for them must maintain equilibrium.
The distribution of facilities should be in such a manner that
their location may ensure easy accessibility in and around the areas of urbanization.
To maintain the standard level of living, different types of
higher as well as lower order facilities should be allocated in lower functionality urban centres with least sphere of influence. In order to reap the regional socio-economic development, allocation of facilities is rather much imperative to enlarge its radius of influence.
To encompass the eastern part with western part of the district
under the zone of urban functional influence (Fig. 3), more facilities especially of higher order should be allocated in Taki, Basirhat, Bongaon and Baduria urban centres. Consequently, the functional importance of these towns will sufficiently be increased and patrons from surrounding parts can easily avail developmental facilities. Such an approach may enable towns to achieve balanced regional development as a consequence of urban growth.
Another significant planning approach should be made to
connect all the urban centres by efficient transportation facility and finally, they should be connected with Kolkata city- the biggest order urban centre in the State. Besides, a comprehensive planning policy should be taken to promote urban growth to such an extent that the functional importance of each centres of all hierarchical order may radiate into all corner of rural. Therefore, a significant influence can change their living standard and quality of life in the district.
Figure 4 here
Conclusion
Going through the above quantitative analysis, it is evident that the urban centres grow in hierarchical manner which are of different sizes. The distribution of both population and facilities are complementary to each other and they are highly concentrated in bigger size urban centres. Centres having large number of facilities as well as higher functional importance induce pulling effect and become a centre with greater chance of further growth by attracting and accommodating more people from surrounding area. Quantitatively, it is proved that urban centres grow (in terms of area and population) as a consequence of the availability of facilities of varying importance. Since an urban centre grows, it is evident, its sphere of influence also increases progressively which leads to regional socio-economic development. Therefore, in order to accomplish the dual objectives of making an urban centre more beautiful as well as convenient for living, and not to leave any rural part out of the urban functional influence as well as to achieve balanced regional socio-economic development in the study area, aforementioned planning recommendations should be adopted and implemented. In addition, detailed field study at household level in
each urban centre should be conducted to evaluate the existing level of living and quality of life of inhabitants, transportation and communication facility, level of pollution, drainage pattern and other civic amenities and facilities. Such a pragmatic study is imperative for city planning formulation and policy making to enhance quality of life as well as level of living and human well-being as well as welfare.
REFERENCES
Ahmed, A., Ali, M., J. (2006), Levels of urbanization in West Bengal: A quantitative approach, Geographical Review of India, 68, pp. 407- 416.
Ali, J. and Verseney, D. (2012), SPATIAL MODELLING OF URBAN GROWTH AND URBAN INFLUENCE: APPROACH
OF REGIONAL DEVELOPMENT IN DEVELOPING
ECONOMY (INDIA), Journal of Urban and Regional Analysis, Vol. IV (2), pp. 129 -148.
Ali, M. and J, Mustaquim (2007), Growth of urban population and trends of urbanization in North Bengal, India: A study in spatio-temporal perspective, Asian Profile, 35, pp. 221-236.
Bhagat, R., B. (2002), Challenges of rural-urban classification for decentralized governance, Economic and Political Weekly, 37, pp. 2413-2416.
Bhagat, R., B. (2005), Urban growth by city and town size in India, paper presented in the Annual Meeting of Population Association of America, Philadelphia, U.S.A.
Pramanik, B (2005): Endangered Demography: Nature and impact of Demographic Changes in West Bengal, 1951-2001.
Biswas, S.K. (1980): Qualitative Evaluation of the Development Potentialities of the Towns of Bijnor District, in Settlement System of India, Ed. by Manzoor alam and K.N. Gopi, Oxford and IBH Publishing Co., New Delhi, India.
Bhat, L. S. (1976): Micro-Level-Planning, A Case Study of Harnal Area, Haryana, India, K.S. Publication, New Delhi, pp. 60-71. Bradford, M.G. and Kent, W.A. (1987). Theories and their
Applications. Oxford University Press, London.
Carr, M. (1997). New patterns: Processes and Change in Human Geography, Thomas Nelson and Sons, UK.
Conyers, D. (2001). Regional Development. ZOU Module, Harare. Geyer, H., and Kontuly, T. (1993), A theoretical foundation for the
concept of differential urbanization, International Regional Science Review, 17, pp. 157-177.
Glasson, J. (1978): An introduction to regional planning, Anchor
Press Ltd., Great Britain, Tiptree Essex (2nd Ed.).
Helmsing, A.H. (1986). Rural Industries and Growth Points. Issues in an Ongoing Policy debate in Zimbabwe, Occasional paper no.2. Department of Rural and urban Planning, UZ, Harare.
Hoselitz, B., F. (1971), The role of urbanization in economic development: some international comparisons, in D. J. Dwyer (eds.), The city in Third World, Mac Millan, London.
Kukadapwar, S.R. and Adane V.S. (2006): REGIONAL PLANNING THROUGH THE DEVELOPMENT OF A CENTRAL PLACE in ITPI JOURNAL, Vol. 3, No.2. pp. 29-35.
Lampard, E., E. (1955), The history of cities in economically advanced areas, Economic Development and Cultural Changes, p. 3.
Lokhande, T., N. and Pawar, C., T. (2004), Comparative analysis of service areas of market centres in Kolhapur district, Maharashtra, Geographical Review of India, 66, pp. 139 -148.. Mandal, R., B. (2000), Urban geography - a text book, Concept
Publishing Company, New Delhi, pp. 296-367.
Mills, E., S. and Backer, C., M. (1986), Studies in Indian urban development, Oxford University Press, New York.
Pawar, C., T. and Lokhande, T., N. (2001), Centrality and hierarchy of market centres in Kolhapur district, Maharashtra, The Deccan Geographers, 39, pp.1-14
Rao, Prakash, V., L., S. (1964), Towns of Mysore State, Asia Publishing House, Calcutta.
Roy, B. K. (1992), Monograph on Medinipur, Urban Studies Series– 4, NATMO, Kolkata.p-64.
Pascione, M. (2001), Urban geography: A global perspective, Routledge, London.
Murphy, E.,E. (1974), The American city: an urban geography, McGraw Hill, NewYork.
Thakur, R. (1994), Urban hierarchies, typologies and classification in early medieval India: 750-1200, Urban History, 21, pp. 61-76. Thakur, R. (2002), Mechanisms of urban growth in India: AD
600-1200, Urban History, 29, pp.187-196.
Tiwari, V., K., ET AL. (1986) eds., Indian cities: ecological
perspectives, New Delhi.
United Nationa (2001), World urbanization prospects: The 1999 revision, Population Division, Department of Economic and Social Affairs, U.N., New York.
Verma, L., N. (2006), Urban geography, Rawat Publication, Jaipur (India), p. 98.
Yasenovskiy, V. and Hodgson, J. (2007), Hierarchical location-allocation with spatial choice interaction modeling, Annals of the Association of American Geographers, 97, pp. 469-511.