Image Contrast Enhancement using Learning Vector
Quantization
Priyanka Yadav
M.Tech73, Durga Vihar Phase 2, Najafgarh-110010, New Delhi, India
Vineet Khanna
Assistant Professor
Rajasthan College of Engineering for Women, Jaipur
ABSTRACT
Human is gifted by god with five senses – sight, hearing, touch, smell and taste – which humans use to perceive their environment. Out of these five senses, sight is the most powerful. Image Contrast Enhancement with brightness preserving is a simple, effective and most widely used area among all digital image processing techniques. The goal of brightness preserving and contrast enhancement in general is to provide a more appealing image and clarity of details. These enhancements are intimately related to different attributes of visual sensation. In this paper we propose a method of image enhancement using Learning Vector Quantization for feature enhancement. Result shows a significant performance improvement by applying LVQ. Proposed method results generate better values of Absolute Mean Brightness Error (AMBE) and Peak Signal to Noise Ratio (PSNR) than other Histogram Equalization (HE) method.
Keywords
LVQ, HE, AMBE, PSNR
1. INTRODUCTION
Image processing technologies have received great attention in recent years. Image enhancement methods are based on improvements of contrast and brightness. In medical image processing, different image enhancement technologies used to enhance
input image pixel quality. In the case of gray-level image contrast enhancement, methods based on HE [1], [2], [3], [4], [5] have been the most used. Among the all these techniques, Histogram Equalization (HE) technique is a simple, computationally fast and widely used method in medical image processing.
A well-known drawback of HE that it does not preserve the brightness of the input image. This drawback makes the use of classical HE techniques [6] not suitable for image contrast enhancement on consumer electronic products, such as video surveillance, and also for medical image processing.
In consumer electronics and medical image processing, it’s require in various application where preserving the input brightness is essential. It is required to avoid the generation of non-existing artifacts in the output image.
To overcome such drawbacks, variations of the classic HE technique, such as [7], [8], [9], have proposed. In these techniques, they first decompose the input image into two images, and then perform HE independently in each sub-image. For the decomposition, these methods use some statistical measures of the image, which consider the value of
the image gray-levels. Those methods based on Bi-HE perform image contrast enhancement with success while preserving the input brightness in some extend, but they might generate images which do not look as natural as the input ones.
2. REVIEW OF THE PREVIOUS WORK
2.1 Multi-peak – Global Histogram Equalization
(GHE)
Mainly, enhancement methods can be classified into two classes: global and local methods.
[image:1.595.353.545.456.645.2]Local methods employ feature-based approach and the local features can be gained by using edge operators or by computing local statistics such as local mean, standard deviation etc. In this paper, the multi-peak generalized histogram equalization (multi-peak GHE) is proposed [16]. In this method, the global histogram equalization is improved by using multi-peak histogram equalization combined with local information. This flow chart of the multi-peak GHE is as follows:
Figure 1: Block diagram of multi-peak GHE
2.2 Partially overlapped sub-block histogram
equalization (POSHE
)
They presented an advanced Histogram Equalization algorithm for contrast Enhancement .Global Histogram Equalization is simple and fast but its contrast enhancement power is relatively low. Local histogram enhancement is on the other hand, can enhance overall contrast more effectively. For High contrast and simple calculation a low pass filter type mask is proposed. This mask also eliminates the blocking effect of non-overlapped sub-block histogram-equalization. The low pass filter type mask is realized by partially overlapped sub-block histogram equalization (POSHE)[17].POSHE is derived from local histogram equalization but it is much effective and much faster. In order to make the histogram equalization locally adaptive for higher contrast, and reduce the computation complexity ,non-overlapped sub-block histogram equalization is essential. In this method, all pixels in each sub-block are histogram equalized using the sub-block’s histogram . Further, these sub-blocks are not overlapped with adjacent sub-blocks, so the computation complexity is reduced considerably. This non-overlapped method cannot avoid a blocking effect. To eliminate these effects, additional operations are needed. Blocking effects occur due to shape differences between histogram-equalization functions of neighboring sub-blocks. The most important feature of POSHE is Low-pass filter shaped mask.
2.3 Generalized Histogram Equalization (GHE)
They present an adaptive contrast enhancement method based on the generalized histogram [10].This method is obtained by relaxing the restriction of using the integer count. For each pixel, the integer count 1 allocated to a pixel is split into the fractional count and the remainder count. The generalized histogram is generated by accumulating the fractional count for each intensity level and distributing the remainder count uniformly throughout the intensity levels. The intensity mapping function, which determines the contrast gain for each intensity level, is derived from the generalized histogram. Since only the fractional part of the count allocated to each pixel is used for increasing the contrast gain of its intensity level, the amount of contrast enhancement is adjusted by varying the fractional count according to regional characteristics. By adjusting the fractional count for each pixel according to user’s requirement and its spatial activity, the amount of contrast enhancement is controlled appropriately to the human observers. Therefore, the proposed method can achieve visually more pleasing contrast enhancement than the conventional histogram equalization methods.2.4 Multi-Histogram Equalization (Multi-He)
They proposes a novel technique called Multi-HE [11], which consists of decomposing the input image into several sub-images, and then applying the classical HE process to each one. In this method for the decomposition of image propose to cluster the histogram of the image in classes, where each class corresponds to a sub-image .By dividing original image into sub-images, we want to minimize the brightness shift yielded by the HE process into each sub-images .With them inimization of this shift, this method is expected to preserve both the brightness and the natural appearance of the processed image. This methodology performs a less intensive image contrast enhancement, in a way that the output image presents a more natural look. They propose two discrepancy
functions for image decomposing, conceiving two new Multi-HE methods. A cost function is also used for automatically deciding in how many sub-images the input image will be decomposed on. Experiments show that their methods preserve more the brightness and produce more natural looking images than the other HE methods. In this work, they proposed and tested a new framework called MHE for image contrast enhancement and brightness preserving which generated natural looking images. The experiments showed that their methods is better on preserving the brightness of the processed image (in relation to the original one) and yields images with natural appearance, at the cost of contrast enhancement. The contributions of this work are threefold: 1) An objective comparison among all the HE methods using quantitative measures, such as the PSNR, brightness and contrast; 2) An analysis showing the boundaries of the HE technique and its variations (i.e., Bi- and Multi-HE methods) for contrast enhancement, brightness preserving and natural appearance; 3) Their proposed methods.
2.5 Image Dependent Brightness Preserving Histogram
Equalization (IDBPHE)
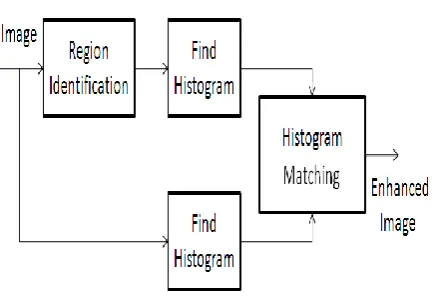
The proposed image dependent brightness preserving histogram equalization (IDBPHE) [12] technique use the wrapping discrete curvelet transforms (WDCvT) and the histogram matching technique. A simple diagram of IDBPHE is shown in Fig.2.2 and the corresponding steps are given below.
1) Region identification and separation: The
curvelet transform is used to identify bright regions of an original image.
2)
Histogram computation and matching:
(A) Histogram of the original image and the histogram of pixels which belong to the identified regions are computed.
[image:2.595.321.540.488.639.2](B) Modify a histogram of the original image withrespect to a histogram of the identified regions.
Figure 2: Flow chart of IDBPHE
A subjective assessment to compare the visual quality of the images is carried out. Absolute Mean Brightness Error (AMBE) and Peak Signal to Noise Ratio (PSNR) are used to evaluate the effectiveness of the proposed method in the objective sense.
Figure 3: Flow chart for region identification and matching in IDBPHE
2.6 Image Contrast Enhancement Using Fast Discrete
Curvelet Transform via Unequally Spaced Fast
Fourier Transform (FDCT-USFFT)
According to FAST DISCRETE CURVELET TRANSFORM (FDCT) [13],curvelet transform has two different versions .First version use a little bit complex procedure which includes the ridgelet transform of radon transform of an image.
Second version did not use ridgelet transform, the repetition reduced which leads to increased speed [11].
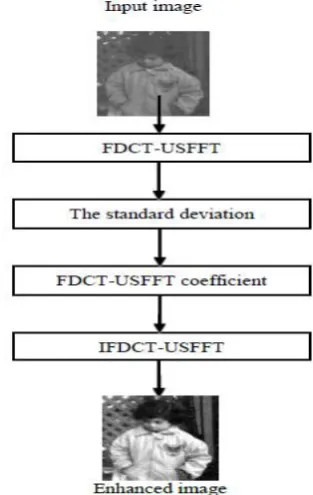
The proposed technique FDCT-USFFT based on contrast enhancements, designed in such a way so it enhance the contrast with efficient manner in digital images. The FDCT-USFFT is a powerful algorithm for the images which has sharp edges .In multi-scale edge based image, this algorithm is a good choice.
The FDCT-USFFT method consists of the following step: Step 1: Input image I..
Step 2: Apply the FDCT -USFFT on input image. In this step we get a set of bands .Each band correspond to a given resolution level.
Step 3: Compute the standard deviation for each band of the FDCT-USFFT.
Step 4: For each band do multiply each FDCT-USFFT coefficient.
[image:3.595.348.505.84.332.2]Step 5: Reproduce the image from the modified FDCT-USFFT coefficients .This result is the enhanced image.
Fig 4: Proposed Chart of FDCT-USFFT
In the tests, the FDCT-USFFT technique has been implemented to set of low contrast gray images of 512×512 size . The technique has been implemented in MATLAB, using the curve-lab toolbox to get the fast discrete curvelet coefficients using unequal spaced fast Fourier transform.
3. MULTI RESOLUTION HISTOGRAM USING LINEAR
VECTOR QUANTIZATION FILTER (MRHLVQ)
The proposed Multi Resolution Histogram using Linear Vector Quantization Filter (MRHLVQ) use the wrapping discrete curvelet transforms (WDCvT).
3.1 Curvlet Transform
Motivated by the need of image analysis, Candes and Donohol developed curvelet transform in 2000 [14]. Curvelet transform has a highly redundant dictionary which can provide sparse representation of signals that have edges along regular curve. Initial construction of curvelet was redesigned later and was re-introduced as Fast Digital Curvelet Transform (FDCT) [13]. This second generation curvelet transform is meant to be simpler to understand and use. It is also faster and less redundant compared to its first generation version. Curvelet transform is defined in both continuous and digital domain and for higher dimensions. Since image-based feature extraction requires only 2D FDCT, we’ll restrict our discussion to the same .In order to implement curvelet transform, first 2D Fast Fourier Transform (FFT) of the image is taken.
3.2 Learning Vector Quantization (LVQ)
networks such as the Perceptron and the Back-propagation algorithm. It is related to other competitive learning neural networks such as the Self-Organizing Map algorithm that is a similar algorithm for unsupervised learning with the addition of connections between the neurons. Additionally, LVQ is a baseline technique that was defined with a few variants LVQ1, LVQ2, LVQ2.1, LVQ3, OLVQ1, and OLVQ3 as well as many third-party extensions and refinements too numerous to list. Vector Quantization is a technique from signal processing where density functions are approximated with prototype vectors for applications such as compression. Learning Vector Quantization is similar in principle, although the prototype vectors are learned through a supervised winner-take-all method.
3.3 Architecture of basic Learning Vector
Quantization method
[image:4.595.65.267.350.502.2]Architecture of Learning Vector Quantization is similar to the architecture of Kohonan’s Self Organization Map (SOM). Here in the following diagram input is represented by x and output is represented by y. Number of inputs are n and number of output are m. In between input layer and output layer we apply weight which is used to adjust the training network to control the output so the actual output will matched with the desired output.
Fig 5: Architecture of Learning Vector Quantization
In the above architecture diagram the following terms are represents:
x = training vector (x1,...,xi,...,xn)
T = class for training vector x
wj = weight vector for j th
output unit
Cj = class associated with the jth output unit
3.4 Training Algorithm of LVQ
Step 1 − Initialize reference vectors, which can be done as follows −
Step 1(a) − From the given set of training vectors, take the first “m” (number of clusters) training vectors and use them as weight vectors. The remaining vectors can be used for training.
Step 1(b) − Assign the initial weight and classification randomly.
Step 1(c) − Apply K-means clustering method.
Step 2 − Initialize reference vector αα.
Step 3 −Continue with steps 4-9, if the condition for stopping this algorithm is not met.
Step 4 −Follow steps 5-6 for every training input vector x.
Step 5 − Calculate Square of Euclidean Distance for j = 1 to m and i = 1 to n
D(j)=∑i=1n∑j=1m(xi−wij)2
D(j)=∑i=1n∑j=1m(xi−wij)2
Step 6 − Obtain the winning unit J where D(j) is minimum.
Step 7 − Calculate the new weight of the winning unit by the following relation −
if T=Cj then
wj(new)=wj(old)+α[x−wj(old)] wj(new)=wj(old)+α[x−wj(old)]
if T≠Cj then
wj(new)=wj(old)−α[x−wj(old)] wj(new)=wj(old)−α[x−wj(old)] Step 8 − Reduce the learning rate αα.
Step 9 − Test for the stopping condition. It may be as follows −
Maximum number of epochs reached.
[image:4.595.325.532.405.688.2] Learning rate reduced to a negligible value.
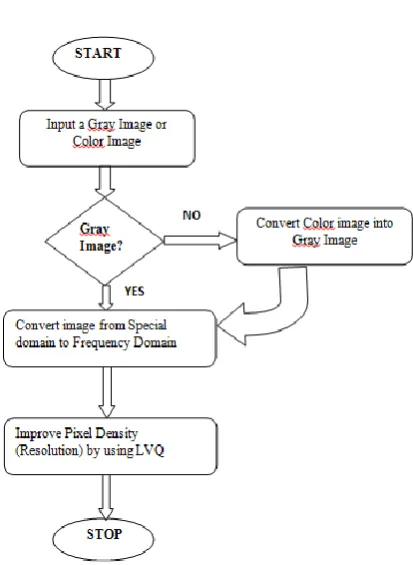
Fig 6: Flow Chart of Proposed Method
Following steps and flow chart figure 3.3 represent the proposed method working procedure
:
Step 1:In step we find all co-ordinates of input image using curvlet transform. These co-ordinates contain signal and noise as well. This matrix is called pixel resolved matrix.
Step 2:In this step we check whether the provided image is a gray image or not a gray image. If it is a gray image then process this image into next step and if it is a color image than convert this color image into gray image.
Step 3:In next step we apply the pixel difference method and calculate the diagonal difference between the pixels. In this method difference is not calculated on the basis of neighbor but it is calculated on the basis of diagonal pixels.
Step 4: In next step we calculate the mean (Im) of image matrix. This mean is useful to calculate the pixel difference matrix, which is an important parameter to correct the contrast value.
Step 5: (Apply LVQ) In this step from the value of weight vector we take the first m (number of clusters) training vector. This is used as weight vector or weight matrix. After that assign weight matrix and apply k-means clustering.
Step 6: In this step we calculate the image by which we analyses the result.
out in j
I
I W
Where
I
in = input image co-ordinateout
I
= output image co-ordinateWj = weight vector
Step 7: Repeat step 5 until image pixels reach to the nearest value of mean. After this step we will get the final image which has better PSNR and AMBE value.
4. RESULT AND ANALYSIS
The proposed method was tested with several gray scale images and has been compared with histogram equalization methods HE, Multi-Histogram Equalization (MHE) and Image dependent brightness preserving histogram equalization (IDBPHE) techniques .They are named as they were in the works where they first appeared: Einstein .We analyze brightness (the mean) and contrast(the standard deviation) values of the original and output images. In order to assess the appropriateness of the processed images for medical image processing and consumer electronics products, for each image, we compute the PSNR measure [15].
Fig 7: Original Image and it’s Histogram
Fig 8: Image and it’s histogram after HE
[image:5.595.306.549.70.640.2]Fig 9: Image and it’s histogram after MHE
Fig 11: Image and it’s histogram after Proposed Method
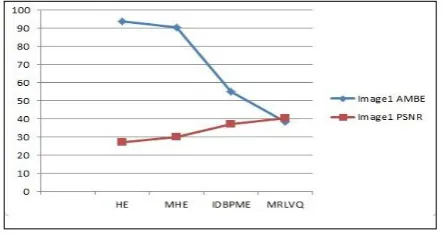
The following graph represents the comparison for AMBE and PSNR values for image Einstein.
Fig 12: Comparison of AMBE and PSNR
5. CONCLUSION AND FUTURE WORK
5.1 Conclusion
This dissertation, present a new contrast enhancement algorithm referred as the enhancing contrast and preserve brightness .This algorithm use multilayer perceptron to decrease the distance between image pixels or increase the pixel density and Histogram equalization algorithm .Equalization with better brightness preservation is proposed. The algorithm is an extension of Image Contrast Enhancement Using Fast Discrete Curvelet Transform via Unequally Spaced Fast Fourier Transform (FDCT-USFFT).
In this proposed work Multi Resolution Histogram using Linear Vector Quantization (MRHLVQ) filter technique is proposed for image contrast enhancement and brightness preserving. Curvlet transform, Liner Vector Quantization (LVQ)and histogram matching techniques enhance the original image contrast level and also preserve the brightness. Proposed method is checked on standard image such as Barbara, lena and cameraman image. Proposed method enhances the contrast and improves the image visualization more effectively. Proposed method is compared with the other existing methods like HE, MHE and IDBPHE. Proposed technique modifies AMBE value is 20% and PSNR is approx. 10%.
5.2 Future Work
1) In the future the execution time of this algorithm may be improved.
2) In future this algorithm can be extended for a color image.
3) The performance of the algorithm can further be increased by using Genetic Algorithm.
6. REFERENCES
[ 1 ] R.C. Gonzalez and R.E. Woods. Digital Image Processing. Prentice Hall, Upper Saddle River, New Jersey, EUA, 3nd edition, January 2008.
[ 2 ] S.M. Pizer, E.P. Amburn, J.D. Austin, R. Cromartie, A. Geselowitz, T. Greer, B.M. terHaarRomeny, J.B. Zimmerman, and K. Zuiderveld. Adaptive histogram equalization and its variations. Computer Vision, Graphics and Image Processing, 39(3):355– 368, September 1987.
[ 3 ] H. Ibrahim and N.S.P. Kong. Brightness preserving dynamic histogram equalization for image contrast enhancement. IEEE Transactions on Consumer Electronics, 53(4):1752–1758, November 2007.
[ 4 ] Joung-Youn Kim, Lee-Sup Kim, and Seung-Ho Hwang “An Advanced Contrast Enhancement Using Partially Overlapped Sub-Block Histogram Equalization” in IEEE Transations on circuits and systems for video technology vol. 11, NO. 4, APRIL 2001.
[ 5 ] David Menotti, Laurent Najman, Jacques Facon, and Arnaldo de A. Araújo “Multi-Histogram Equalization Methods for Contrast Enhancement and Brightness Preserving” in IEEE Transactions on Consumer Electronics, Vol. 53, No. 3, AUGUST 2007.
[ 6 ] H.D. Cheng and X.J. Shi in “A simple and effective histogram equalization approach to image enhancement” in Digital Signal Processing 14 (2004) 158–170.
[ 7 ] H. Zhu, F.H.Y. Chan, and F.K. Lam. Image contrast enhancement by constrained local histogram equalization. Computer Vision and Image Understanding, 73(2):281– 290, February 1999.
[ 8 ] Y.J. Zhang. “Improving the accuracy of direct histogram specification”. Electronics Letters, 28(3):213–214, January 1992.
[ 9 ] S. Kundu. A solution to histogram-equalization and other related problems by shortest path methods. Pattern Recognition, 31(3):231–234, March 1998.
[ 10 ] HasanulKabir, Abdullah Al-Wadud, and OksamChae “Brightness Preserving Image Contrast Enhancement Using Weighted Mixture of Global and Local Transformation Functions”in The International Arab Journal of Information Technology, Vol. 7, No. 4, October 2010.
[ 11 ] David Menotti, Laurent Najman, Jacques Facon, and Arnaldo de A. Araújo “Multi-Histogram Equalization Methods for Contrast Enhancement and Brightness Preserving” in IEEE Transactions on Consumer Electronics, Vol. 53, No. 3, AUGUST 2007.
[image:6.595.53.275.297.414.2][ 13 ] Abdullah M. Hammouche1et. al. “Image Contrast enhancement using Fast Discrete Curvlet Transformation via Unequally Spaced Fast Fourier Transformation (FDCT-USFFT) at IJCEIT Vol. 8 No. 3 March 2016 36-42.
[ 14 ] H.D. Cheng and X.J. Shi in “A simple and effective histogram equalization approach to image enhancement” in Digital Signal Processing 14 (2004) 158–170.
[ 15 ] Joung-Youn Kim et. al. “An Advanced Contrast Enhancement Using Partially Overlapped Sub-Block Histogram Equalization” in IEEE Transations on circuits and systems for video technology vol. 11, NO. 4, APRIL 2001.
[ 16 ] Woo-Jin Song and Byoung-Woo Yoon “Image contrast enhancement based on the generalized Histogram” in Journal of Electronic Imaging 16(3), 033005 (Jul–Sep 2007).
[ 17 ] Fan Yang, Jin Wu “An Improved Image Contrast Enhancement in Multiple-Peak Images Based son Histogram Equalization” in 2010 International Conference On Computer Design And Applications (ICCDA 2010).