ISSN Online: 2164-0181 ISSN Print: 2164-0165
DOI: 10.4236/mme.2018.82011 May 30, 2018 158 Modern Mechanical Engineering
Determination of Factors and Quality Control of
Car Painting Based on FMEA and SPC.V2
Masud Rana
1, Xinmin Zhang
1, Sayed Abdul Akher
21Department of Mechanical Engineering, Shenyang University of Technology, Shenyang, China
2Department of Plant Genome Engineering, University of Electronic Science and Technology of China, Chengdu, China
Abstract
The global automotive industry demands world-class levels of product quality, productivity, and competitiveness as well as continual improvement. To achieve this goal, many vehicle manufacturers companies use quality control tools to improve the quality of the product with zero defects and highly satis-fied to the customer. Nowadays, there are a lot of quality tools applied to solve the problem quickly but it’s still the fact to find out good and efficient solving way. The study emphasizes the identification of potential failure which fail-ures may have encountered in the production process and it will lead to car scrap, rework and influence of the internal production and quality target. Af-ter the complete study of the manufacturing process and production da-ta-failure causes, failure rate and data etc. FMEA discover the weak processes in the form of higher risk priority number in the manufacturing of the car painting process, which required reducing by identifying and implementing of the defects and this will improve the process quality of the painting surface of the car. To analysis, the improvement of the car surface defects SPC (Statistic-al Process Control) tools are more efficient where can easily visible the defects trends. SPC chart is chronological graphs of process data that are used in manufactures industries to help understand, control and improve the process and that although based on statistical theory area easy for practitioners to use and interpret. In order to orient goal of zero defects of the car, surface uses the PFMEA technique to prioritize the defects and statistically analyze the roots cause of the defect and control the defects through continues improvements process.
Keywords
Quality Management, FMEA, SPC, Control Technology, Quality Improvement, Paint
How to cite this paper: Rana, M., Zhang, X.M. and Akher, S.A. (2018) Determina-tion of Factors and Quality Control of Car Painting Based on FMEA and SPC.V2. Modern Mechanical Engineering, 8, 158-177. https://doi.org/10.4236/mme.2018.82011
Received: April 16, 2018 Accepted: May 27, 2018 Published: May 30, 2018
Copyright © 2018 by authors and Scientific Research Publishing Inc. This work is licensed under the Creative Commons Attribution International License (CC BY 4.0).
DOI: 10.4236/mme.2018.82011 159 Modern Mechanical Engineering
1. Introduction
Quality control and management is a crucial matter in the car industry. Consi-dering the incessantly increasing requirements for the quality of products and process, it is necessary to improve a quality-oriented management in all types of manufacturing company [1]. In addition to diverse technical requirements are also considering the requirements of the national, international and compa-ny-specific norms. The company must not only fulfill the requirements of the quality, but also the requirement of safety, environment, and economy [2]. As following, some aspects of the manufacturing quality management and their in-tegration manufacturing process will be introduced. Usually, technological ad-vance will lead to process improvement with time and could ultimately approach the states of the Zero-defect. In the tremendous, competition, survival of the fit-test is the law of competition in the market. The manufacturers need to use what kind of products, entirely by the market to make a fair conclusion [3]. Auto-mated products have high demand and market orientation due to its high quali-ty and low price. In such climate conditions, automobile production qualiquali-ty, ef-ficiency, resilience has become hard in pursuit of the goal of the manufacturers and the increasingly fierce market competition, forcing the manufacturers must continue to introduce new varieties while meeting the needs of users [4]. In or-der to quickly seize the market, car manufacturers must be more variety, fast-paced, high-quality mixed production, what products the market needs, we can as fast as the best products to the market. In an automotive company, Paint shop top coat inspection line is one of the important areas to produce the car smoothly without major defects formation. It’s very common fact that, in the top coat inspection line can highly influence the production rate and efficiency if there is no control of the defects and solving of the root cause of the defects ori-gination [5]. For rational and effective use of topcoat inspection line, we must solve the problem and must control the defects to get the high-quality results of the automotive cars.
DOI: 10.4236/mme.2018.82011 160 Modern Mechanical Engineering the performance trends. This factor is combined to assign prioritization for SPC implementation. This exercise that should be monitored on a periodic basis is via an enhanced method.
2. Theoretical Framework
2.1. Failure Mode and Effects Analysis (FMEA)
Failure Mode and Effects Analysis (FMEA) has long been used as a planning tool during the development of processes, products, and services. In developing the FMEA, the team identifies failure modes and actions that can reduce or elimi-nate the potential failure from occurring [4]. Input is solicited from a broad group of experts across design, test, quality, product line, marketing, manufac-turing, and the customer to ensure that potential failure modes are identified. The FMEA is then used during deployment of the product or service for troub-leshooting and corrective action. The standard FMEA process evaluates failure modes for occurrence, severity, and detection. The multiplication of these values leads to what is known as the risk priority number (RPN).
Occurrence Severity Detection
RPN= ∗ ∗
FMEA is a reliability tool, which requires identifying failure modes of a spe-cific product or system, their frequency, and potential causes. According to Ari-nez, Biller, Meerkov, & Zhang [12], the life cycle of a product is analyzed by an inter-functional work team. Daimler Chrysler, Ford, and General Motors have jointly developed an international standard named SAE J1739-2006 documenta-tion for FMEA. This document provides general guidance in the applicadocumenta-tion of different types of FMEA. First, the potential failure modes and potential causes are identified along with its effects and then the current controls are determined [13]. FMEA method is used to calculate RPN for each failure mode and then proposed recommended actions to reduce the RPN. The basic steps are to iden-tify the root causes and potential problems that could occur, and then derive RPN which can direct improvement effort to the areas of greatest concern. Ac-tions are then undertaken to reduce the risk presented by the failure mode. FMEA was developed at Grumman Aircraft Corporation in the 1950 and 1960s and it was first applied to the naval aircraft flight control systems at Grumman. Since, then, it has been extensively used as a powerful technique for system safe-ty and reliabilisafe-ty analysis of products and processes in a wide range of industries. Xiuxu Zhao presented a new approach for enterprises which combined Statistic-al Process Control (SPC) with FMEA knowledge library.
DOI: 10.4236/mme.2018.82011 161 Modern Mechanical Engineering potential effect of the failures, there causes, how often and when they might oc-cur and their potential seriousness. Process failure mode and effect analysis (PFMEA) is systemized group of activities intended to recognized and evaluated the potential failure of a product/process and its effect identify action which could eliminate or reduce the occurrence or improve the defect ability, docu-ment the process and track change to avoid the potential failure cause. FMEA is carried out by a cross-functional team of experts from various departments [15]. Normally, a team is formed at the planning stage of a new product based on a concurrent engineering approach. The team analyzes each component and sub-system of the product for the failure modes. Then, the potential causes and ef-fects are determined. The risk of each failure is prioritized based on the risk priority number (RPN). RPN is a decision factor based on three ratings: Severity (S), Occurrence (O) and Detection (D). These ratings are scaled with numbers between 1 and 10. The analysis starts from the basic structure of the system and particularly from those system elements for which accurate information about failure mode and its causes are available. By analyzing the functional relation-ships among these elements, it is possible to identify the possibility of propaga-tion of each type of failure to predict its effects on the producpropaga-tion performance of the entire system [16]. This is an inductive method to analyze failure modes using down-top methodology. The FMEA is a formalized but subjective analysis for the systematic identification of possible root causes and failure modes and the estimation of their relative risks. The main goal is to identify and then limit or avoid risk within a design. Hence, the FMEA drives towards higher reliability, higher quality and enhance safety. FMEA concentrates on identifying the severi-ty and criticaliseveri-ty of failures. FMEA is a fully bottom-up approach. Risk Prioriseveri-ty Number, which is the product of the severity, occurrence, and detection ratings are calculated as RPN = S × O × D. The RPN must be calculated for each cause of failure. RPN shows the relative likelihood of a failure mode, in that the higher number, the higher the failure mode [17]. From RPN, a critical summary can be drawn up to highlight the areas where the action is most needed. The RPN is re-calculated after the failure has been addressed. The revised RPN confirms the effectiveness of the corrective actions undertaken.
2.2. Implementation Methods for FMEA
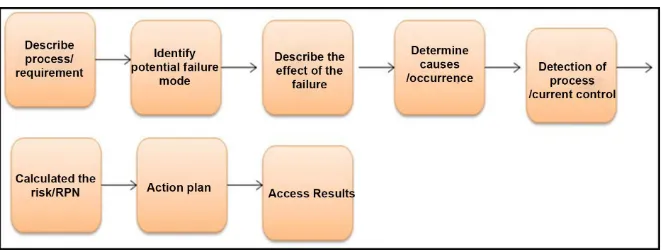
Implementation starts with the FMEA planning and crosses function team and creation for FMEA development and the evaluation of the results. After prepara-tion of the team and planning next step is to delay the manufacturing process and identification of each step process and documentation in the FMEA sheet. Standard FMEA sheet is developed by the IATF (International Automotive Task Force) which is given below (Figure 1):
DOI: 10.4236/mme.2018.82011 162 Modern Mechanical Engineering
Figure 1. Basic process steps of the process FMEA.
such as dimension, size, form, location, orientation, location, texture, coating, hardness, strength, appearance, reflectivity.
2.3. Potential Failure Mode
For each function, identify all the ways failure could happen. These are potential failure modes. If necessary, go back and rewrite the function with more detail to be sure the failure modes show a loss of that function. Potential failure modes have defined the manner in which the process could potentially fail to meet the process requirement. It’s a description of a non-conference at the specific opera-tion [18]. It can be associated with a potential failure mode in the subsequent (downstream) operation or effect associated with a rotation failure in a process operation. However, preparation of FMEA, the assumption may be made that the incoming part/materials are correct.
2.4. Potential Effect of Failure
The potential effect of failure is defined as the effect of the failure mode on the customer. The customer in this content could be next operation, subsequent op-eration or location, the dealer, the vehicle owner. Each must be considered when assessing the potential effect of failure.
2.5. Severity
Severity is an assessment of the seriousness of the effect and refers directly to the potential failure mode being studied. The customer in process FMEA is both in-ternal and where appropriate, the exin-ternal customer. The severity ranking is also an estimate of how difficult it will be for the subsequent operation to be carried out to its specification its performance, cost and time [19]. The ranking and suggested criteria are based on IATF manual of FMEA version 3. A common industry standard scale uses 1 to represent no effect and 10 to indicate very much severe with failure affecting system operation and safety without warning.
2.6. Cause of Failure Mode
DOI: 10.4236/mme.2018.82011 163 Modern Mechanical Engineering should be listed in technical terms and not in terms of symptoms. Examples of potential causes included improper torque applied, improper operating condi-tions, too much solvent, improper alignment, excessive voltage.
2.7. Occurrence
The occurrence is the assessment of the probability that the specific cause of the failure mode will occur. A numerical weight should be assigned to each because that indicates how likely that cause is probability of the occurrence. For that failure history is helpful increasing the truth of probability.
2.8. Detection
The detection steps distinguish between two steps of detection. On one hand to identify the current control process. The current control process is a mechanism that prevents the cause of the failure mode from occurring or which defect the failure before it reaches the customer. The engineer should now identify testing analysis, monitoring and other techniques that can or have been used on the same or similar products/process to detect the failure. The other things are to assess the probability that the proposed process controls will detect a potential cause of failure or a process weakness [7]. Assume the failure has occurred and then assess the ability of the control to prevent the shipment of the part with that defect, low occurrence does not mean low detection. The control should detect the low occurrence. The risk priority number is a mathematical product of the numerical severity, probability, and detection rating.
(
severity occurrence detection)
RPN= ∗ ∗ (i)
The RPN is used to prioritize items that require addition quality planning ac-tivities. If the RPN number high that means the occurrence of the failure is high.
2.9. Actions
Determine recommended action to address potential failures that have a high RPN. These actions could include specific of different components or materials, de-rating, limiting environmental stresses or operating range, redesign of the item to avoid the failure mode, monitoring mechanisms and inclusion of backup system (Figure 2).
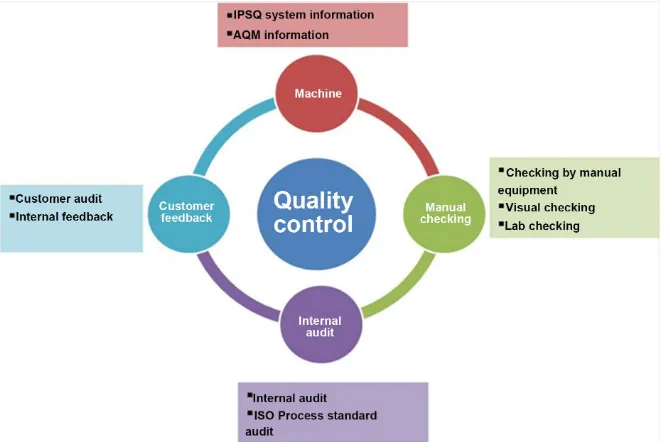
At the input collection and analysis by the SPC trends of the defects frequen-cy. After analyzing the defects priority use the FMEA tools to identify the root cause of the defects and get the FMEA repository [20]. Finally takes the process control of the defects. From the figure (Figure 3) we can understand the quality management module in the paint shop.
DOI: 10.4236/mme.2018.82011 164 Modern Mechanical Engineering
Figure 2. The principle of quality control based on FMEA and SPC.
Figure 3. Quality control methods in the painting process.
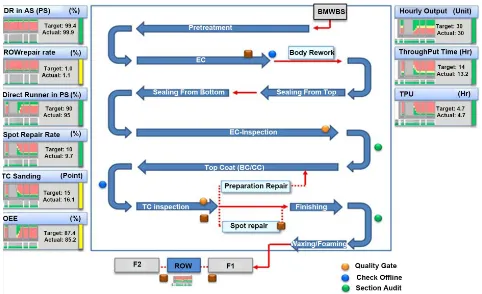
internal target as hourly put, repair rate which helps us to figure out root cause in case of any tolerance of the production (Figure 4).
3. Methodology
[image:7.595.208.540.301.522.2]DOI: 10.4236/mme.2018.82011 165 Modern Mechanical Engineering
Figure 4. Quality control gate in the Painting process.
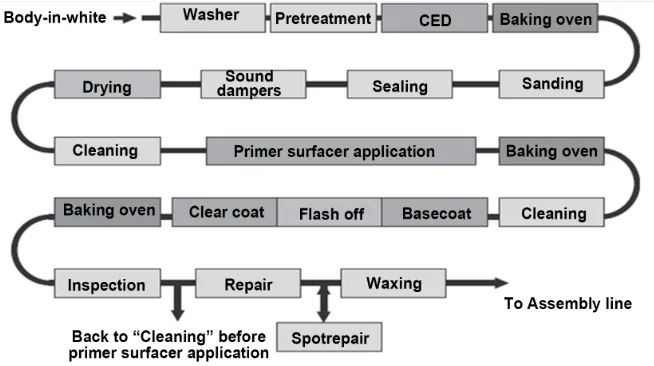
DOI: 10.4236/mme.2018.82011 166 Modern Mechanical Engineering coats are applied wet-on-wet, without intermediary drying (see Figure 5). Sur-face coating technology is going through an exciting time. The purpose here is a clear-cost reduction, environmental compliance, and improved quality [9]. Car painting process methods are:
Pretreatment;
Electro coating;
Sealing and underbody protection;
Paint application;
Function layer and Basecoat application;
Clear coat application;
Cavity and wax application.
[image:9.595.210.537.522.705.2]Pretreatment consists of the steps of precleaning, degreasing, purging, and phosphating. Precleaning removes the rough contaminations. Degreasing solu-bilizes grease, for example, deep-drawing greases, oil, wax, and other contamina-tions acquired from the earlier working processes [16]. Phosphating following after a purging process serves as a temporary corrosion protection and improves the adhesiveness of the paint film when it is applied. Electrocoat paints are wa-ter-soluble with only low proportions of organic solvents (approximately 3%). Electrocoating covers all dip painting processes, where the paint precipitates on the workpiece owing to chemical conversion and associated coagulation of the binder [22]. The overlapping, spot-welded metal sheets must be sealed in such a way that no humidity can penetrate between the metal sheets and water in the vehicle interior, which may lead to corrosion there. On the weld seams, high viscous Polyvinylchloride (PVC) material is mostly sprayed as paths with the airless application or extruded by flat stream nozzles. The underbody protection also serves as protection from corrosion, mostly for areas exposed to a high strain because of stone chips. It is applied partially two-dimensionally, for in-stance, in wheel arches, and in the rocker panel area [23]. The primer surfacer which is called BC1 applied on top of the electro coat protects the cataphoretically
DOI: 10.4236/mme.2018.82011 167 Modern Mechanical Engineering cataphoretically electrocoating film from ultraviolet (UV) radiation, serves as a surface smoothing primer for the following topcoat film, and reduces the risk of damage to the layers below, in case of stone chips. Bumps and faults stemming from the body shop like grinding remains can be repaired by sanding the primer coat. The primer is applied to the high-speed-rotating application with the elec-trostatic charging of the paint material. For reasons of volatile organic com-pounds (VOC) emission, hydro primer materials are mostly used in Europe and powder, to a certain degree, in North America. A further reduction of emissions has been achieved with the development of two different processes.
The function layer combines the characteristics of the primer and the base coat material. It is matched in color to the following basecoat material, which is then only applied in one coat on the wet or flashed off function layer. This is also valid for the metallic effect material. In this process, the entire process chain consists only of four paint applications cathodic electrocoating, function layer, base coat, and clear coat, compared to five layers for the conventional metallic painting cathodic electrocoating, primer surface, basecoat 1, base coat 2, and clear coat. Apart from the emission reduction, this process has the advantages of the reduced installation investment and overheads owing to the omission of one painting line. A disadvantage is the fact that faults from the body shop and the cataphoretic electrocoat process that are not eliminated after the cataphoretic electrocoat can only be processed after the top coat painting. The top coat is ap-plied after athorough cleaning of the entire car body. The prevalent process for the top coat application is the application of a waterborne base coat, followed by a clear coat. The topcoat application is followed by a quality control check. The paint film is examined for faults like dirt inclusions, wetting disturbances, run-ners, and other such defects. Additionally, the film thickness and the visual pa-rameters like color shade, gloss, and leveling are measured regularly. The corro-sion protection measures are finalized with the sealing of the cavities with wax materials. For this, two procedures are usually followed—spraying and flooding [3]. For spraying, special nozzles are inserted in the cavities, and an exactly measured quantity of material is sprayed inside each cavity. For flooding, the cavities are filled with flooding wax, under pressure.
3.2. Process related Factors of Paint Performance
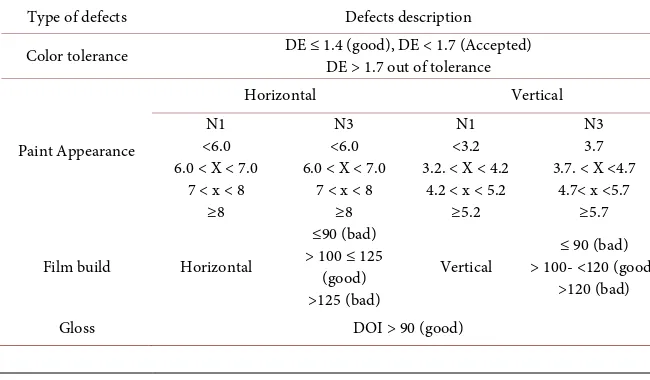
DOI: 10.4236/mme.2018.82011 168 Modern Mechanical Engineering operational. Paint function defects evolution standard for process parameters factors (Table 1).
3.3. Quality Aspects of the Painting Process
The management level of a paint shop requires constantly updated data and facts about the state of the painting installation, to be able to make decisions based on the facts available. These may be short-term decisions such as the introduction of extra shifts, or changes in operations owing to a high repair rate, or long-term measures like a change of a subcontractor owing to quality problems [24]. The system accesses the data from the process data recording and consolidates them to the required management data. The data feedback from the different module which is depending on the machine, manual checking, internal audit and cus-tomer feedback [25]. Quality manual inspection is carried out by a different measuring device such as color measurement device, film build device, appear-ance measuring device, gloss measuring device. Aside Quality online measuring system AQAMis controlled by the trained qualified specialist which data moni-tor by the quality database and processed immediately and shows on the work-piece, according to their place of measurement. IPSQ system uses to input the defects online during the manual operation by the qualified operator.
[image:11.595.206.531.551.741.2]The results of the automotive coating surface measurement data which con-trol the surface defects as film build, paint structure, color measurement. All this three-important surface factors are measuring by the robots’ technology and get an initial result of the car surface and can see the color deviation from the stan-dard. The measuring requirement is according to the production batch of the color and if there some non-conforming product found initially test a certain amount of car to figure out the defective cars and analysis the measuring data by the responsible engineers [18]. In order to make sure the data of the automotive measuring equipment is in control also measuring car with the manual device to compare with AQM data in order to make sure the capability of the process performance is in range. The Automatic painting installations with units like
Table 1. Defects type with surface description.
Type of defects Defects description
Color tolerance DE ≤ 1.4 (good), DE < 1.7 (Accepted) DE > 1.7 out of tolerance
Paint Appearance
Horizontal Vertical
N1 <6.0 6.0 < X < 7.0
7 < x < 8 ≥8
N3 <6.0 6.0 < X < 7.0
7 < x < 8 ≥8
N1 <3.2 3.2. < X < 4.2
4.2 < x < 5.2 ≥5.2
N3 3.7 3.7. < X <4.7
4.7< x <5.7 ≥5.7
Film build Horizontal
≤90 (bad) > 100 ≤ 125
(good) >125 (bad)
Vertical > 100- <120 (good) ≤ 90 (bad) >120 (bad)
DOI: 10.4236/mme.2018.82011 169 Modern Mechanical Engineering process equipment, environmental equipment, conveyors, robots, and applica-tion equipment are complex systems whose controllability is subject to the per-formance of the total process and the coating result [12]. Therefore, the functio-nality and the operability of the control-technology equipment are essential, and high demands are made on the appropriate control technology.
3.4. Process Monitoring and Regulation
The complexity of automatic painting installations and a large number of dif-ferent process parameters makes it complicated for the plant operator to main-tain a high quality of production, and for the service personnel to eliminate de-fects without delay [26]. Systems that support the operator in the diagnosis, op-timization, and monitoring of the processes are already in use. New systems are being developed to further improve on these, by taking into consideration quali-ty-oriented control of the painting processes and process parameters. The link-ing up of such systems with all levels of the process and the installation, and with the control technology necessary for doing so, makes them very effective tools. As shown in Figure 6, the structure of the quality and process control methods mainly contains three steps:
Step 1: Function step: It makes real-time data acquisition and analysis in the manufacturing process. It can output the statistical analysis results in the form of a quality report. Input the data of manufacturing process into the SPC system [4]. Data mainly collect on the basis of the Manual inspection, Audit feedback (internal and external audit), automotive measuring feedback (AQM, IPSQ sys-tem).
Step 2: Data evaluation: It implements the FMEA process, which conducted by the experts coming from the different area. The knowledge and experience of experts will be extracted by the brainstorming activity. Then, The FMEA results will be transformed into FMEA knowledge according to with a specific method and put into FMEA repository [11].
Step 3: Risk Priority: It’s designed to store the data collected by SPC system and find out the potential root cause after priorities the specific repository and take immediate control plan and corrective action in order to the improvement of the quality [19].
4. Results and Discussion
4.1. Analysis and Interpretation
DOI: 10.4236/mme.2018.82011 170 Modern Mechanical Engineering
Figure 6. A specific control based on FMEA repository and SPC system.
Figure 7. Diagram of the weekly percentages of the non-conformities.
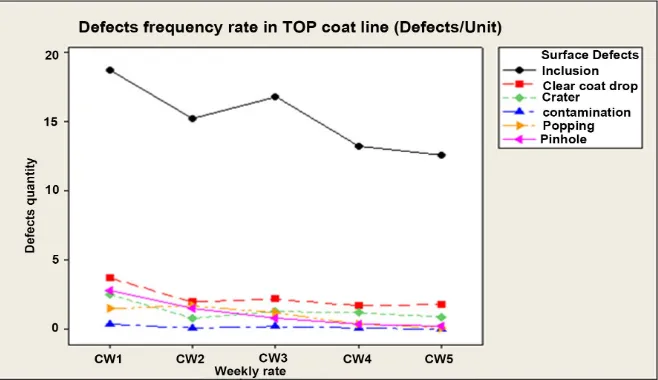
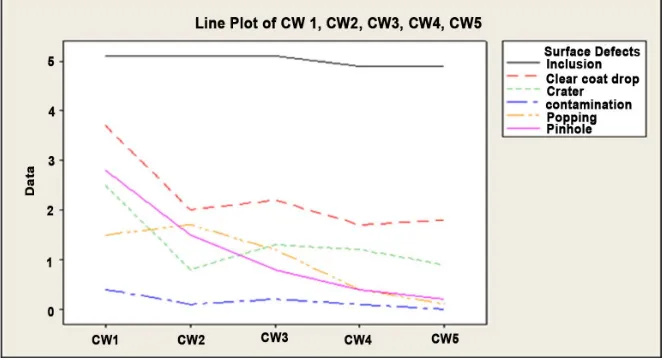
10 defects but from the data, we can see that inclusion defects mostly influence the target. To analysis, the defective car from the total production, Take the sample as a 5 subgroup and each group check the 10 cars as a sample.
[image:13.595.209.538.298.488.2]DOI: 10.4236/mme.2018.82011 171 Modern Mechanical Engineering
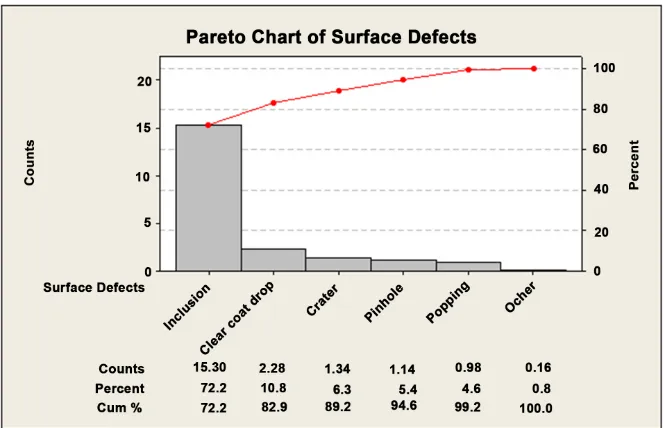
Figure 8. Pareto diagram for the surface defects trends in the TC.
Ishikawa analysis to figure out the potential causes of the inclusion defects: These diagrams depict an array of potential causes of quality problems. The problem (the head of the fish) is displayed on the right, and the bones of the fish—representing the potential causes of the problem—are drawn to the left. Potential causes are often categorized as materials, equipment, people, environ-ment, and management. Other categories may be included as appropriate. Use-ful in brainstorming the causes of problems from multiple perspectives, these diagrams should include all possible reasons for a problem. When completed, further analysis is done to identify the root cause. Figure 9 is an Ishikawa dia-gram to figure out the root cause of the particle issues in the top coat line. From this issue need to prioritize the possible causes that may influence the inclusion defects on the car surface [12]. To eliminate this defect, first need established a team which integrated with the relevant departments as a core team.
4.2. Potential Root Cause and Risk Analysis by FMEA
FMEA method is applied in painting technological process, so the severity (SEV) of risk occurrence, the probability (OCC) of risk occurrence and the probability of risk detection (DET) are determined. All assessments are expressed by nu-merical values. The nunu-merical value can be calculated the value of Risk Priority Number (RPN) with Equitation (2):
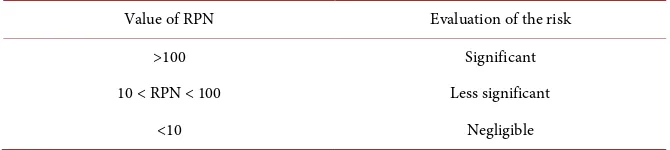
RPN O S D= × × (2) The ranking of RPN is presented in Table 2.
FMEA worksheet creation, there have been used data from Department for control and quality assurance, Maintenance department for equipment interven-tions, Production Department and IT department.
DOI: 10.4236/mme.2018.82011 172 Modern Mechanical Engineering
Figure 9. Ishikawa diagram prepared for investigation of the cause of the particles on
[image:15.595.207.539.72.231.2]surfaces.
Table 2. A general indication of the risk.
Value of RPN Evaluation of the risk
>100 Significant
10 < RPN < 100 Less significant
<10 Negligible
phase. FMEA analysis shows that RPN has a higher value of 245 in the process of manual inspection of the car surface, RPN rate is 126 in the process steps roller bed and skid inspection and Lab test results process steps RPN is 128. As the risk value priority is higher of 100, the risk in the 1st, 3rd and 5th step (the process of inspection, roller, and skid, lab test) from the production process is considered as significant, while in the rest of the steps the value of the RPN ranges between 8 - 100 [1]. Therefore, it is considered as less significant or insignificant. If sur-face inclusion is determined during the control measurement of the inspection process and small opportunities for the detection i.e. DET = 5. While in the daily roller bed and skid inspection process and lab test process the fault is obvious and the probability that the product with defects will be distributed is low (DET = 2 - 3). The value of RPN shows in plot chart (Figure 10), shows that the 1st, 3rd and 5th process of the diagram are considerably higher in relation to the other phases and after take action the RPN rate is in control rate and mean value is 5.8 that is negligible according to the RPN rating scale. So, the process is in the control limit.
4.3. Reflow SPC Measurement Data
[image:15.595.206.541.296.371.2]DOI: 10.4236/mme.2018.82011 173 Modern Mechanical Engineering
Figure 10. Lin plot chart for evaluation the RPN rate before and after the corrective
ac-tion.
Figure 11. Diagram of the weekly percentages of the non-conformities after corrective
action.
which can easily understand that new improvement actions could be proposed toward the minimization of the RPN. From the Figure 11 C-chart shows that average inclusion trends rate is 3.94 which are under the control. The data is a collectionof the corrective action taken which improvement is obvious.
4.4. Evaluation
[image:16.595.207.539.290.470.2]DOI: 10.4236/mme.2018.82011 174 Modern Mechanical Engineering also required to find the proper way to lessen the failure mode. Severity ranking remains almost same if the failure mode is not eliminated. In FMEA worksheet, if severity ranks 10 or 9, it shows red mark (red marks suggest for quick preven-tive work). There will be an acceptable RPN limit for any company. It may differ for different companies. Painting process has a grand limit of 100 RPN. The FMEA team needs to see after the action was taken for the design or process whether the RPN value is less than 100 or not. One will get a graph of RPN of before (red marked) and after the action (blue marked). Here, it is possible to compare the performance development by FMEA process. It is seen that before the action was taken the RPN value was 150 - 260 but when the corrective action was taken the RPN values plunged exponentially from 150 - 260 to 30 - 100 [23]. If it is not less than 200, the FMEA team is instructed to take necessary correc-tive action and will have to compare the RPN value of before the action was taken and after the action was taken. In criticality analysis, the occurrence data are plotted in X-axis and severity data are plotted in Y-axis. As a result, there are four zones for considered according to the position of failure modes named: confirmed critical characteristics confirmed significant characteristics, RPN- Top 20% by Pareto and annoyance region [28]. From these zones, the FMEA team can decide that which failure modes should be prioritized more. The zones should be considered confirmed critical characteristics zone, confirmed signifi-cant characteristics, annoyance region and RPN-Top 20% by Pareto respectively. RPN-Top 20% by Pareto means which 20% failure mode should be prioritized of 100%. Top 20% failure modes should be considered as the most part of the zone is very acceptable. The study shows some differences between FMEA and FMECA. The main difference between the company findings and the theoretical finding of this report is: Parker Hannifin is using a grand limit for RPN value and it is 200 [24]. If severity ranks 10 or 9, it marks red for alarming the design or process. In criticality analysis, the company is only performing the the qualit-ative part.
5. Conclusion
tech-DOI: 10.4236/mme.2018.82011 175 Modern Mechanical Engineering nique for potential failure is very important. The application of appropriate me-thods and techniques for monitoring and quality control in the painting process will allow managers scientific approach in the quality assurance and production of high-quality products at minimum costs. Based on the results of FMEA and Pareto analysis, the source of poor quality is identified and its reduction of 80% of the top 1 defects. The corrective action is taken and the required accuracy in top coat line is achieved with the combination of the FMEA and SPC method figures out the excellent tools for organizations self-assessment and tends to im-prove the performance of top coat defects.
References
[1] Akafuah, N., Poozesh, S., Salaimeh, A., et al. (2016) Evolution of the Automotive Body Coating Process—A Review. Coatings, 6, 24.
https://doi.org/10.3390/coatings6020024
[2] Sarker, M.N.I., Hossin, M.A., Anusara, J., et al. (2018) Practices of Low Carbon Economy in China : Challenges and Opportunities for Economic Development. Low-Carbon Economics, 9, 18-32. https://doi.org/10.4236/lce.2018.91002
[3] Poozesh, S., Akafuah, N. and Saito, K. (2018) Effects of Automotive Paint Spray Technology on the Paint Transfer Efficiency—A Review. Journal of Automobile Engineering, 232, 1-20. https://doi.org/10.1177/0954407017695159
[4] József, B. and Blaga, P. (2017) Optimizing Production Costs with the Correct Set-ting of the Paint Thickness Parameters. Procedia Engineering, 181, 1021-1027. https://doi.org/10.1016/j.proeng.2017.02.502
[5] Pophaley, M. and Vyas, R.K. (2010) Plant Maintenance Management Practices in Automobile Industries: A Retrospective and Literature Review. Journal of Industrial Engineering and Management, 3, 512-541.
[6] Sarker, M.N.I. and Jie, Z. (2017) Social Security for Vulnerable Groups in Bangla-desh on Government Perspective : Contribution of Research Leader. Journal of Public Administration and Policy Research, 1, 1-9.
[7] Kamani, P., Noursadeghi, E., Afshar, A. and Towhidkhah, F. (2011) Automatic Paint Defect Detection and Classification of Car Body. 2011 7th Iran Conf Mach Vis Image Process MVIP.
[8] Sarker, M.N.I., Hossin, A., Yin, X. and Sarkar, M.K. (2018) One Belt One Road In-itiative of China: Implication for Future of Global Development. Modern Econom-ics, 9, 623-638. https://doi.org/10.4236/me.2018.94040
[9] Sarker, M.N.I., Hossin, M.A., Hua, Y.X., et al. (2018) Low Carbon City Develop-ment in China in the Context of New Type of Urbanization. Low Carbon Economy, 9, 45-61. https://doi.org/10.4236/lce.2018.91004
[10] Haider, M.K., Islam, M.S., Islam, S.S. and Sarker, M.N.I. (2015) Determination of Crop Coefficient for Transplanted Aman Rice. International Journal of Natural and Social Sciences, 2, 34-40.
[11] Yeh, T.M. and Chen, L.Y. (2014) Fuzzy-Based Risk Priority Number in FMEA for Semiconductor wafer Processes. International Journal of Production Research, 52, 539-549. https://doi.org/10.1080/00207543.2013.837984
DOI: 10.4236/mme.2018.82011 176 Modern Mechanical Engineering https://doi.org/10.1109/TASE.2009.2033568
[13] Judi, H.M., Jenal, R. and Genasan, D. (2011) Quality Control Implementation in Manufacturing Companies: Motivating Factors and Challenges. In: Ivanov, O., Ed., Applications and Experiences of Quality Control, InTech Europe University Cam-pus, Rijeka, 495-508.
[14] Li, J., Blumenfeld, D.E. and Marin, S.P. (2007) Manufacturing System Design to Improve Quality Buy Rate: An Automotive Paint Shop Application Study. IEEE Transactions on Automation Science and Engineering, 4, 75-79.
https://doi.org/10.1109/TASE.2006.872958
[15] Arabian-Hoseynabadi, H., Oraee, H. and Tavner, P.J. (2010) Failure Modes and Ef-fects Analysis (FMEA) for Wind Turbines. International Journal of Electrical Power & Energy Systems, 32, 817-824. https://doi.org/10.1016/j.ijepes.2010.01.019
[16] Sarker, N.I., Hossin, A., Hua, Y., et al. (2018) Oil, Gas and Energy Business under One Belt One Road Strategic Context. Open Journal of Social Sciences, 6, 119-134. https://doi.org/10.4236/jss.2018.64011
[17] Bharatbhai, M.G. (2015) Failure Mode and Effect Analysis of Repower 5M Wind Turbine. International Journal of Advanced Research in Science, Engineering and Technology, 2, 2394-2444.
[18] Darrall, K.G., Pindar, A., Quevauviller, P. and Interlaboratory, P. (1997) Collabora-tive Study for the Quality Control of Trace Element Determinations in Paint Coat-ings. Fresenius’ Journal of Analytical Chemistry, 357, 833-836.
https://doi.org/10.1007/s002160050258
[19] Simões, D., Daniluk Mosquera, G.A., Batistela, G.C., et al. (2016) Quantitative Analysis of Uncertainty in Financial Risk Assessment of Road Transportation of Wood in Uruguay. Forests, 7, 1-11. https://doi.org/10.3390/f7070130
[20] Mcintee, E. (2008) Forensic Analysis of Automobile Paints by Atomic and Molecu-lar Spectroscopic Methods and Statistical Data Analyses.
[21] Sarker, M.N.I. (2017) Smart City for Smart Citizen: Dimensions, Challenges and Opportunities for Developing Country. 5th Smart Cities Conference, Bucharest, 38. [22] Bookbinder, J.H. (2015) Dynamic Control Rules for Conveyor Intersections in a
Truck-Assembly Paint Shop. The International Journal of Advanced Manufacturing Technology, 76, 1515-1527. https://doi.org/10.1007/s00170-014-6235-3
[23] Salihoglu, G. and Salihoglu, N.K. (2016) A Review on Paint Sludge from Automo-tive Industries: Generation, Characteristics and Management. Journal of Environ-mental Management, 169, 223-235. https://doi.org/10.1016/j.jenvman.2015.12.039 [24] Ju, F., Li, J., Xiao, G. and Arinez, J. (2013) Quality Flow Model in Automotive Paint
Shops. International Journal of Production Research, 51, 6470-6483. https://doi.org/10.1080/00207543.2013.824629
[25] Sarker, M.N.I., Bingxin, Y., Sultana, A. and Prodhan, A.S. (2017) Problems and Challenges of Public Administration in Bangladesh: Pathway to Sustainable Devel-opment. International Journal of Public Policy and Administration Research, 3, 16-25.
[26] Jones, K., Cocker, J. and Piney, M. (2013) Isocyanate Exposure Control in Motor Vehicle Paint Spraying: Evidence from Biological Monitoring. Annals of Occupa-tional Hygiene, 57, 200-209.
DOI: 10.4236/mme.2018.82011 177 Modern Mechanical Engineering [28] Quevauviller, P. (2001) Certified Reference Materials for the Quality Control of In-organic Analyses of Manufactured Products (Glass, Polymers, Paint Coatings). TrAC Trends in Analytical Chemistry, 20, 446-456.