ISSN Online: 2165-7416 ISSN Print: 2165-7408
DOI: 10.4236/ojoph.2018.82015 May 21, 2018 106 Open Journal of Ophthalmology
Optical Coherence Tomography Parameters in
Preperimetric Open-Angle Glaucoma
Snezhina Stefanova Kostianeva-Zhelinska,
Marieta Konareva-Kostianeva, Marin Atanassov
Department of Ophthalmology, Medical University Plovdiv, Plovdiv, Bulgaria
Abstract
Purpose: To evaluate the measurements of the peripapillary retinal neurofiber layers (RNFL) and the ganglion cells complex (GCC) obtained by Optical Co-herence Tomography (OCT) in eyes with preperimetric open-angle glaucoma. Methods: One hundred and forty eyes of 75 patients (21 male and 54 female), 80 eyes with preperimetric glaucoma (PPG) (45 patients) and 60 normal eyes (30 subjects) were included in this study. Automated visual field examination was done to all participants using Humphrey field analyzer, program 30-2. The GCC thickness and peripapillary RNFL thickness were measured using RTVue-100 (Optivue, Inc., Fremont, CA). The areas under ROC (receiver op-erating characteristic)—curves (AUCs) were defined for all examined GCC and RNFL parameters. Results: GCC of the eyes with PPG was significantly thinner than GCC of the normal eyes: (89.58 vs 97.82 microns, P < 0.001). There was no significant difference between upper and lower GCC halves in both study groups. We found a reduction of RNFL thickness in glaucomatous eyes (P < 0.001) compared with normals. AUCs for GCC parameters in eyes with PPG were larger than AUCs for RNFL parameters. Conclusion: Our study showed that the peripapillary RNFL and GCC thickness are lower in preperimetric glaucoma than in normal eyes. Despite the fact that GCC mea-surements (especially GLV) show better AUC than peripapillary measure-ments, we suggest that two scans (GCC and ONH) put together are superior in detecting early structural glaucomatous damage. Several diagnostic para-meters should be considered in the clinical diagnosis of preperimetric glau-coma.
Keywords
Optical Coherence Tomography, Preperimetric Glaucoma, Retinal Nerve Fiber Layer, Ganglion Cell Complex
How to cite this paper: Kostiane-va-Zhelinska, S.S., Konareva-Kostianeva, M. and Atanassov, M. (2018) Optical Co-herence Tomography Parameters in Prepe-rimetric Open-Angle Glaucoma. Open Journal of Ophthalmology, 8, 106-119. https://doi.org/10.4236/ojoph.2018.82015
Received: April 13, 2018 Accepted: May 18, 2018 Published: May 21, 2018
Copyright © 2018 by authors and Scientific Research Publishing Inc. This work is licensed under the Creative Commons Attribution-NonCommercial International License (CC BY-NC 4.0). http://creativecommons.org/licenses/by-nc/4.0/
DOI: 10.4236/ojoph.2018.82015 107 Open Journal of Ophthalmolog
1. Introduction
Open-angle glaucoma is defined as a “multifactorial optic neuropathy with an acquired atrophy of the optic nerve and loss of retinal ganglion cells and their axons, developing in the presence of open anterior chamber angles, and mani-festing characteristic visual field abnormalities” [1].
The progressive loss of retinal ganglion cells and thinning of the neuroretinal rim and the retinal nerve fiber layer (RNFL) correspond with deterioration of the visual field [2] [3] [4]. Clinical studies have provided evidence that the structural damage in glaucoma precedes the functional change, a condition that has been termed pre-perimetric glaucoma. The idea of this concept is that the eye has a functional reserve whereby early structural damage does not directly lead to functional damage. This hypothesis is mainly based on the observation that, in early stages of the disease, the structural damage predominates, whereas in the later stages, functional damage predominates. The lack of sensitivity of visual field testing is due to physiological redundancy in retinal ganglion cell re-ceptive fields. It is well known that patients with glaucoma can suffer a 20% to 50% loss of retinal ganglion cells before a defect becomes evident in standard pe-rimetry [5][6]. The atrophy of the RNFL [7], which is an early sign of glauco-matous damage of the retinal ganglion cells and their axons, is often left unde-tected by ophthalmoscopy and photography of the optic disc and the RNFL. In the last decade spectral-domain optical coherence tomography (SD-OCT) has been widely used to detect structural glaucoma changes [8][9] [10] [11] [12]. Although the diagnostic accuracy of SD-OCT is satisfactory in moderate and advanced glaucoma, its accuracy in early and preperimetric glaucoma has still not met the clinical needs. Circumpapillary RNFL thickness and macular gan-glion cell complex thickness have been successfully used for diagnostic and fol-low-up purposes. At present, there is no consensus on which is the best structure parameter for early glaucoma diagnosis, and it is still unknown whether one or several of these diagnostic parameters should be used in the clinical diagnosis of early glaucoma [13].
2. Aim
To evaluate the measurements of the peripappilary retinal neurofiber layers (RNFL) and the ganglion cells complex (GCC) obtained by Optical Coherence Tomography (OCT) in eyes with preperimetric open-angle glaucoma.
Materials and Methods
The study included 80 eyes with preperimetric glaucoma (PPG) of 45 patients and 60 normal eyes of 30 controls (total 140 eyes of 75 participants). Women predominated in both examined groups.
DOI: 10.4236/ojoph.2018.82015 108 Open Journal of Ophthalmolog with suspicious glaucomatous appearance of the optic disc and increased intra-ocular pressure but without perimetric changes.
[image:3.595.208.540.599.727.2]The analyzed healthy eyes belonged to 30 individuals, age and gender match-ing the glaucoma patients.
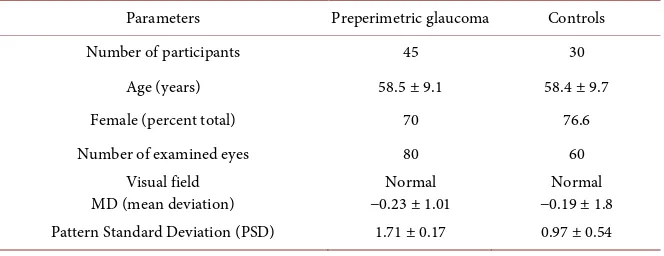
Table 1 presents demographics of the study groups.
The inclusion criteria for preperimetric glaucoma patients were by ophthal-moscopy apparent enlarged cupping (C/D > 0.6), neuroretinal rim thining (dif-fuse or localized) and/or dif(dif-fuse or localized peripappilary RNFL thinning. They had reliable and reproducible normal visual field with mean deviation (MD) less than 2 dB.
The inclusion criteria for the healthy subjects were: normal ONH (C/D < 0.6), reliable normal visual field tests with normal MD less than 2 dB and intraocular pressure consistently below 21 mmHg.
Subjects with coexisting retinal diseases, uveitis or non-glaucomatous optic disc neuropathy were excluded.
Each subject underwent a ophthalmic examination including review of medi-cal history best corrected visual acuity, slit lamp biomicroscopy, intraocular pressure measurements using Goldmann applanation tonometry, gonioscopy, fundoscopy examination with 90-diopters lens and standard automated perime-try with Humphrey Field analyzer, 30-2 Swedish Interactive Treshold Algorithm (Carl Zeiss Meditec, Dublin, CA). The visual field test was considered reliable when fixation losses were less than 20% and false positive and false negative er-rors were less than 15%.
Within six months the eyes were tested by SD-OCT. We used RTVue-100 (software version: 4.0.5.39, Optovue). The peripapillary RNFL and, GCC were analyzed.
RNFL thickness was calculated using two programmes: ONH mode and 3.45 mode. In the programme ONH mode RNFL thickness was recalculated from the “en face” imaging obtained by six circular and 12 linear incoming measure-ments. From this program we analyzed the following parameters: the average thickness of the peripapillary RNFL (RNFL1 Ave), the RNFL thickness of the upper half (RNFL1 Sup) and the RNFL thickness of the lower half (RNFL1 Inf). We also compared six (from all 16) separate temporal RNFL sectors: ST2
Table 1. Demographics of the study groups.
Parameters Preperimetric glaucoma Controls
Number of participants 45 30
Age (years) 58.5 ± 9.1 58.4 ± 9.7
Female (percent total) 70 76.6
Number of examined eyes 80 60
Visual field
MD (mean deviation) −0.23 ± 1.01 Normal −0.19 ± 1.8 Normal
DOI: 10.4236/ojoph.2018.82015 109 Open Journal of Ophthalmolog (supero-temporal), TU2 and TU1 (temporal upper), TL1 and TL2 (temporal lower), IT2 (infero-temporal).
The RNFL thickness on program “3.45 mode” (RNFL2) was measured along a circle with a diameter of 3.45 mm around the optic disc. The following parame-ters from this programme were selected for the statistical analysis: average thickness (RNFL2 Overall), the RNFL thickness of the upper half (RNFL2 Sup), the RNFL thickness of the lower half (RNFL2 Inf) and the RNFL thickness of the four quadrants—temporal, superior, nasal and lower (RNFL2 temporal drant, RNFL2 superior quadrant, RNFL2 nasal quadrant, RNFL2 inferior qua-drant).
The GCC scan was centered 1 mm temporal from the fovea and covered a 7/7 mm square grid of the central macula. The GCC thickness was measured from the internal limiting membrane to the outer inner plexiform layer boundary. The average GCC thickness (GCC Ave), the average thickness of the upper GCC (GCC Sup) and the average thickness of the lower GCC (Inf GCC) were calcu-lated. Two other diagnostic GCC parameter—focal loss volume (FLV) and glob-al loss volume (GLV) were anglob-alyzed too. GLV and FLV are pattern-based para-meters that reflect different aspects of losses in the GCC. They summarize the volume of the losses in the inner macula with different focus levels [14]. FLV represents the integral of the deviation in areas with significant focal losses. GLV is calculated as the sum of negative deviations in the whole area.
We excluded the images with a signal strength index (SSI) less than 35. Meas-ured data were excluded when they were not compliant with the algorithm of the detection surface or when there was decentration of the circular area.
Receiver operating characteristic (ROC) curves were used to assess the diag-nostic ability of RNFL and GCC parameters to detect structures with glauco-matous changes.
An area under the ROC curve of 1.0 represented perfect discrimination, whe-reas an AUC of 0.5 represented discrimination that is no better than the results obtained by chance. All statistical analyses were performed using SPSS for Win-dows (v. 22.0.0, SPSS Inc, Chicago, IL). P < 0.05 was considered statistically sig-nificant.
3. Results
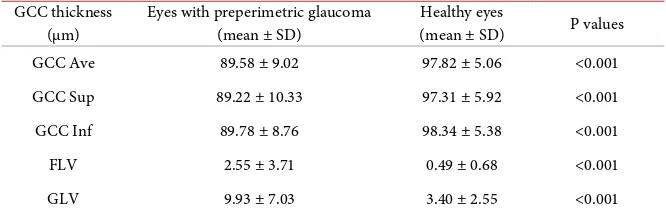
Table 2 presents the average GCC thickness (GCC Ave), the average thickness of the upper GCC (GCC Sup) and the average thickness of the lower GCC (Inf GCC), FLV and GVL in both groups.
The GCC parameters differed significantly between the groups (P < 0.001), showing decreasing GCC thickness in the preperimetric eyes. There was no sta-tistically significant difference among GCC parameters within groups.
DOI: 10.4236/ojoph.2018.82015 110 Open Journal of Ophthalmolog Table 2. GCC parameters in preperimetric and healthy eyes.
GCC thickness
(µm) Eyes with preperimetric glaucoma (mean ± SD) Healthy eyes (mean ± SD) P values
GCC Ave 89.58 ± 9.02 97.82 ± 5.06 <0.001
GCC Sup 89.22 ± 10.33 97.31 ± 5.92 <0.001
GCC Inf 89.78 ± 8.76 98.34 ± 5.38 <0.001
FLV 2.55 ± 3.71 0.49 ± 0.68 <0.001
[image:5.595.206.538.233.312.2]GLV 9.93 ± 7.03 3.40 ± 2.55 <0.001
Table 3. RNFL parameters by program ONH in preperimetric and healthy eyes.
RNFL thickness
(µm) Eyes with preperimetric glaucoma (mean ± SD) (mean ± SD) Healthy eyes P values
RNFL1 Ave 101.03 ± 11.67 110.57 ± 7.88 <0.001
RNFL1 Sup 101.92 ± 12.86 111.48 ± 9.78 <0.001
RNFL1 Inf 100.24 ± 12.70 109.45 ± 9.68 <0.001
Significant differences between examined groups were found in RNFL1 Ave, RNFL1 Sup and RNFL1 Inf (P < 0.001).
The thickness of temporal RNFL sectors was analysed in ONH mode. The mean values and a comparison of the RNFL temporal sectors in both groups are presented in Table 4.
The RNFL sectors ST2, TU2 (supero-temporal), IT2 (infero-temporal) were significantly thinner in the preperimetric glaucomatous eyes than in the healthy eyes.
The peripapillary RNFL measurements obtained in 3.45 scanning mode are presented in Table 5. They include RNFL2, overall (whole circumference ness), RNFL2 Sup (the upper half thickness), RNFL2 Inf (the lower half thick-ness) and RNFL thickness of four quadrants (temporal, superior, nasal, inferior). There were significant differences between the groups in all analyzed parame-ters of 3.45 mode except in RNFL thickness of nasal quadrant (P = 0102).
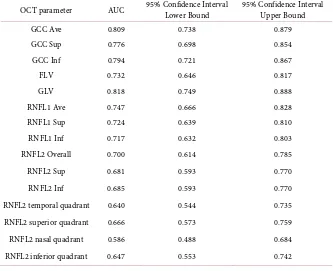
Areas under the curves (AUCs) were generated for the examined OCT para-meters and calculated by ROC curve analysis. They are presented in Table 6.
GLV, GCC Ave, GCC inf and GCC Sup have shown the best AUC’s.
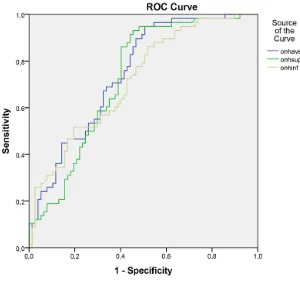
The ROC curves for GCC Ave, GCC Sup and GCC inf are shown in Figure 1. The AUCs for the RNFL thickness obtained in ONH mode were better than those obtained in 3.45 mode (see Table 6) therefore the ONH mode is more re-liable in distinguishing preperimetric from normal eyes.
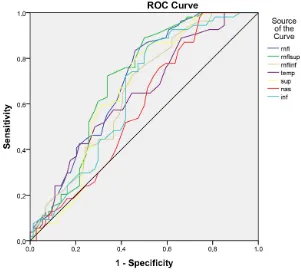
Figure 2 shows the ROC curves and AUC’s of RNFL measurements in ONH mode.
DOI: 10.4236/ojoph.2018.82015 111 Open Journal of Ophthalmolog Table 4. Mean values and comparison of the RNFL temporal sectors in preperimetric eyes.
RNFL thickness
(µm) Eyes with preperimetric glaucoma (1) (mean ± SD) Healthy eyes (2) (mean ± SD) P values (1 vs 2)
ST2 127.99 ± 20.40 141.83 ± 21.77 <0.001
TU2 88.06 ± 15.60 100.71 ± 13.39 <0.001
TU1 72.39 ± 14.15 76.84 ± 11.55 0.053
TL1 68.48 ± 14.80 68.45 ± 13.67 0.990
TL2 82.96 ± 15.29 87.59 ± 14.14 0.075
[image:6.595.209.540.276.421.2]IT2 130.05 ± 21.95 139.78 ± 19.85 0.009
Table 5. Mean values and comparison of the RNFL parameters in 3.45 scanning mode in preperimetric and healthy eyes.
RNFL thickness (µm)
(3.45 scanning mode) glaucoma (1) (mean ± SD) Eyes with preperimetric Healthy eyes (2) (mean ± SD) P values (1 vs 2)
RNFL2 Overall 99.51 ± 11.72 107.20 ± 7.90 <0.001
RNFL2 Sup 100.62 ± 14.48 108.12 ± 8.85 0.001
RNFL2 Inf 98.47 ± 12.52 106.38 ± 9.49 0.001
RNFL2 temporal quadrant 78.11 ± 12.17 84.20 ± 11.15 0.004
RNFL2 superior quadrant 120.39 ± 21.78 130.96 ± 13.76 0.002
RNFL2 nasal quadrant 72.93 ± 13.71 76.48 ± 9.29 0.102
RNFL2 inferior quadrant 125.57 ± 19.64 135.70 ± 14.12 0.002
Table 6. AUC and confidence interval for examined OCT parameters.
OCT parameter AUC 95% Confidence Interval Lower Bound 95% Confidence Interval Upper Bound
GCC Ave 0.809 0.738 0.879
GCC Sup 0.776 0.698 0.854
GCC Inf 0.794 0.721 0.867
FLV 0.732 0.646 0.817
GLV 0.818 0.749 0.888
RNFL1 Ave 0.747 0.666 0.828
RNFL1 Sup 0.724 0.639 0.810
RNFL1 Inf 0.717 0.632 0.803
RNFL2 Overall 0.700 0.614 0.785
RNFL2 Sup 0.681 0.593 0.770
RNFL2 Inf 0.685 0.593 0.770
RNFL2 temporal quadrant 0.640 0.544 0.735
RNFL2 superior quadrant 0.666 0.573 0.759
RNFL2 nasal quadrant 0.586 0.488 0.684
[image:6.595.206.539.457.728.2]DOI: 10.4236/ojoph.2018.82015 112 Open Journal of Ophthalmolog Figure 1. ROC curves for GCC Ave, GCC Sup and GCC inf.
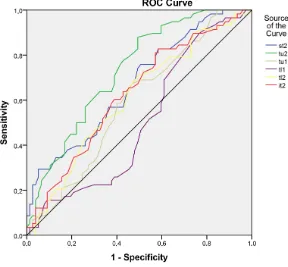
[image:7.595.222.522.410.692.2]DOI: 10.4236/ojoph.2018.82015 113 Open Journal of Ophthalmolog Figure 3. ROC curves and AUC’s of RNFL parameters obtained in the 3.45 mode.
The RNFL analysis of the temporal sectors has shown that all of sectors except TL1 had a good AUC (especially supero-temporal sectors ST 2 and TU2) and could discriminate between the preperimetric glaucomatous eyes and healthy eyes. Figure 4 and Table 7 present the ROC curves and AUC’s of the analyzed RNFL temporal sectors.
OCT changes were detected in 29 eyes with preperimetric glaucoma (36.3%). Based on the expert system of RTVue, we did not observe deviations from the norm in the rest 51 eyes (63.7%). Twenty five eyes showed pathological changes only in GCC. The most often observed alteration was in GLV (in 10 eyes). Ab-normal changes in both RNFL and GCC were found in 3 eyes. Changes only in RNFL were observed in one eye with preperimetric glaucoma.
4. Discussion
To prevent glaucomatous damage, it is important to detect changes of the retinal ganglion cells and their nerve fiber layers as early as possible.
Recently, increased attention has been directed toward the macular region for evaluation of glaucomatous damage. As a large proportion of total macular thickness is composed of RNFL and ganglion cell bodies, this region is an attrac-tive area for identifying structural damage from glaucoma disease [15].
DOI: 10.4236/ojoph.2018.82015 114 Open Journal of Ophthalmolog Figure 4. ROC curves and AUC’s of analyzed RNFL temporal sectors.
Table 7. Areas under the curves of the analyzed RNFL temporal sectors.
Test Result Variable(s) Area
st2 0.668
tu2 0.732
tu1 0.590
tl1 0.502
tl2 0.608
it2 0.627
[image:9.595.208.539.411.532.2]con-DOI: 10.4236/ojoph.2018.82015 115 Open Journal of Ophthalmolog firmed by a great number of authors [24][25][26][27]. The thinning of GCC is due to death of the ganglion cells from glaucoma, so GCC is an ideal site for im-aging and detecting glaucoma process [28] [29] [30]. The global loss volume (GLV) had the largest AUC (0.818), and this is observed by other authors as well [19][31]. We found that the diagnostic value of the mean GCC thickness (AUC = 0.809) was greater than that of the mean RNFL thickness (AUC = 0.747) so the mean GCC thickness appeared to be a better predictor of early glaucoma than the mean RNFL thickness, regardless of the fact that the difference was not sig-nificant. This finding may be explained, in part, by GCC being a more direct measure of RGC integrity. Macular GCC parameters have a theoretical advan-tage over peripapillary RNFL parameters in diagnosis, because RGC loss occurs early in the pathogenesis of glaucoma. Furthermore, early RGC loss typically gives rise to isolated damage in the paracentral areas (10˚ - 20˚). The inferior and/or superior RNFL areas are the specific glaucomatous sites for early glau-comatous damage [32]. RNFL thinning at the typical locations may be a predic-tor of a development of glaucomatous visual field damage in glaucoma-suspect eyes [33]. R. Lisboa et al.[34] has determined that the parameter with the largest AUC obtained with the Spectralis SD OCT is the temporal superior RNFL thickness (0.88 ± 0.03), followed by global RNFL thickness (0.86 ± 0.03) and temporal inferior RNFL thickness (0.81 ± 0.04). The RNFL sectors analysis pro-vides a quantitative assessment of these locations and helps us to distinguish preperimetric glaucoma. We found that the peripapillary RNFL thickness of su-pero-temporal and infero-temporal sectors (in ONH mode) were significantly thinner compared with healthy eyes. In general, the RNFL parameters with best diagnostic accuracy have been the average peripapillary RNFL thickness and thicknesses in the inferior and superior quadrants [35][36][37][38] [39]. Our results have shown that RNFL thickness (average, superior half, inferior half) differs significantly between eyes with preperimetric glaucoma and healthy eyes. The pattern of RNFL thickness loss at the typical glaucomatous sites was found to reflect glaucoma, including its preperimetric stage.
5. Conclusions
Our study showed that the peripapillary RNFL and GCC thickness are lower in preperimetric glaucoma than in normal eyes. Despite the fact that GCC mea-surements (especially GLV) show better AUC than peripapillary meamea-surements, we suggest that two scans (GCC and ONH) put together are superior in detect-ing early structural glaucomatous damage.
Several diagnostic parameters should be considered in the clinical diagnosis of preperimetric glaucoma.
References
DOI: 10.4236/ojoph.2018.82015 116 Open Journal of Ophthalmolog
[2] Quigley, H.A., Dunkelberger, G.R. and Green, W.R. (1989) Retinal Ganglion Cell Atrophy Correlated with Automated Perimetry in Human Eyes with Glaucoma.
American Journal of Ophthalmology, 107, 453-464.
https://doi.org/10.1016/0002-9394(89)90488-1
[3] Hood, D.C., Raza, A.S., de Moraes, C.G., Liebmann, J.M. and Ritch, R. (2013) Glaucomatous Damage of the Macula. Progress in Retinal and Eye Research, 32, 1-21. https://doi.org/10.1016/j.preteyeres.2012.08.003
[4] Na, J.H., Kook, M.S., Lee, Y. and Baek, S. (2012) Structure-Function Relationship of the Macular Visual Field Sensitivity and the Ganglion Cell Complex Thickness in Glaucoma. Investigative Ophthalmology & Visual Science, 53, 5044-5051.
https://doi.org/10.1167/iovs.11-9401
[5] Kerrigan-Baumrind, L.A., Quigley, H.A., Pease, M.E., Kerrigan, D.F. and Mitchell, R.S. (2000) Number of Ganglion Cells in Glaucoma Eyes Compared with Threshold Visual Field Tests in the Same Persons. Investigative Ophthalmology & Visual Science, 41, 741-748.
[6] Quigley, H.A., Addicks, E.M. and Green, W.R. (1982) Optic Nerve Damage in Hu-man Glaucoma. III. Quantitative Correlation of Nerve Fiber Loss and Visual Field Defect in Glaucoma, Ischemic Neuropathy, Papilledema and Toxic Neuropathy.
Archives of Ophthalmology, 100, 135-146.
https://doi.org/10.1001/archopht.1982.01030030137016
[7] Mwanza, J.C., Durbin, M.K., Budenz, D.L., et al. (2012) Glaucoma Diagnostic Ac-curacy of Ganglion Cell-Inner Plexiform Layer Thickness: Comparison with Nerve Fiber Layer and Optic Nerve Head. Ophthalmology, 119, 1151-1158.
https://doi.org/10.1016/j.ophtha.2011.12.014
[8] Kim, N.R., Lee, E.S., Seong, G.J., Choi, E.H., Hong, S. and Kim, C.Y. (2010) Spec-tral-Domain Optical Coherence Tomography for Detection of Localized Retinal Nerve Fiber Layer Defects in Patients with Open-Angle Glaucoma. Archives of Ophthalmology, 128, 1121-1128. https://doi.org/10.1001/archophthalmol.2010.204
[9] Leite, M.T., Rao, H.L., Zangwill, L.M., Weinreb, R.N. and Medeiros, F.A. (2011) Comparison of the Diagnostic Accuracies of the Spectralis, Cirrus, and RTVue Optical Coherence Tomography Devices in Glaucoma. Ophthalmology, 118, 1334-1339. https://doi.org/10.1016/j.ophtha.2010.11.029
[10] Kim, N.R., Lee, E.S., Seong, G.J., Kang, S.Y., Kim, J.H., Hong, S., et al. (2011) Com-paring the Ganglion Cell Complex and Retinal Nerve Fibre Layer Measurements by Fourier Domain OCT to Detect Glaucoma in High Myopia. The British Journal of Ophthalmology, 95, 1115-1121. https://doi.org/10.1136/bjo.2010.182493
[11] Seong, M., Sung, K.R., Choi, E.H., Kang, S.Y., Cho, J.W., Um, T.W., et al. (2010) Macular and Peripapillary Retinal Nerve Fiber Layer Measurements by Spectral Domain Optical Coherence Tomography in Normal-Tension Glaucoma. Investiga-tive Ophthalmology & Visual Science, 51, 1446-1452.
https://doi.org/10.1167/iovs.09-4258
[12] Oddone, F., Lucenteforte, E., Michelessi, M., Rizzo, S., Donati, S., Parravano, M., et al. (2016) Macular Versus Retinal Nerve Fiber Layer Parameters for Diagnosing Manifest Glaucoma: A Systematic Review of Diagnostic Accuracy Studies. Oph-thalmology, 123, 939-949. https://doi.org/10.1016/j.ophtha.2015.12.041
DOI: 10.4236/ojoph.2018.82015 117 Open Journal of Ophthalmolog https://doi.org/10.2147/OPTH.S20249
[14] Tan, O., Chopra, V., Lu, A.T., et al. (2009) Detection of Macular Ganglion Cell Loss in Glaucoma by Fourier-Domain Optical Coherence Tomography. Ophthalmology, 116, 2305-2314, e1-e2.
[15] Grewal, D.S. and Tanna, A.P. (2013) Diagnosis of Glaucoma and Detection of Glaucoma Progression Using Spectral Domain Optical Coherence Tomography.
Current Opinion in Ophthalmology, 24, 150-161.
https://doi.org/10.1097/ICU.0b013e32835d9e27
[16] Curcio, C.A. and Allen, K.A. (1990) Topography of Ganglion Cells in Human Reti-na. Journal of Comparative Neurology, 300, 5-25.
https://doi.org/10.1002/cne.903000103
[17] Arintawati, P., Sone, T., Akita, T., Tanaka, J. and Kiuchi, Y. (2013) The Applicabili-ty of Ganglion Cell Complex Parameters Determined from SD-OCT Images to Detect Glaucomatous Eyes. Journal of Glaucoma, 22, 713-718.
https://doi.org/10.1097/IJG.0b013e318259b2e1
[18] Zhang, C., Tatham, A.J., Weinreb, R.N., et al. (2014) Relationship between Ganglion Cell Layer Thickness and Estimated Retinal Ganglion Cell Counts in the Glauco-matous Macula. Ophthalmology, 121, 2371-2379.
https://doi.org/10.1016/j.ophtha.2014.06.047
[19] Kim, N.R., Lee, E.S., Seong, G.J., Kim, J.H., An, H.G. and Kim, C.Y. (2010) Struc-ture-Function Relationship and Diagnostic Value of Macular Ganglion Cell Com-plex Measurement Using Fourier-Domain OCT in Glaucoma. Investigative Oph-thalmology & Visual Science, 51, 4646-4651. https://doi.org/10.1167/iovs.09-5053
[20] Mansouri, K., Leite, M.T., Medeiros, F.A., Leung, C.K. and Weinreb, R.N. (2011) Assessment of Rates of Structural Change in Glaucoma Using Imaging Technolo-gies. Eye, 25, 269-277.https://doi.org/10.1038/eye.2010.202
[21] Sung, K.R., Wollstein, G., Kim, N.R., et al. (2012) Macular Assessment Using Opti-cal Coherence Tomography for Glaucoma Diagnosis. British Journal of Ophthal-mology, 96, 1452-1455.https://doi.org/10.1136/bjophthalmol-2012-301845
[22] Mwanza, J.C., Oakley, J.D., Budenz, D.L. and Anderson, D.R. (2011) Cirrus Optical Coherence Tomography Normative Database Study Group. Ability of Cirrus HD-OCT Optic Nerve Head Parameters to Discriminate Normal from Glaucomat-ous Eyes. Ophthalmology, 118, 241-248.
https://doi.org/10.1016/j.ophtha.2010.06.036
[23] Sung, K.R., Na, J.H. and Lee, Y. (2012) Glaucoma Diagnostic Capabilities of Optic Nerve Head Parameters as Determined by Cirrus HD Optical Coherence Tomo-graphy. Journal of Glaucoma, 21, 498-504.
https://doi.org/10.1097/IJG.0b013e318220dbb7
[24] Na, J.H., Lee, K., Lee, J.R., Baek, S., Yoo, S.J. and Kook, M.S. (2013) Detection of Macular Ganglion Cell Loss in Preperimetric Glaucoma Patients with Localized Re-tinal Nerve Fibre Defects by Spectral-Domain Optical Coherence Tomography.
Clinical & Experimental Ophthalmology, 41, 870-880. https://doi.org/10.1111/ceo.12142
[25] Bhagat, P.R., Deshpande, K.V. and Natu, B. (2014) Utility of Ganglion Cell Com-plex Analysis in Early Diagnosis and Monitoring of Glaucoma Using a Different Spectral Domain Optical Coherence Tomography. Journal of Current Glaucoma Practice, 8, 101-106. https://doi.org/10.5005/jp-journals-10008-1171
Mea-DOI: 10.4236/ojoph.2018.82015 118 Open Journal of Ophthalmolog
surements by Spectral Domain Optical Coherence Tomography for Detection of Early Glaucoma and Comparison to Retinal Nerve Fiber Layer Measurements.
American Journal of Ophthalmology, 156, 1297-1307. https://doi.org/10.1016/j.ajo.2013.08.001
[27] Jeoung, J.W., Choi, Y.J., Park, K.H., et al. (2013) Macular Ganglion Cell Imaging Study: Glaucoma Diagnostic Accuracy of Spectral-Domain Optical Coherence To-mography. Investigative Ophthalmology & Visual Science, 54, 4422-4429. https://doi.org/10.1167/iovs.12-11273
[28] Leung, C.K., Chan, W.M., Yung, W.H., Ng, A.C., Woo, J., Tsang, M.K. and Tse, R.K. (2005) Comparison of Macular and Peripapillary Measurements for the Detec-tion of Glaucoma: An Optical Coherence Study. Ophthalmology, 112, 391-400. https://doi.org/10.1016/j.ophtha.2004.10.020
[29] Glovinsky, Y., Quigley, H.A. and Pease, M.E. (1993) Foveal Ganglion Cell Loss Is Size Dependent in Experimental Glaucoma. Investigative Ophthalmology & Visual Science, 34, 395-400.
[30] Frishman, L.J., Shen, F.F. Du, L., Robson, J.G., Harwerth, R.S., Smith, E.L.3rd, Cart-er-Dawson, L. and Crawford, M.L. (1996) The Scotopic Electroretinogram of Ma-caque after Retinal Ganglion Cell Loss from Experimental Glaucoma. Investigative Ophthalmology & Visual Science, 37, 125-141.
[31] Sehi, M., Zhang, X., Greenfield, D.S., Chung, Y.S., Wollstein, G., Francis, B.A., Schuman, J.S., Varma, R. and Huang, D. (2013) Advanced Imaging for Glaucoma Study (AIGS) Group. Retinal Nerve Fiber Layer Atrophy Is Associated with Visual Field Loss over Time in Glaucoma Suspect and Glaucomatous Eyes. American Journal of Ophthalmology, 155, 73-82. https://doi.org/10.1016/j.ajo.2012.07.005
[32] Ophir, A. (2010) First-Visit Diagnosis of Preperimetric Glaucoma. The Open Oph-thalmology Journal, 4, 22-27.https://doi.org/10.2174/1874364101004010022
[33] Mohammadi, K., Bowd, C., Weinreb, R.N., Medeiros, F.A., Sample, P.A. and Zang-will, L.M. (2004) Retinal Nerve Fiber Layer Thickness Measurements with Scanning Laser Polarimetry Predict Glaucomatous Visual Field Loss. American Journal of Ophthalmologyogy, 138, 592-601.https://doi.org/10.1016/j.ajo.2004.05.072
[34] Lisboa, R., Leite, M.T., Zangwill, L.M., Tafreshi, A., Weinreb, R.N. and Medeiros, F.A. (2012) Diagnosing Preperimetric Glaucoma with Spectral Domain Optical Coherence Tomography. Ophthalmology, 119, 2261-2269.
https://doi.org/10.1016/j.ophtha.2012.06.009
[35] Park, S.B., Sung, K.R., Kang, S.Y., Kim, K.R. and Kook, M.S. (2009) Comparison of Glaucoma Diagnostic Capabilities of Cirrus HD and Stratus Optical Coherence Tomography. Archives of Ophthalmology, 127, 1603-1609.
https://doi.org/10.1001/archophthalmol.2009.296
[36] Kim, J.S., Ishikawa, H., Gabriele, M.L., et al. (2010) Retinal Nerve Fiber Layer Thickness Measurement Comparability between Time Domain Optical Coherence Tomography (OCT) and Spectral Domain OCT. Investigative Ophthalmology & Visual Science, 51, 896-902.https://doi.org/10.1167/iovs.09-4110
[37] Medeiros, F.A. (2010) Comparison of Different Spectral Domain Optical Coherence Tomography Scanning Areas for Glaucoma Diagnosis. Ophthalmology, 117, 1692-1699.https://doi.org/10.1016/j.ophtha.2010.01.031
[38] Leung, C.K., Lam, S., Weinreb, R.N., et al. (2010) Retinal Nerve Fiber Layer Imaging with Spectral-Domain Optical Coherence Tomography: Analysis of the Retinal Nerve Fiber Layer Map for Glaucoma Detection. Ophthalmology, 117, 1684-1691.
DOI: 10.4236/ojoph.2018.82015 119 Open Journal of Ophthalmolog