RESEARCH ARTICLE
THE SHEAR STRENGTH OF MASONRY WALLS REINFORCED WITH FRP COMPOSITES
*,1
Hisham Abdelfattah,
2Moetaz El-Hawary,
3Sameer Hamoush and
2Mohamed J. Terro
1
Department of Civil and Environmental Engineering, University of Sharjah, Sharjah, UAE
2Department Civil Engineering, Kuwait University, PO Box 5969, Safat 13060, Kuwait
3
Department Architectural Engineering, North Carolina A&T State University
ARTICLE INFO ABSTRACT
This paper evaluates the shear strength of masonry wall panels reinforced with FRP composite systems under plane loading conditions. An analytical model and experimental study were developed to predict the out-of-plane shear strength of the FRP reinforced masonry walls. The experimental study was performed on eighteen 1000×600×200 mm walls reinforced with FRP on one side while the model is based on the theories of elasticity and fracture mechanics. The presented study accounts for the shear contribution of the masonry units and the fiber overlays. The experimental program presented in this paper is used for validation of the analytical model. A parametric study is performed to evaluate the shear strength of the walls for various geometric properties of the fiber reinforcement. It was found that the shear strength of the retrofitted system is a function of the thickness of the FRP system used. As a result of this investigation, guidelines for selecting the thickness of the FRP retrofitting systems can be determined for any required shear strength.
Copyright, IJCR, 2013, Academic Journals. All rights reserved.
INTRODUCTION
Masonry walls, in general, suffer from a weakness in resistance to out-of-plane loads. During its lifetime, a masonry wall could be subjected to such loads under many circumstances including tornadoes and hazardous blasts. Several research studies have investigated the increase in the out-of-plane shear strength by the use of layers of Fiber Reinforced Polymer (FRP) composites to retrofit the inner face of masonry walls [1-8]. These studies indicated that the retrofitting composite systems contribute significantly to the shear strength of the masonry walls. A proper selection of the composite reinforcing system and adequate fiber orientation has also been shown to have an important effect on the amount of increase in the masonry out-of-plane strength [9-12].
Efforts to produce numerical and analytical models to quantify the shear strength of FRP reinforced masonry walls have been recorded in the literature [13-15]. However, available models are all based on the bond slip stresses at the interface between the FRP layer and masonry blocks. An analytical study of reinforced concrete beams indicated that its ultimate shear capacity consists of the contribution of the concrete strength and arresting force from the steel reinforcement [16]. This latter study employed a fracture mechanics approach in estimating the ultimate shear capacity of the concrete section. In the analytical model, the ultimate shear capacity of the FRP reinforced masonry walls is calculated using the theories of elasticity and fracture mechanics. The model considers the shear strength provided by the masonry units as well as that provided by the FRP systems. An experimental program was carried out to validate the developed analytical model. A parametric study on the geometric properties of the FRP layer was also performed to evaluate the ultimate shear capacity of the composite walls under out-of-plane loads for various geometric properties of the fiber reinforcement.
*Corresponding author:Hisham Abdelfattah
Department of Structural Engineering, University of Sharjah, Sharjah, UAE
Mathematical model
The ultimate out of plane shear strength of the masonry walls
reinforced with FRP systems (Vn) consists of two terms: The shear
strength of the masonry units (Vnm), and the shear strength due to the
contribution of the FRP system (Vnf), see Figure 1.
This can be expressed as
Vn = Vnm + Vnf (1)
The derivation of the two terms is explained in the following sections.
Contribution of masonry units to shear strength
The contribution of masonry units to the shear resistance (Vnm) has
already been established in the literature [17] as follows:
V
K BW
zF Q
a
nm
IC
3
1( )
(2)
Where,
KIC=Fracture toughness of the blocks.
B=Width of the wall. W= Depth of the wall.
z=Distance where the shear crack initiates, nearest mortar joint. a=Crack length. a is assumed to vary as the crack propagates. Q=a/W.
α=Crack angle to the longitudinal axis of the wall.
F Q Q Q Q Q
Q Q
1
2 1 5 1 99 1 2 15 3 93 2 7
1 2 1
( ) . ( )( . . . )
( )( ).
(3)
In this analysis the crack is assumed to propagate at the mortar joint
interface. Therefore, the angle α is considered to attain the value of
zero. Also, the crack initiation will occur at the mortar joint nearest to
ISSN: 0975-833X
International Journal of Current Research
Vol. 5, Issue, 07, pp.1802-1807, July,2013
INTERNATIONAL JOURNAL
OF CURRENT RESEARCH
Article History:
Received 23rd
April, 2013 Received in revised form 05th
May, 2013 Accepted 20th
June, 2013 Published online 18th
July, 2013
Key words:
the support. This assumption will lead to an exact predetermined value for the variable z in equation (2). Based on above assumptions, it can be noted that the masonry contribution to the shear strength becomes a function of only one variable “a” the crack length along the mortar joint interface.
Figure 1. Layout of the loading condition, masonry wall, and the FRP plate
2.2 Contribution of FRP overlay to shear strength
The shear contribution of the FRP overlay (Vnf) is determined using
basic engineering principles followed by those of fracture mechanics at the onset of a cracking pattern. The FRP contribution to the shear strength as given by ref (12) is (see Figure 1):
V
F z
w
c
z
nfa
CK
( )
2
3 3
(4)
(4)
Where,
c=concrete cover = 0 zCK= z + (a-c)cot α
[image:2.612.65.292.442.496.2]F(z)= Normal force in the FRP. Calculation of F (z) is derived as follows: The calculation of the normal force F(z) is derived as stated by (Malek, Saadat Menesh and Ehsani 1998)[18] (see Figure 2).
Figure 2. Free body diagram of an infinitesimal segment of the FRP layer
From the equilibrium of an infinitesimal segment of the FRP, the interfacial shear stress between FRP (Plate) and masonry is given by:
( )
x
df x
( )
dx
t
p p
(5)
(5) Where,
fp(x)=Tensile stress in FRP overlays
t
p=Thickness of FRP overlayτ (x)=The interfacial shear stress
Furthermore, the above equation can be expanded into:
df x
dx
G
t
du
dy
dv
dx
p a
p
( )
(6)
(6) Where,
Ga=Shear modulus of the adhesive epoxy layer.
u & v= horizontal and vertical displacements in the adhesive layer, respectively.
x & y= Longitudinal and perpendicular dimensions, respectively.
Differentiation of the last equation results in the following expressions:
d f x
dx
G
t
d u
dy
d v
dx
p a
p 2
2
2
2 2
2
( )
(7)
And,
d v
dx
M
E I
m tr2
2
(8)
Where,
M =Moment
Em= Elastic modulus of masonry in tension
Itr=Moment of inertia of transformed section based on masonry.
d u
dy
t
a p m2
2
1
(
)
(9)
Where,
p&
m=Interfacial strains in the lower and upper faces of theadhesive epoxy layer assuming perfect bond at the interfaces ta=
Thickness of epoxy layer.
Substituting equations (8) and (9) into equation (7) results in the following expression:
d f x
dx
G
t
t
t
M
E I
p a
p p
a m
a m tr 2
2
( )
(
)
(10)
Since the term
M
E I
m tr is too small, relative to
p
a m
a
t
t
[15],it can be neglected. Therefore, equation (10) becomes:
d f x
dx
G f x
t t E
G f
x
t t E
p a p
p a p
a m
p a m 2
2
( )
( )
( )
(11)
Where,
Ep= Elastic modulus of the FRP
and fm(x)=Tensile stress at the outermost tensile end of the masonry
block. It is obtained assuming the composite masonry/FRP section is un-cracked under the applied loads.
Solving equation (11) for fp(x) gives:
(12)
With,
f x
p( )
C
1sinh(
Ax
)
C
1cosh(
Ax
)
b x
1 2
b x b
2 3
p p
p
m m
m
f x
E
and
f
x
E
( )
,
( )
A
G
t t
b
ya E
I E
b
yE
I E
a L
a
a p a
p
tr m
p
tr m
,
1
1,
2
(
2
1 1
2)
, and
a a p 1 3 1 2 1 1 m tr p 3
G
t
t
b
2
a
L
a
L
a
E
I
y
E
b
(13)
(13) Where,
y=Distance from the centroid of the transformed section to the extreme tensile face of the masonry block
and
L1= Distance from the support to the FRP layer
If the following change of variable is performed: x0 = L1 + x
The coefficients a1-3 can be found from the following moment
equation that considers uniformly applied loads:
M(x ) = a x + a x + a
0 1 0 22 0 3 (14)
(14) The boundary conditions for the system are:
fp(x) = 0 when x = 0
And
L
or
df
dx
s
p
Ls
0
Where,
Ls=Distance to point of zero shear, mesured from the plate end.
C b A AL b L b
A AL and C b
s s
s 1
3 1 2
2 3
2
sinh( )
cosh( ) , (15)
(15)
The study by Malek, Saadat Menesh and Ehsani (14) shows that:
C
1
b
3,
and C
2
b
3Substituting C1 and C2, of equation (15), in equation (12) gives:
( )
x
b
3A
cosh(
A x
)
b
3A
sinh(
A x
)
2
b x b
1
2 (16) (16)Equation (16) Calculates of the shear force at the fiber/concrete interface for a section defined by the distance z as shown in the figure below:
The normal force in the FRP layer at a distance z from the support can be expressed as:
F
x bdx
z L
( )
0
1
(17)
(17) Where,
b =Width of masonry wall
Substituting equation (16) into (17) gives:
F b b A A x b A A x b x b dx
z L
( cosh( ) sinh( ) )
3 3 2 1 2
0 1
(18) (18)
F
A b
f
3
1
e
A z L 1
b z
2(
L
1)
b z L
1(
1)
2
(19)
(19) Where,
z=Distance to the mortar joint.
L1= Distance from the support to the FRP layer.
Af =Transverse area of FRP
Equation (19) gives the normal force in the fiber layer expressed as a
function of L1 (the distance form the fiber end to the cracked section)
and the applied loads on the wall.
[image:3.612.323.534.119.256.2]To evaluate the shear strength of the composite system, equations (1), (2) and (4) will be implemented bearing in mind that F(z) is also a function of the applied shear on the wall.
Figure 3. Free Body Diagram of the interface between FRP and the masonry wall
Testing program
To validate the analytical model, presented in the previous sections, an experimental program has been carried out. Eighteen 1000×600×200 mm hollow concrete masonry walls were built in the laboratory. Nine walls were reinforced externally by one layer of glass fiber composites on the tension side of the wall and the remaining nine were reinforced with two layers of external glass fiber reinforcement. Three different fiber lengths were evaluated: L, L-d/2, and L-d, where L is the wall length and d is the depth of the wall (200 mm). Hollow- 200 mm concrete masonry units (complying with ASTM Specification C90) and type S mortar were used to form the walls.
MATERIALS
Nine batches of mortar type “S” were employed in the fabrication of the wall units. Three standard 50 mm cubes were cast from each of the batches and tested for their compression strength, as described in ASTM C 780. An average compressive strength of the mortar of 10.3 MPa was obtained.
Fibers and bonding adhesives
[image:3.612.342.523.672.729.2]Two fiber reinforcement areas were used in the testing program. The un-reinforced masonry walls were strengthened with a continuous WEB fabric (primary Glass fabric) overlay combined with Tyfo S Hi-Clear epoxy. The mechanical properties of the composite materials used are shown in Table 1. The WEB fibers were attached to the walls using Tyfo S epoxy resin. The Tyfo S epoxy resin consisted of two parts of Tyfo A and B. The two parts are mixed in a ratio of 100:42 by volume for the standard Tyfo S products. Before placing the wall specimens on the supports, the fabric overlay was trimmed with a grinder to ensure that a uniform distance was maintained from the fabric end to the supports. This trimming was conducted after the bonding epoxy had cured.
Table 1. Material properties of the fiber used in the experimental program
Composite Materials
WEB and Tyfo Hi-Clear Epoxy Ultimate Tension Strength 207 MPa
Table 2. Testing configurations of the eighteen masonry wall, where d represents the depth of the masonry wall
Set Wall specimens Number of FRP Layers
Distance from Support, L1
1 1, 2, 3 d/4
2 4, 5, 6 2 d/2
3 7, 8, 9 0
4 10, 11, 12 d/4
5 13, 14, 15 1 0
6 16, 17, 18 d/2
Test setup
Each of the wall specimens was tested in a simply supported beam configuration in an effort to evaluate the out of plane shear strength of the retrofitted masonry system. A clear span of 900 mm was used for all walls. Two point loads, spaced 225 mm from the supports and at 450 mm centers, were applied to the specimens through wood bearing strips until failure took place.
Test results
The readings and observations taken during the experimental program consisted of: Applied load-wall deformation relation, failure load, end slippage of the fibers, and modes of failure. Results of those readings/observations are presented and discussed in the following two sections.
Load deformation relationships
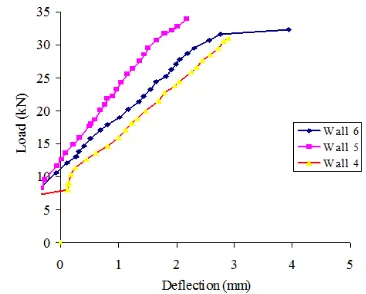
[image:4.612.62.295.78.152.2]The testing program evaluated six different configurations of wall specimens, each set consisting of 3 walls. These configurations are shown in table 2 above. The influence of the two experimental variables (reinforcement ratios and fiber length) on the wall failure loads and deformation are shown in Figures 4 to 9. The loads used in those figures represent the shear loads, which due to the configurations represent 50% of the applied total loads. Figure 4 shows the loads versus the deflection for specimens of Set 1. The load deflection is shown to be linear elastic up to failure, for all walls of Set 1. However, Wall 2 supported more loads than either Wall 1 or Wall 3. The average failure load for the three walls was 26.27 kN. It was noted that the amount of slippage at the fiber ends of the specimens was extremely small and it appears that almost a perfect bond existed between the fiber overlay and wall, for the stress levels evaluated. The load deflection curves shown in Figure 5 (Set 2) are shown to be linear elastic up to failure in walls 4 and 5. Wall 6 revealed more ductile behavior than either Wall 4 or Wall 5. The average failure load for the three walls was 26.46 kN.
Figure 4. Load Vs. Deflection of Specimens 1, 2, 3, for Two Layers With 812.8 x 609.6 x 0.36 mm Fiber Composites
The load deflection curves shown in Figure 6 (Set 3) exhibit non-linear behavior with a continuously reducing slope. The average failure load for the three walls was 23.62 kN. Figure 7 shows the load versus the deflection for the wall specimens of Set 4. The load
[image:4.612.324.545.230.364.2] [image:4.612.333.537.393.520.2]Figure 5. Load Vs. Deflection of Specimens 4, 5, 6, for Two Layers with 711.2 x 609.6 x 0.36 mm Fiber Composites
[image:4.612.67.296.534.656.2]Figure 6. Load Vs. Deflection of Specimens 7, 8, 9, for Two Layers With 914.4 x 609.6 x 0.36 mm Fiber Composites
Figure 7. Load Vs. Deflection of Specimens 10, 11, 12, for One Layer with812.8 x 609.6 x 0.36 mm Fiber Composites
Figure 8. Load Vs. Deflection of Specimens 13, 14, 15, for One Layer with 914.4 x 609.6 x 0.36 mm Fiber Composites
[image:4.612.330.537.555.703.2]Figure 9. Load Vs. Deflection of Specimen 16, 17, 18, for One Layer With 711.2 x609.6 x 0.36 mm Fiber Composites
deflection of this configuration is shown to be nonlinear elastic up to failure. Wall 11 supported more loads than either Walls 10 or 12, and the average failure load for the three walls was 24.4 kN. The load deflection curves in Figure 8 (Set 5) show the nonlinear elastic behavior of Walls 13, 14 and 15. Wall 13 revealed a more ductile behavior than either Wall 14 or Wall 15. The average failure load for the three walls was 25.3 kN. The load deflection curves in Figure 9 (Set 6) show that Walls 16, 17, and 18 exhibited essentially linear elastic behavior up to failure. The average failure load for the three walls was 26.26 kN.
Modes of failure
Table 3 summarizes the failure loads. It was noted during testing that three specimens failed in a typical diagonal shear failure and the remaining fifteen specimens failed by opening of the mortar joint in the shear area, followed by the formation of a diagonal shear crack that extended from the vertical joint to the point of the concentrated load. Final failure occurred when the block web crack met the interface between the fiber and the masonry blocks and then it propagated along the interface to the fiber composite end.
Validation of the mathematical model and discussions of results
The mathematical model was used to predict the ultimate shear load for the cases considered in the experimental program. A comparison between analytical and experimental results is presented in Table 4. The results in table 4, in general, show an increase in the average shear capacity with the increase of FRP area. This remark is particularly true when examining results obtained from the analytical model as the increase due to the use of two FRP layers compared to one layer is 22%.
Also shown in table 4 is a difference between experimental and analytical ranging from 1.1% to 18.3%. This is expected since the strength of masonry blocks joined by mortar is unpredictable due to the non-homogeneous nature of this composite material. It is also noted that, in general, less error between experimental and analytical data is observed when the thickness of FRP layer is doubled. This could be attributed to the higher contribution of FRP to the shear capacity, since FRP is more homogeneous and its properties more predictable than the masonry-mortar composite.
Table 4. Comparison between experimental and analytical shear capacity results. Where d represents the depth of the masonry wall
Number of FRP Layers
Distance from Support, L1
Experimental Pu (kN)
Analytical Pu (kN)
Difference as % of Experimental
0 25.2 21.9 13.3
1 d/4 24.3 21.9 10.0
d/2 26.2 21.4 18.3
0 23.6 27.6 17.0
2 d/4 26.2 26.5 1.1
d/2 26.4 25.4 3.8
[image:5.612.306.558.172.245.2]
Furthermore, a parametric analysis, using the analytical model, has been performed to study the effect of increasing the thickness of the FRP layer. The results of this analysis are shown in table 5.
Table 5. Parametric analytical shear capacity results, where d represents the depth of the masonry wall.
Number of FRP Layers Distance from Support, L1 Analytical Pu (kN)
0 36.3
3 d/4 35.9
d/2 35.1
0 38.3
5 d/4 37.8
d/2 37.3
0 42.6
10 d/4 42.2
d/2 41.7
[image:5.612.312.556.319.410.2]
Figures 10a and 10b show the effect of the distance of the FRP layer from the support and the number of FRP layers on the ultimate shear capacity of the composite masonry wall respectively. Data in these figures are based on results from the analytical model only. Figures 10a and 10b clearly show that the ultimate shear capacity increases with the increase in the number FRP layers. The distance of the FRP layer from the support, however, has a less significant effect on the shear capacity of the composite masonry walls. Using second order polynomial trend line, the ultimate shear for a wall with zero FRP layers may be estimated to be 16 kN. The approximate increase due to
Table 3. Experimental results from the masonry wall specimens
Specimen No. Number of
Reinforcement Layers
Distance from Supports (wall depth d = 193.7 mm)
Maximum Loads (kN) Average Deflection at max loads (mm)
Average Maximum Loads (kN)
1 2L d/4 66 2.5
2 2L d/4 51.1 2.1 52.4
3 2L d/4 40 1.7
4 2L d/2 50.2 3.3
5 2L d/2 55.8 2.7 52.8
6 2L d/2 53 4.5
7 2L 0 40.9 2.7
8 2L 0 46.5 3.2 47.1
9 2L 0 53.9 3.5
10 1L d/4 47.4 2.9
11 1L d/4 50.2 3.8 48.7
12 1L d/4 49.3 3.3
13 1L 0 45.6 4.0
14 1L 0 56.7 2.6 50.5
15 1L 0 50.2 3.1
16 1L d/2 52.1 2.7
17 1L d/2 58.6 3.2 52.4
[image:5.612.66.549.449.629.2]adding one or two layers of FRP will be 37% and 72.5%, respectively,
[image:6.612.66.298.83.232.2]for the case where L1 is zero.
Figure 10a. Effect of FRP distance from support on the ultimate shear load capacity. d represents the depth of the masonry wall.
Figure 10b. Effect of the number of FRP layers on the ultimate shear load capacity. d represents the depth of the masonry wall
Conclusions
The following conclusions could be drawn the analytical and experimental studies presented in this paper:
1. The experimental program, performed in this study, confirmed
that strengthening un-reinforced masonry walls by externally bonded composite overlays contributes to the out-of- plane ultimate shear capacity.
2. The developed analytical model combined the theory of fracture
mechanics within the blocks together with an bond slip approach at the interface of the composite material to approximately predict the average ultimate shear capacity of the FRP reinforced masonry walls.
3. The predictions from the analytical model compared favorably, in
general, to the results from the experimental program. In particular, the correlation was improved for the larger FRP thickness.
4. Adding more than one layer of FRP overlay increased the ultimate
shear capacity of the composite masonry wall significantly.
5. The findings of the performed parametric study on the thickness
and overlay distance of the FRP layer need to be confirmed by future experimental programs. Particularly, this parametric study showed a significant increase in the out-of-plane shear wall capacity with 3 to 10 layers of the FRP.
REFERENCES
1. S. Hamoush and M. McGinley, “Out of Plane Strengthening of
Masonry Walls by Reinforced Composite”, Final Report, No. 4-41156, North Carolina A&T State University, 1998.
2. M. R. Ehsani, H. Saadatmanesh and A. Al-Saidy, "Shear
Behavior of URM Retrofitted with FRP Overlays", Journal of
composite for Construction, Vol. 1, No. 1, 1997, 17-25.
3. O. Challal, M. J. Nollet. and D. perraton, "Shear Strengthening
of RC Beams by Externally Bonded side CFRP strips", Journal
of composites for construction, Vol. 2, No. 2, 1998.
4. Y. Mitsui, K. Murakami, K. Takeda and H. Sakai, "A study on
shear reinfrocement of reinforced concrete beams externally
bonded with carbon fiber sheets", Composite Interfaces, Vol. 5,
No. 4, 1998, 285-295.
5. K. O. So. and B. L. Karihaloo, "Shear capacity of Longitudinal
Reinforced Beams A Fracture Mechanic Approach", ACI
Structural Journal, No. 9, 1993, 591- 600.
6. K. Tan and M. Patoary, “Strengthening of Masonry Walls
against out-of-plane loads using Fiber-Reinforced Polymer
Reinforcement”, Journal of Composites for Construction, Vol.8,
No. 1,2004,79-87.
7. G. Tumialan, N. Galati and N. Nanni, “Fiber-Reinforced
Polymer Strengthening of Unreinforced Masonry Walla subject
to out-of-plane Loads”, ACI Structural Journal, Vol. 100, No. 5,
2003, 321-329.
8. M. ALBERT, a. Elwi and J. Cheng, “Strengthening of
Unreinforced Masonry Walls using FRPs”, Journal of
Composites for Construction, Vol. 5, No. 2, 2001, 139-145.
9. A. M. Malek and H. Saadatmanesh, "physical and mechanical
properties of Typical fibers and resins" proc., 1st conf. On composite for Infrastructure, Tucson, Ariz., 1996, 68-79.
10. H. Kolsch, “Carbon fiber Cement Matrix (CFCM) Overlay
System for Masonry Strengthening.” Journal of Composites for
Construction, Vol.2, No. 2, 1998, 105-109.
11. V. N. Kaliakin, M. J. Chajes and R. F. Januxaka, "Analysis of
concrete beams reinforced with externally bonded woven composite fabrics", Elsevier Science Limited printed in Great Britain, Composites part B 27B, 1996, 235-244.
12. N. F. Grace, A. K. Soliman., G. Abdel-Sayed and K. R. Saleh,
"Behavior and ductility of simple and continuous FRP
reinforced beams", Journal of composites for constructin, Vol.
2, No. 4, 1998, 186-194.
13. Y. J. Lee, T. E. Boothby, C. E. Bakis and A. Nanni., “Slip
Modulus of FRP Sheets bonded to Concrete”, Journal of
Composites for Construction, Vol. 3, No. 4, 1999.
14. V. A. Volnyy and C. P. Pantelides, "Bond length of CFRP
composites attached to precast concrete walls", Journal of
composites for construction, Vol. 3, No. 4, 1999.
15. L. Bizindavyi and K. W. Neale, "Transfer lengths and bond
strengths for composites bonded to concrete", Journal of
composite for construction, Vol. 3, No. 4, 1999.
16. Y. S. Jenq and S. P. Shah, "Shear Resistance of Reinforced
Concrete Beams- A Fracture Mechanic Approach", Fracture Mechanics: Application to Concrete, V. C. Li, and Z. P. Bazant
eds., SP-118, American Concrete Institute, Detroit
,1989,237-258.
17. S. P. Shah, S. E. Swartz and C. Ouyang, ”Fracture Mechanics of
Concrete,: Application of Fracture Mechanics to concrete, Rock and Other Quasi-Brittle Materials, A Wiley International
Publication. John Wiley &Sons, Inc, 1995.
18. A. M. Malek, H. Saadatmanesh. and M. R. Ehsani, "Prediction
of failure load of R/C beams strengthened with FRP plate due to stress concentration at the plates end", ACI Struct. J., Vol. 95, No. 2, 1998, 142-152.
0 10 20 30 40 50
0 d/4 d/2
FRP distance from support
U
lt
im
a
te
S
h
e
a
r
(k
N
)
1
2
3
5
10 Number of FRP layers
0 10 20 30 40 50
1 2 3 5 10
Number of FRP layers
U
lt
im
a
te
S
h
e
a
r
(k
N
)
0 d/4 d/2 FRP distance from support