Predictive Analytics: A Review of Trends and
Techniques
Vaibhav Kumar
Department of Computer Science & Engineering,
DIT University, Dehradun, India
M. L. Garg
Department of Computer Science & Engineering,
DIT University, Dehradun, India
ABSTRACT
Predictive analytics is a term mainly used in statistical and analytics techniques. This term is drawn from statistics, machine learning, database techniques and optimization techniques. It has roots in classical statistics. It predicts the future by analyzing current and historical data. The future events and behavior of variables can be predicted using the models of predictive analytics. A score is given by mostly predictive analytics models. A higher score indicates the higher likelihood of occurrence of an event and a lower score indicates the lower likelihood of occurrence of the event. Historical and transactional data patterns are exploited by these models to find out the solution for many business and science problems. These models are helpful in identifying the risk and opportunities for every individual customer, employee or manager of an organization. With the increase in attention towards decision support solutions, the predictive analytics models have dominated in this field. In this paper, we will present a review of process, techniques and applications of predictive analytics.
Keywords
Predictive Analytics, Statistics, Machine Learning.
1.
INTRODUCTION
Predictive analytics, a branch in the domain of advanced analytics, is used in predicting the future events. It analyzes the current and historical data in order to make predictions about the future by employing the techniques from statistics, data mining, machine learning, and artificial intelligence [1]. It brings together the information technology, business modeling process, and management to make a
prediction about the future. Businesses can appropriately use big data for their profit by successfully applying the predictive analytics. It can help organizations in becoming proactive, forward looking and anticipating trends or behavior based on the data. It has grown significantly alongside the growth of big data systems [2].
Suppose an example of an E-Retailing company, XYZ Inc. The company runs its retailing business worldwide through internet and sells variety of products. Millions of customer visit the website of XYZ to search a product of their interest. They look for the features, price, offers related to that product listed on the website of XYZ. There are many products which sells are dependent on season. For example demand of air
conditioner increases in summers and demand of geysers increases in winter. The customers search for the product depending the season. Here the XYZ Company will collect all the search data of customers that in which season, customers are interested in which products. The price range an individual customer is interested in. How customers are attracted seeing offers on a product. What other products are bought by customers in combination with one product. On the basis of this collected data, XYZ Company will apply analytics and identify the requirement of customer. It will find out which individual customer will be attracted by which type of recommendation and then approach customers through emails and messages. They will let the customer know that there is such type of offer on the products customer has on its website. If the customer come to the website again to buy that product then the company will offer the other products which have been sold in combination to other customers. If a customer start buying a frequently, then the company reduce offer or increase price for that individual customer. This is just an instance and there are many more applications of predictive analytics.
Predictive analytics has not a limited application in e-retailing. It has a wide range of application in many domains. Insurance companies collect the data of working professional from a third party and identifies which type of working professional would be interested in which type of insurance plan and they approach them to attract towards its products [3]. Banking companies apply predictive analytics models to identify credit card risks and fraudulent customer and become alert from those type of customers. Organizations involved in financial investments identify the stocks which may give a good return on their investment and they even predict the future performance of stocks based on the past and current performance. Many other companies are applying predictive models in predicting the sale of their products if they are making such type of investment in manufacturing. Pharmaceutical companies may identify the medicines which have a lower sale in a particular area and become alert on expiry of those medicines [4].
2.
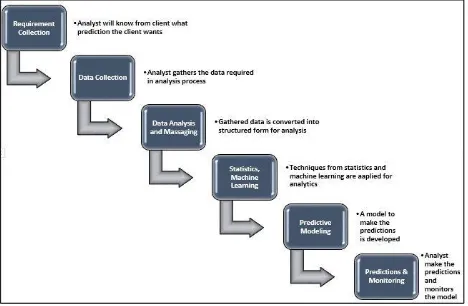
PREDICTIVE ANALYTICS PROCESS
Figure 1: Predictive Analytics Process
2.1 Requirement Collection
To develop a predictive model, it must be cleared that what is the aim of prediction. Through the prediction, the type of knowledge
which will be gained should be defined. For example, a pharmaceutical company wants to know the forecast on the sale of a medicine in a
particular area to avoid expiry of those medicines. The data analysts sit with the clients to know the requirement of developing the predictive model and how the client will be benefitted from these predictions. It will be identified that which data of client will be required in developing the model.
2.2 Data Collection
After knowing the requirement of the client organization, the analyst will collect the datasets, may be from different sources, required in developing the predictive model. This may be a complete list of customers who use or check the products of the company. This data may be in the structured form or in unstructured form. The analyst verifies the data collected from the clients at their own site.
2.3 Data Analysis and Massaging
Data analysts analyze the collected data and prepare it for analysis and to be used in the model. The unstructured data is converted into a structured form in this step. Once the complete data is available in the structured form, its quality is then tested. There are possibilities that erroneous data is present in the main dataset or there are many missing values against the attributes, these all must be addressed. The effectiveness of the predictive model totally depends on the quality of data. The analysis phase is sometimes referred to as data munging or massaging the data that means converting the raw data into a format that is used for analytics.
2.4 Statistics, Machine Learning
The predictive analytics process employs many statistical and machine learning technique. Probability theory and regression analysis are most important techniques which are popularly used in analytics. Similarly, artificial neural networks, decision tree, support vector machines are the tools of machine learning which are widely used in many predictive analytics tasks. All the predictive analytics models are based on statistical and/or machine learning techniques. Hence the analysts apply the concepts of statistics and machine learning in order to develop predictive models. Machine learning techniques have an advantage over conventional statistical techniques, but techniques of statistics must be involved in developing any predictive model.
2.5 Predictive Modeling
In this phase, a model is developed based on statistical and machine learning techniques and the example dataset. After the development, it is tested on the test dataset which a part of the main collected dataset to check the validity of the model and if successful, the model is said to be fit. Once fitted, the model can make accurate predictions on the new data entered as input to the system. In many applications, the multi-model solution is opted for a problem.
2.6 Prediction and Monitoring
After the successful tests in predictions, the model is deployed at the client’s site for everyday predictions and decision-making process. The results and reports are generated by the model nor managerial process. The model is consistently monitored to ensure whether it is giving the correct results and making the accurate predictions.
process which involves multiple processes from requirement collection to deployment and monitoring for effective utilization of the system in order to make it a system in decision-making process.
3.
PREDICTIVE ANALYTICS
OPPORTUNITIES
Though there is a long history of working with predictive analytics and it has been applied widely in many domains for decades, today is the era of predictive analytics due to the advancement of technologies and dependency on data [5]. Many organizations are tending towards predictive analytics in order to increase their bottom line and profit. There are several reasons for this attraction:-
Growth in the volume and types of data is the reason to use predictive analytics to find insights from large-sized data.
Faster, cheaper, and user-friendly computers are available for processing
A variety of software is available and more developments are going on in software which are easy to use for users.
The competitive environment of growing the organization with profit and the economic conditions of the organization push them to use the predictive analytics.
With the development of easy to use and interactive software and its availability, predictive analytics is not being limited to the statisticians and mathematicians. It is being used in a full swing by business analysts and managerial decision process.
Some of the most common opportunities in the field of predictive can be listed as:-
1. Detecting Fraud: Detection and prevention of criminal behavior patterns can be improved by combining the multiple analysis methods. The growth in cybersecurity is becoming a concern. The behavioral analytics may be applied to monitor the actions on the network in real time. It may identify the abnormal activities that may lead to a fraud. Threats may also be detected by applying this concept [6].
2. Reduction of Risk: Likelihood of default by a buyer or a consumer of a service may be assessed in advance by the credit score applying the predictive analytics. The credit score is generated by the predictive model using all the data related to the person’s creditworthiness. This is applied by credit card issuers and insurance companies to identify the fraudulent customers [7].
3. Marketing Campaign Optimization: The response
of customers on purchase of a product may be determined by applying predictive analytics. It may also be used to promote the cross-sale opportunities. It helps the businesses to attract and retain the most profitable customers [8].
4. Operation Improvement: Forecasting on inventory and managing the resources can be achieved by applying the predictive models. To set the prices of tickets, airlines may use predictive analytics. To maximize its occupancy and increasing the revenue, hotels may use predictive models to predict the number of guests on a given night. An organization may be enabled to function more efficiently by applying the predictive analytics [9].
5. Clinical Decision Support System: Expert systems based on predictive models may be used for diagnosis of a patient. It may also be used in the development of medicines for a disease [10].
4.
CATEGORIES OF PREDICTIVE
ANALYTICS MODELS
The general meaning of predictive analytics is Predictive Modeling, which means the scoring of data using predictive models and then forecasting. But in general, it is used as a term to refer to the disciplines related to analytics. These disciplines include the process of data analysis and used in business decision making. These disciplines can be categorized as the following:-
Predictive Models: The relation between the performance of a unit and the attributes is modeled by predictive models. This model evaluates the likelihood that the similar unit in a different sample is showing the specific performance. This model is widely applied in marketing where the answers about customer performance are expected. It simulates the human behavior to give the answers to a specific question. It calculates during the transaction by a customer to identify the risk related to the customer or transaction.
Descriptive Models: The descriptive model
establishes the relationship between the data in order to identify customers or groups in a prospect. As predictive models identify one customer or one performance, descriptive models identify many relations between product and its customers. Instead of ranking customers on their actions, it categorizes customers by their product performance. A large number of individual agents can be simulated together to make a prediction in descriptive modeling.
Decision Models: The relationship between the data, the decision, and the result of the forecast of a decision are described by the decision models. In order to make a prediction on the result of a decision which involves many variables, this relationship is described the decision model. To maximize certain outcome, minimize some other outcome, and optimization, these models are used. It is used in developing business rules to produce the desired action for every customer or in any circumstance.
The predictive analytic model is defined precisely as a model which predicts at a detailed level of granularity. It generates a predictive score for each individual. It is more like a technology which learns from experience in order to make predictions about the future behavior of an individual. This helps in making better decisions. The accuracy of results by the model depends on the level of data analysis.
5.
PREDICTIVE ANALYTICS
TECHNIQUES
All the predictive analytics models are grouped into
5.1 Decision Tree
[image:4.595.317.527.72.220.2]A decision tree is a classification model but it can be used in regression as well. It is a tree-like model which relates the decisions and their possible consequences [11]. The consequences may be the outcome of events, cost of resources or utility. In its tree-like structure, each branch represents a choice between a number of alternatives and its every leaf represents a decision. Based on the categories of input variables, it partitions data into subsets. It helps the individuals in decision analysis. Ease of understanding and interpretation make the decision trees popular to use. A typical model of the decision tree is represented in figure 2 given below.
Figure 2: Decision Tree
A decision tree is represented in figure 2 as a tree-like structure. It has the internal nodes labeled with the questions related to the decision. All the branches coming out from a mode are labeled with the possible answers to that question. The external nodes of the tree called the leaves, are labeled with the decision of the problem. This model has the property to handle the missing data and it is also useful in selecting the preliminary variables. They are often referred as generative models of induction rules that work on the empirical data. It uses most of the data in the dataset and minimizes the level of questions.
Along with these properties, the decision trees have several advantage and disadvantages. New possible scenarios can be added to the model which reflects the flexibility and adaptability of the model. It can be integrated with other decision models as per the requirement. They have limitation to adopt the changes. A small change in the data leads to the large change in the structure. They lag behind in the accuracy of prediction in comparison to other predictive models. The calculation is complex in this model especially on the use of uncertain data.
5.2
Regression Model
Regression is one of the most popular statistical technique which estimates the relationship between variables. It models the relationship between a dependent variable and one or more independent variables.
[image:4.595.54.282.215.357.2]It analyzes how the value of dependent variable changes on changing the values of independent variables in the modeled relation [12]. This modeled relation between dependent and independent relation is represented in figure 4 given below.
Figure 4: Regression Model
In the context of the continuous data, which is assumed to have a normal distribution, the regression model finds the key pattern in large datasets. It is used to find out the effect of specific factors influence the movement of a variable. In regression, the value of a response variable is predicted on the basis of a predictor variable. In this case, a function known as regression function is used with all the independent variables to map them with the dependent variables. In this technique, the variation of the dependent variable is characterized by the prediction of the regression function using a probability distribution.
There are two types of regression models are used in predictive analytics for prediction or forecasting, the linear regression model, and the logistic regression model. The linear regression model is applied to model the linear relation between dependent and independent variables. A linear function is used as regression function in this model. On the other hand, the logistics regression when there are categories of dependent variables. Through this model, unknown values of discrete variables are predicted are predicted on the basis of known values of independent variables. It can assume a limited number of values in prediction.
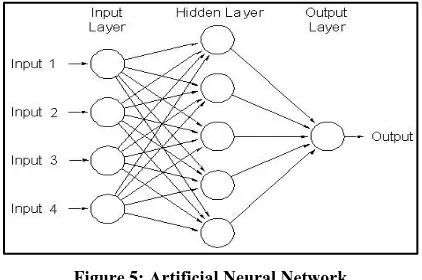
5.3 Artificial Neural Network
Artificial neural network, a network of artificial neurons based on biological neurons, simulates the human nervous system capabilities of processing the input signals and producing the outputs [13]. This is a sophisticated model that is capable of modeling the extremely complex relations. The architecture of a general purpose artificial neural network is represented in figure 5.
Figure 5: Artificial Neural Network
[image:4.595.323.534.568.708.2]is applied for the processing and it is passed to the hidden layer which a vector of neurons. Various types of activation functions are used at neurons depending upon the requirement of output. The output of one neuron is transferred to the neurons of next layer. At the output layer, out is collected that may be the prediction on new data.
There are various models of artificial neural network and each model uses a different algorithm. Backpropagation is a popular algorithm which is used dominantly in many supervised learning problems. Artificial neural networks are used in unsupervised learning problems as well. Clustering is the technique used in unsupervised learning where artificial neural networks are also used. They have the power to handle the non-linear relation in the data. They are also used in evaluating the results of regression models and decision trees. With the capability of pattern recognition these models are used in image recognition problems.
5.4 Bayesian Statistics
[image:5.595.317.565.73.188.2]This technique belongs to the statistics which takes parameters as random variables and use the term “degree of belief” to define the probability of occurrence of an event [14]. The Bayesian statistics is based on Bayes’ theorem which terms the events priori and posteriori. In conditional probability, the approach is to find out the probability of a posteriori event given that priori has occurred. On the other hand, the Bayes’ theorem finds the probability of priori event given that posteriori has already occurred. It is represented in figure 6.
Figure 6: Bayesian Statistics
It uses a probabilistic graphical model which is called the Bayesian network which represents the conditional dependencies among the random variables. This concept may be applied to find out the causes with the result of those causes in hand. For example, it can be applied in finding the disease based on the symptoms.
5.5 Ensemble Learning
[image:5.595.317.538.352.398.2]It belongs to the category of supervised learning algorithms in the branch of machine learning. These model are developed by training several similar type models and finally combining their results on prediction. In this way, the accuracy of the model is improved. Development in this way reduce the bias and reduce the variance of the model. It helps in identifying the best model to be used with new data [15]. The instance of classification using ensemble learning is represented in figure 7.
Figure 7: Ensemble Classifier
5.6 Gradient Boost Model
[image:5.595.64.271.382.531.2]This technique is used in predictive analytics as a machine learning technique. It is mainly used in classification and regression-based applications. It is like an ensemble model which ensembles the predictions of weak predictive models that are decision trees [16]. It is a boosting approach in which resamples the dataset many times and generate results as a weighted average of the resampled datasets. It has the advantage that it is less prone to overfitting which the limitation of many machine learning models. Use of decision trees in this model helps in fitting the data fairly and the boosting improves the fitting of data. This model is represented in figure 8.
Figure 8: Gradient Boosting
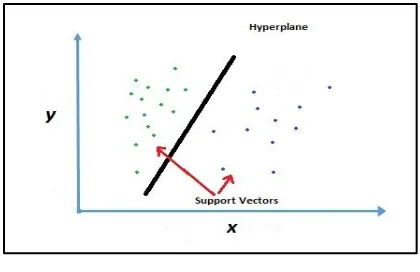
5.7 Support Vector Machine
It is supervised kind of machine learning technique popularly used in predictive analytics. With associative learning algorithms, it analyzes the data for classification and regression [17] [18]. However, it is mostly used in classification applications. It is a discriminative classifier which is defined by a hyperplane to classify examples into categories. It is the representation of examples in a plane such that the examples are separated into categories with a clear gap. The new examples are then predicted to belong to a class as which side of the gap they fall. The example of separation by a support vector machine is represented in figure 9.
Figure 9: Support Vector Machine
5.8 Time Series Analysis
[image:5.595.323.533.543.679.2]time domain. It predicts the future of a variable at future time intervals based on the analysis of values at past time intervals. It is used in stock market prediction and weather forecasting very popularly. An example of variation in the price of some product over the period of time and its trends forecast in future years is represented in figure 10.
Figure 10: Time Series Analysis
5.9
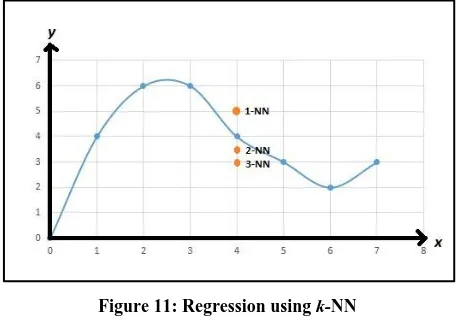
k
-nearest neighbors (k-NN)
It is a non-parametric method used in classification and regression problems. In this method, the input comprises the k
[image:6.595.53.282.140.304.2]closest training examples in a feature space [20]. In classification problems, the output is the membership of a class and in the regression problems, the output is the property value of an object. It is the simplest kind of machine learning algorithms. An Example of regression using k-NN is represented in figure 11.
Figure 11: Regression using k-NN
5.10 Principle Component Analysis
[image:6.595.53.281.423.581.2]It is statistical procedure mostly used in predictive models for exploratory data analysis. It is closely related to the factor analysis which used in solving the eigenvectors of a matrix. It is also used in describing the variance in a dataset [21]. The example of principle component in a dataset is represented in figure 12.
Figure 12: Principle Component Analysis
6.
APPLICATION OF PREDICTIVE
ANALYTICS
There are many applications of predictive analytics in a variety of domains. From clinical decision analysis to stock market prediction where a disease can be predicted based on symptoms and return on a stock, investment can be estimated respectively. We will list out here below some of the popular applications.
Banking and Financial Services
In banking and financial industries, there is a large application of predictive analytics. In both the industries data and money is crucial part and finding insights from those data and the movement of money is a must. The predictive analytics helps in detecting the fraudulent customers and suspicious transactions. It minimizes the credit risk on which theses industries lend money to its customers. It helps in cross-sell and up-sell opportunities and in retaining and attracting the valuable customers. For the financial industries where money is invested in stocks or other assets, the predictive analytics forecasts the return on investments and helps in investment decision making process.
Retail
The predictive analytics helps the retail industry in identify the customers and understanding what they need and what they want. By applying this technique, they predict the behavior of customers towards a product. The companies may fix prices and set special offers on the products after identifying the buying behavior of customers. It also helps the retail industry in predicting that how a particular product will be successful in a particular season. They may campaign their products and approach to customers with offers and prices fixed for individual customers. The predictive analytics also helps the retail industries in improving their supply-chain. They identify and predict the demand for a product in the specific area may improve their supply of products [22].
Health and Insurance
Oil Gas and Utilities
The oil and gas industries are using the predictive analytics techniques in forecasting the failure of equipment in order to minimize the risk. They predict the requirement of resources in future using these models. The need for maintenance can be predicted by energy-based companies to avoid any fatal accident in future [24].
Government and Public Sector
The government agencies are using big data-based predictive analytics techniques to identify the possible criminal activities in a particular area. They analyze the social media data to identify the background of suspicious persons and forecast their future behavior. The governments are using the predictive analytics to forecast the future trend of the population at country level and state level. In enhancing the cybersecurity, the predictive analytics techniques are being used in full swing [25].
7.
CONCLUSION AND FUTURE SCOPE
There has been a long history of using predictive models in the tasks of predictions. Earlier, the statistical models were used as the predictive models which were based on the sample data of a large-sized data set. With the improvements in the field of computer science and the advancement of computer techniques, newer techniques have been developed and better and better algorithms been introduced over the period of time. The developments in the field of artificial intelligence and machine learning have changed the world of computation where intelligent computation techniques and algorithms are introduced. The machine learning models have a very well track record of being used as predictive models. Artificial neural networks brought the revolution in the field of predictive analytics. Based on the input parameters, the output or future of any value can be predicted. Now with the advancements in the field of machine learning and the development of deep learning techniques, there is a trend nowadays of using deep learning models in predictive analytics and they are being applied in a full swing in this task. This paper opens a scope of development of new models for the task of predictive analytics. There is also an opportunity to add additional features to the existing models to improve their performance in the task.
8.
REFERENCES
[1]. Charles Elkan, 2013, “Predictive analytics and data mining”, University of California, San Diego.
[2]. Eric Siegel, 2016, “Predictive Analytics”, John Willey and Sons Ltd.
[3]. Charles Nyce, 2007, “Predictive Analytics White Paper”, American Institute of CPCU/IIA.
[4]. W Eckerson, 2007, “Extending the Value of Your Data Warehousing Investment”, The Data Warehouse Institute.
[5]. Sue Korn, 2011, “The Opportunity of Predictive Analytics in Finance”, HPC Wire.
[6]. M Nigrini, 2011, “Forensic Analytics: Methods and Techniques for Forensic Accounting Investigations”, John Willey and Sons Ltd.
[7]. M Schiff, 2012, “BI Experts: Why Predictive Analytics Will Continue to Grow”, The Data Warehouse Institute.
[8]. F Reichheld, P Schefter, Retrieved 2018, “The Economics of E-Loyalty”, Harvard Business School Working Knowledge.
[9]. V Dhar, 2001, “Predictions in Financial Markets: The Case of Small Disjuncts”, ACM Transaction on Intelligent Systems and Technology, Vol-2, Issue-3.
[10]. J Osheroff, J Teich, B Middleton, E Steen, A Wright, D Detmer, 2007, “A Roadmap for National Action on Clinical Decision Support”, JAMIA: A Scholarly Journal of Informatics in Health and Biomedicine, Vol-14, Issue-2, Pages-141-145.
[11]. B Kaminski, M Jakubczyk, P Szufel, 2018, “A framework for sensitivity analysis of decision trees”, Central European Journal of Operations Research, Vol-26, Issue-1, Pages-135-159.
[12]. J S Armstrong, 2012, “Illusions in regression analysis”, International Journal of Forecasting, Vol-28, Issue-3, Pages-689-694.
[13]. W S McCulloch, Walter Pitts, 1943, “A logical calculus of the ideas immanent in nervous activities”, The bulletin of mathematical biophysics, Vol-5, Issue-4, Pages-115-133.
[14]. Peter M Lee, 2012, “Bayesian Statistics: An Introduction, 4th Edition”, John Willey and Sons Ltd.
[15]. R Polikar, 2006, “Ensemble based Systems in decision making”, IEEE Circuits and Systems Magazine, Vol-6, Issue-3, Pages-21-45.
[16]. J H Friedman, 1999, “Greedy Function Approximation: A Gradient Boosting Machine”, Lecture notes.
[17]. C Cortes, 1995, “Support-vector networks”, Machine Learning, Vol-20, Issue-3, Pages- 273-297.
[18]. Ben Hur et al, 2001, “Support Vector Clustering”, Journal of Machine Learning Research, Vol-2, Pages-125-137.
[19]. J Lin, E Keogh, S Lonardi, C Chiu, 2003, “A symbolic representation of time series, with implications for streaming algorithms”, Proceedings of the 8th
ACM SIGMOD workshop on research issues in data mining and knowledge discovery, Pages-2-11.
[20]. N S Altman, 1992, “An Introduction to Kernel and Nearest-Neighbor Nonparametric Regression”, The American Statistician, Vol-46, Issue-3, Pages- 175-185.
[21]. H Abdi, L J Williams, 2010, “Principal component analysis”, WIREs: Computational Statistics, Vol-2, Issue-4, Pages-433-459.
[22]. K Das, GS Vidyashankar, 2006, “Competitive Advantage in Retail Through Analytics: Developing Insights, Creating Values”, Information Management.
[23]. N Conz, 2008, “Insurers Shift to Customer-Focused Predictive Analytics Technologies”, Insurance & Technology.
[24]. J Feblowitz, 2013, “Analytics in Oil and Gas: The Big Deal About Big Data”, Proceeding of SPE Digital Energy Conference, Texas, USA.