© 2019, IRJET | Impact Factor value: 7.34 | ISO 9001:2008 Certified Journal
| Page 2104
COMPARATIVE STUDY OF EFFECT OF VARYING SPAN LENGTH ON
MAJOR ELEMENTS OF METRO BRIDGE
NILESH SHADUNKEY, ASSO PROF. RASHMI SAKALLE
1
M.Tech. Student, Deptt of Structural Engineer, Truba Institute of Engineering and Information Technology Rgpv
University Bhopal, (M.P), INDIA
2
Associate Professor, Department of Civil and Applications Truba Institute of Engineering and Information
Technology, Bhopal, (M.P) INDIA
---***---
1. ABSTRACT: A metro system is a railway transport system in an urban area with a high capacity, frequency and the grade separation from other traffic. Metro System is used in cities, agglomerations, and metropolitan areas to transport large numbers of people. An elevated metro system is more preferred type of metro system due to ease of construction and also it makes urban areas more accessible without any construction difficulty. An elevated metro system has two major elements pier and girder.In this study we have focused on two curve models of total span of 100 meter. The main focus in this comparative study is to find a suitable design for the metro system because for varying design systems we will face construction issues as well as traffic planning issues. Models of different span of 40 and 70 meter is analysed here just to find out a significant span so that we can generalize the complete metro design from a single analysis it will help us in both construction of metro rail and road traffic planning as well
Keywords: Metro Structure, Bridge Pier, Girder Bridge, Seismic Design, Pier Design, Curved Model 2. INTRODUCTION
A metro system is an electric passenger railway transport system in an urban area with a high capacity, frequency and the grade separation from other traffic. Metro System is used in cities, agglomerations, and metropolitan areas to transport large numbers of people at high frequency. The grade separation allows the metro to move freely, with fewer interruptions and at higher overall speeds. Metro systems are typically located in underground tunnels, elevated viaducts above street level or grade separated at ground level. An elevated metro structural system is more preferred one due to ease of construction and also it makes urban areas more accessible without any construction difficulty. An elevated metro structural system has the advantage that it is more economic than an underground metro system and the construction time is much shorter. An elevated metro system has two major components pier and girder. A typical elevated metro bridge model. Viaduct or girder of a metro bridge requires pier to support the each span of the bridge and station structures. Piers are constructed in various cross sectional shapes like cylindrical, elliptical, square, rectangular and other forms. The piers considered for the present study are in rectangular cross section and it is located under station structure. A typical girders and pier considered for the present study. In the present study we are compare the two models and analysed their results for future planning.
© 2019, IRJET | Impact Factor value: 7.34 | ISO 9001:2008 Certified Journal
| Page 2105
GENRAL CRITERIA:Genral criteria used for the design purpose is given below:
CAPACITY
DMC: Driving Trailer Car MC: Motor Car
Tc: Trailer Car
6 Car Train Composition: DMC + TC + MC + MC + TC + DMC DMC: 247 Passenger (Sitting-43, Crush Standing-204) TC/MC: 270 Passeneger (Sitting–50, Crush Standing-220) 6 Car Train: 1574 Passenger (Sitting-286, Crush Standing-1288)
IS CODE USING:
IS 1893 IS 875-I IS 875-II IS 456:2000 IRC Boggie Load IS 13920
BRIDGE DETAILS:
Total Length of bridge : 100 m
Length of End Span : 15 m (in model 1) & 30 m (in model 2) Length of mid span : 70 m ( in model 1) & 40 m (in model 2) Bridge design for : 20 T /m
Overall design for loading : 200 T
Bridge Design for Maximum Speed : 95 kmph Width of gauge / carriageway = 1435 mm
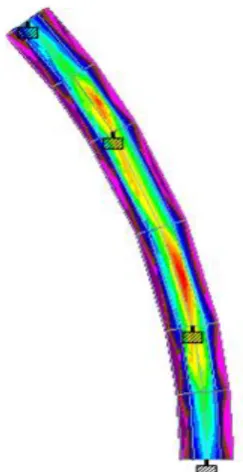
Fig 2- Forces On Curve Model 3. LITERATURE REVIEW
© 2019, IRJET | Impact Factor value: 7.34 | ISO 9001:2008 Certified Journal
| Page 2106
Kees Vanamölder (MAY,2017) conducted study in order to evaluate possible structural solutions for bridges in practical case, case-study was performed on the basis of designed Rail Baltic bridge over Pärnu river. Rail Baltic is designed as new railway line between Tallinn and Poland that would connect Baltic states with European railway network with 1435 mm track gauge. Rail Baltic is double-track electrified railway line for mixed traffic with design speed of 240 km/h and with overall length around 700 km. In Estonia overall length of railway route is around 210 km and railway alignment follows Tallinn (Muuga/Ülemiste), Rapla, Pärnu and Ikla. The conclusion was made that since LCC of arch, network arch and truss bridges occurred to be similar, these structural forms can be considered as the most suitable for span 170 m from the financial point of view. LCC of suspension and cable-stayed bridges are approximately 2-3 times4. OBJECTIVE
The aim of the study is to find a suitable design at a location where total span length is 100 m and Radius of Curvature is 150 m and the traffic design as well as other construction issues is based on the Mid Span of Bridge. The main focus in this comparative study is to find a suitable design for the metro system as well as traffic
planning issues at that location .So the Models of two different mid span of 40 and 70 metre is analysed here just to find out a significant span so that we can generalize the metro design as well as traffic planning from a single analysis it will help us in both construction of metro rail and road traffic planning at that location.
In this comparative study, two curved models of radius 150 m have been considered of total span 100 m. In the first model, the mid span between piers is 70 m & side span is 15 m each. In the second model, the mid span between piers is 40m & side span is 30 m each.
The objective is to give a thought regarding the examination and plan of metro Bridge. Here the model is being outlined according to IRC70R stacking and all the necessary loads they used In metro Bridge which is appropriate on all streets on which the changeless extensions and ducts can be built. Investigation and Design process by Staad Pro decides the execution of structures.
In this we can genralised the significant span between two curve model length 40m and 70m this study case is also use full for future uses for this type of case..
5. METHEDOLOGY
A girder bridge, in general, is a bridge that uses girders as the means of supporting the deck. A bridge consists of three parts: the foundation (abutments and piers), the superstructure (girder, truss, or arch), and the deck. A girder bridge is very likely the most commonly built and utilized bridge in the world. Its basic design, in the most simplified form, can be compared to a log ranging from one side to the other across a river or creek. In modern girder stee bridges, the two most common shapes are plate girders and box girders. The term "girder" is often used interchangeably with "beam" in reference to bridge design. STAAD. Pro. in space is Operated with units Metre and Kilo Newton. The geometry is drawn and the
section properties are assigned. Fixed Supports are taken. Quadrilateral meshing is done followed by assigning of plate thickness.3D rendering can be viewed for the geometry. Loads are defined by the loads and definitions. By Post Processing mode, Noda displacement, Max. Absolute Stress distribution for the bridge can be viewed. Run analysis is operated. Max. Response by the IRC Class 70R loading is done by STAAD.beava. The deck is created in bridge deck processor, this being the first step of STAAD.beava. In STAAD.beava, roadways, curbs, vehicular parameters are provided. Lastly transfer of load is done into STAAD Pro. For further analysis and design. Al the Max response criteria are checked Mx,My,Mz stresses etc for different members elements. The load positions and reactions, beam forces and moments, etc. are determined. The concrete is designed as per IS Code.
5.1. METHOD USED FOR ANALAYSIS
The Finite Element Method is used for analysis Beam and Coloum Design and the steps used for analysis they are
following as:Step-1 Calculation Loads Wu = F.O.S x W
© 2019, IRJET | Impact Factor value: 7.34 | ISO 9001:2008 Certified Journal
| Page 2107
Step 2 Calculation Maximum Bending MomentMu = Wu x Leff^2
Where, Mu = Maximum Bending Moment Step 3 Calculation Effective Depth
Deff = √Mu/Ru x b
Where, Ru = Grade Of Steel = 0.133fck
Step 4 -Calculation Area Of Steel (Ast)
Area of tension reinforcement (Ast1) for a singly reinforced section at mid span and at support is calculated from Annex
G-1.1(b) of IS 456:2000
If section is over reinforced then area of compression reinforcement (Asc) and additional tensile reinforcement ( Ast2) is
calculated from Annex G-1.2 of IS 456:2000
Step 5 - Calculate Shear Reinforcement
Nominal shear stress in beams is calculated from clause 40.1 of IS 456:2000[9].
Step 6-Calculate Minimum percentage of steel Ptmin ( % )= 100 x Ast/ bd
Step 7- Calculate spacing
Spacing in beam is calculated from clause 26.5.1.5, and 26.5.1.6 of IS 456:2000[9].
Step 8- check for deflection Fsc =( 0.58fy x Ast Req) / Ast Provided
6. RESULT & DISCUSSION
Parametric Study on Girder Bridge and pierslusingl finitel elementl methodl and compare the Result of Both Models are describedl inl thisl chapter.l
s
© 2019, IRJET | Impact Factor value: 7.34 | ISO 9001:2008 Certified Journal
| Page 2108
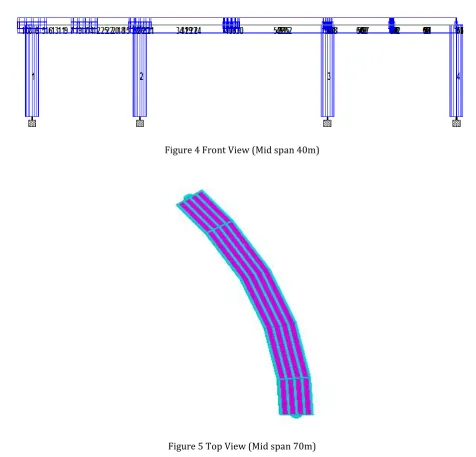
Figure3 TopView (Midspan40m)Figure 4 FrontView(Midspan40m)
[image:5.595.46.537.63.538.2] [image:5.595.55.532.314.771.2]© 2019, IRJET | Impact Factor value: 7.34 | ISO 9001:2008 Certified Journal
| Page 2109
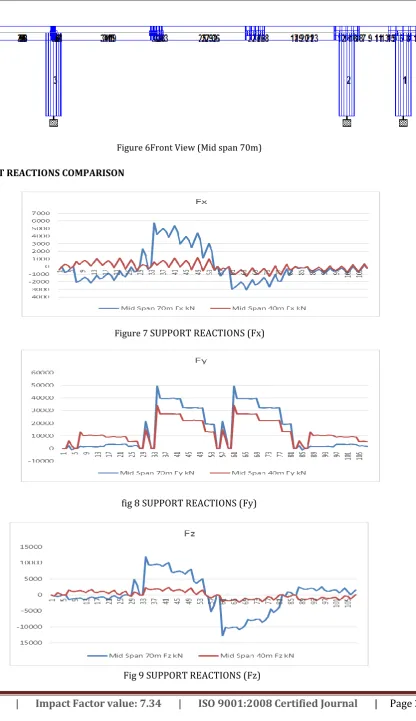
Figure6FrontView(Midspan70m)
6.1.1. SUPPORT REACTIONS COMPARISON
Figure7 SUPPORT REACTIONS (Fx)
fig 8 SUPPORT REACTIONS (Fy)
[image:6.595.108.525.82.804.2] [image:6.595.66.536.106.227.2]© 2019, IRJET | Impact Factor value: 7.34 | ISO 9001:2008 Certified Journal
| Page 2110
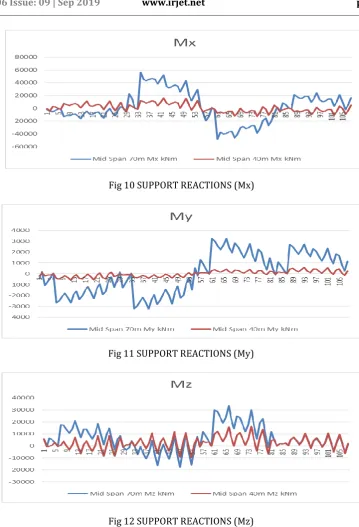
Fig 10 SUPPORT REACTIONS (Mx)Fig 11 SUPPORT REACTIONS (My)
Fig 12 SUPPORT REACTIONS (Mz)
Tablel 6.1SUPPORT REACTIONS (Fx)l ofl Midl Spanl 40m
Node L/C Fx kN
Max Fx 2 1.5X(DEAD+LIVE) 620.056
Min Fx 1 EQ+X -423.889
Max Fx 2 1.2X(DEAD+LIVE-SEISMIC ) 506.449
Min Fx 3 1.2X(DEAD+LIVE+SEISMIC ) -715.684
Max Fx 4 1.2X(DEAD+LIVE+SEISMIC ) -739.322
Min Fx 1 1.2X(DEAD+LIVE-SEISMIC ) 39.853
Max Fx 2 IRC: SLS Class 70R+A Loading -1301.55
© 2019, IRJET | Impact Factor value: 7.34 | ISO 9001:2008 Certified Journal
| Page 2111
Tablel 6.2l SUPPORT REACTIONS (Fx)l ofl Midl Spanl 70mNode L/C Fx kN
Max Fx 2 1.5X(DEAD+LIVE) 5752.268
Min Fx 1 EQ+X -589.432
Max Fx 2 1.2X(DEAD+LIVE-SEISMIC ) -3023.021
Min Fx 3 1.2X(DEAD+LIVE+SEISMIC ) 3840.142
Max Fx 4 1.2X(DEAD+LIVE-SEISMIC ) -3023.021
Min Fx 1 1.2X(DEAD+LIVE-SEISMIC ) 3840.142
Max Fx 2 IRC: SLS Class 70R+A Loading 506.449
Min Fx 3 IRC: SLS Class 70R+A Loading -595.961
NOTE:
In The Above Comparation we compare the support reaction between 40m span model and 70m span model in horizontal reaction (Fx).
We found that 40 m span model reaction (Fx) is very low compare to 70 m span so we suggested that 40 m span model is suitable for the used.
Tablel 6.3SUPPORT REACTIONS (Fy)ofl Midl Spanl 40m
Node L/C Fy kN
Max Fy 2 1.5X(DEAD+LIVE) 34172.23
Min Fy 1 EQ+X -92.432
Max Fy 2 1.2X(DEAD+LIVE-SEISMIC ) 27303.67
Min Fy 3 1.2X(DEAD+LIVE+SEISMIC ) 27256.1
Max Fy 4 1.2X(DEAD+LIVE+SEISMIC ) 10337.28
Min Fy 1 1.2X(DEAD+LIVE-SEISMIC ) 10258.35
Max Fy 2 IRC: SLS Class 70R+A Loading 28323.32
Min Fy 3 IRC: SLS Class 70R+A Loading 22009.85
Tablel 6.4l SUPPORT REACTIONS (Fy)ofl Midl Spanl 70m
Node L/C Fy kN
Max Fy 2 1.5X(DEAD+LIVE) 49368.23
Min Fy 1 EQ+X -982.638
Max Fy 2 1.2X(DEAD+LIVE-SEISMIC ) 39557.61
Min Fy 3 1.2X(DEAD+LIVE+SEISMIC ) -3840.142
Max Fy 4 1.2X(DEAD+LIVE+SEISMIC ) -27307.67
Min Fy 1 1.2X(DEAD+LIVE-SEISMIC ) 22009.85
Max Fy 2 IRC: SLS Class 70R+A Loading 5752.268
Min Fy 3 IRC: SLS Class 70R+A Loading -2966.97
NOTE:
In The Above Comparation we compare the support reaction between 40m span model and 70m span model in horizontal reaction (Fy).
© 2019, IRJET | Impact Factor value: 7.34 | ISO 9001:2008 Certified Journal
| Page 2112
Tablel 6.5l l SUPPORT REACTIONS (Fz)ofl Midl Spanl 40mNode L/C Fz kN
Max Fz 2 1.5X(DEAD+LIVE) 2205.981
Min Fz 1 EQ+X -86.118
Max Fz 2 1.2X(DEAD+LIVE-SEISMIC ) 2321.834
Min Fz 3 1.2X(DEAD+LIVE+SEISMIC ) -2311.3
Max Fz 4 1.2X(DEAD+LIVE+SEISMIC ) -1162.81
Min Fz 1 1.2X(DEAD+LIVE-SEISMIC ) 1081.854
Max Fz 2 IRC: SLS Class 70R+A Loading 2341.54
Min Fz 3 IRC: SLS Class 70R+A Loading -2148.34
Tablel 6.6 SUPPORT REACTIONS (Fz)ofl Midl Spanl 70m
Node L/C Fz kN
Max Fz 2 1.5X(DEAD+LIVE) 11818.081
Min Fz 1 EQ+X -407.474
Max Fz 2 1.2X(DEAD+LIVE-SEISMIC ) -10083.814
Min Fz 3 1.2X(DEAD+LIVE+SEISMIC ) -9361.517
Max Fz 4 1.2X(DEAD+LIVE+SEISMIC ) -10083.814
Min Fz 1 1.2X(DEAD+LIVE-SEISMIC ) 2321.834
Max Fz 2 IRC: SLS Class 70R+A Loading 12798.544
Min Fz 3 IRC: SLS Class 70R+A Loading -7335.729
NOTE:
In The Above Comparation we compare the support reaction between 40m span model and 70m span model in horizontal reaction (Fz).
We found that 40 m span model reaction (Fz) is very low compare to 70 m span so we suggested that 40 m span model is suitable for the used.
Tablel 6.7lSUPPORT REACTIONSl (Mx)ofl Midl Spanl 40m
Node L/C Mx kN
Max Mx 2 1.5X(DEAD+LIVE) 12271.43
Min Mx 1 EQ+X -268.179
Max Mx 2 1.2X(DEAD+LIVE-SEISMIC ) 15830.98
Min Mx 3 1.2X(DEAD+LIVE+SEISMIC ) -12476.9
Max Mx 4 1.2X(DEAD+LIVE+SEISMIC ) 5562.437
Min Mx 1 1.2X(DEAD+LIVE-SEISMIC ) -2979.86
Max Mx 2 IRC: SLS Class 70R+A Loading 7260.81
Min Mx 3 IRC: SLS Class 70R+A Loading -3653
Tablel 6.8l SUPPORT REACTIONS SUMMARYl (Mx)ofl Midl Spanl 70m
Node L/C Mx kN
Max Mx 2 1.5X(DEAD+LIVE) 56243.6913
Min Mx 1 EQ+X -3483.057
Max Mx 2 1.2X(DEAD+LIVE-SEISMIC ) 56243.691
Min Mx 3 1.2X(DEAD+LIVE+SEISMIC ) 45027.945
Max Mx 4 1.2X(DEAD+LIVE+SEISMIC ) 36547.637
Min Mx 1 1.2X(DEAD+LIVE-SEISMIC ) -15840.98
Max Mx 2 IRC: SLS Class 70R+A Loading 48209.133
© 2019, IRJET | Impact Factor value: 7.34 | ISO 9001:2008 Certified Journal
| Page 2113
NOTE: In The Above Comparation we compare the support reaction between 40m span model and 70m span model in horizontal reaction (Mx).
We found that 40 m span model reaction (Mx) is very low compare to 70 m span so we suggested that 40 m span model is suitable for the used.
Tablel 6.9lSUPPORT REACTIONSl (My)ofl Midl Spanl 40m
Node L/C My kN
Max My 2 1.5X(DEAD+LIVE) 384.358
Min My 1 EQ+X -202.03
Max My 2 1.2X(DEAD+LIVE-SEISMIC ) 288.172
Min My 3 1.2X(DEAD+LIVE+SEISMIC ) --172.547
Max My 4 1.2X(DEAD+LIVE+SEISMIC ) 583.653
Min My 1 1.2X(DEAD+LIVE-SEISMIC ) -578.359
Max My 2 IRC: SLS Class 70R+A Loading 506.449
Min My 3 IRC: SLS Class 70R+A Loading -595.961
Tablel 6.10l SUPPORT REACTIONS (My) l ofl Midl Spanl 70m
Node L/C My kN
Max My 2 1.5X(DEAD+LIVE) -3228.809
Min My 1 EQ+X -707.364
Max My 2 1.2X(DEAD+LIVE-SEISMIC ) 3248.856
Min My 3 1.2X(DEAD+LIVE+SEISMIC ) -3239.552
Max My 4 1.2X(DEAD+LIVE+SEISMIC ) 3243.753
Min My 1 1.2X(DEAD+LIVE-SEISMIC ) -3248.856
Max My 2 IRC: SLS Class 70R+A Loading 5056.449
Min My 3 IRC: SLS Class 70R+A Loading -4595.961
NOTE:
In The Above Comparation we compare the support reaction between 40m span model and 70m span model in horizontal reaction (My).
We found that 40 m span model reaction (My) is very low compare to 70 m span so we suggested that 40 m span model is suitable for the used.
Tablel 6.11l SUPPORT REACTIONS (Mz) l ofl Midl Spanl 40m
Node L/C Mz kN
Max Mz 2 1.5X(DEAD+LIVE) 2823.933
Min Mz 1 EQ+X -5658.78
Max Mz 2 1.2X(DEAD+LIVE-SEISMIC ) 3223.773
Min Mz 3 1.2X(DEAD+LIVE+SEISMIC ) -7175.684
Max Mz 4 1.2X(DEAD+LIVE+SEISMIC ) 10453.57
Min Mz 1 1.2X(DEAD+LIVE-SEISMIC ) -7313.98
Max Mz 2 IRC: SLS Class 70R+A Loading 9676.76
Min Mz 3 IRC: SLS Class 70R+A Loading -6434.65
Tablel 6.12l SUPPORT REACTIONS (Mz)ofl Midl Spanl 70m
Node L/C Mz kN
Max Mz 2 1.5X(DEAD+LIVE) 7174.72
© 2019, IRJET | Impact Factor value: 7.34 | ISO 9001:2008 Certified Journal
| Page 2114
Max Mz 2 1.2X(DEAD+LIVE-SEISMIC ) 33486.26
Min Mz 3 1.2X(DEAD+LIVE+SEISMIC ) -4585.659
Max Mz 4 1.2X(DEAD+LIVE+SEISMIC ) 3223.77
Min Mz 1 1.2X(DEAD+LIVE-SEISMIC ) -5030.74
Max Mz 2 IRC: SLS Class 70R+A Loading 5666.449
Min Mz 3 IRC: SLS Class 70R+A Loading -5435.961
NOTE:
In The Above Comparation we compare the support reaction between 40m span model and 70m span model in horizontal reaction (Mz).
We found that 40 m span model reaction (Mz) is very low compare to 70 m span so we suggested that 40 m span model is suitable for the used.
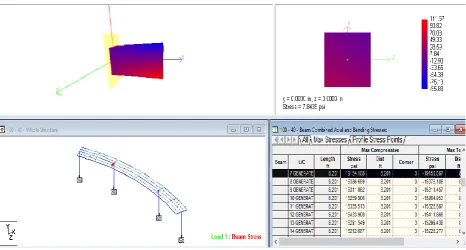
[image:11.595.66.533.279.529.2]6.1.2BEAM MAXIMUM STRESSES
Fig 13-Beam Stresses
Tablel 6.13l Maxl Beaml Forces Summaryl ofl Midl Spanl 70m
Beam L/C Node Fx kN Fy kN Fz Kn Mx kNm My kNm Mz kNm
2 1.5X(DEAD+LIVE) 2 49368.23 -5752.268 -11818.081 -3228.809 -56243.691 7174.707
1 1.5X(DEAD+LIVE) 7 -4067.22 2067.563 1413.352 -2673.605 -8137.466 13479.12
47 1.2X(DEAD+LIVE+SEI
SMIC ) 28 380.371
12102.34
6 -137.213 1657.892 190.19 27759.94
20
1.2X(DEAD+LIVE-SEISMIC ) 12 2218.485 -6616.18 6.231 2920.781 66.232 89864.06
© 2019, IRJET | Impact Factor value: 7.34 | ISO 9001:2008 Certified Journal
| Page 2115
Loading2 IRC: SLS Class 70R+A
Loading 12 43513.06 -5752.268 -11818.081 -3228.809 1.21E+05 -79109.3
Tablel6.14l Beaml ForceslSummaryofl Midl Spanl 40m
Beam L/C Node Fx kN Fy kN Fz kN Mx kNm My kNm Mz kNm
2 1.5X(DEAD+LIVE) 2 34172.23 -620.056 -2205.98 -322.826 -12271.4 -2823.93
52 1.5X(DEAD+SEISMIC) 36 -449.732 1420.408 -0.47 296.647 -1.808 10347.93
50 1.2X(DEAD+LIVE+SEISMIC) 30 18.839 8027.5 -17.295 363.479 23.552 19855.61
44 1.2X(DEAD+LIVE-SEISMIC) 30 8.969 -4572.41 13.185 -128.996 16.941 14288.58
22 IRC: SLS Class 70R+A Loading 18 76.489 2475.063 0.341 1961.127 -5.634 22888.09
55 IRC: SLS Class 70R+A Loading 35 76.615 -1473.29 -0.358 -1961.36 -0.35 -6943.67
NOTE:
In The Above Comparation we compare the support maximum stresses on Beam between 40m span model and 70m span model).
[image:12.595.239.361.472.708.2] We found that 40 m span models Beam stresses is very low compare to 70 m span so we suggested that 40 m span model is suitable for the used
© 2019, IRJET | Impact Factor value: 7.34 | ISO 9001:2008 Certified Journal
| Page 2116
6.1.3PLATE MAXIMUM STRESSESFigure15 Plate StressesMidSpan70m
6.1.4 PLATES MAXIMUM STRESSES
Tablel 4.15l Plate Stressess Summaryl ofl Midl Spanl 70m
Shear Membrane Bending Moment
Plate L/C SQX (local)
N/mm2 SQY (local) N/mm2 SX (local) N/mm2 SY (local) N/mm2 SXY (local) N/mm2 kNm/m Mx kNm/m My kNm/m Mxy
60 1.5X(DEAD+LIVE) -1.317 -1.639 0.155 -0.72 0.326 536.328 132.724 93.064
68 EQ+X 0.007 -0.001 0.033 0.06 -0.121 -0.628 -0.095 0.394
65 1.2X(DEAD+LIVE
+SEISMIC) 0.125 0.01 0.024 0.574 -0.02 68.046 -52.637 9.487
60 1.5X(DEAD+LIVE) -1.317 -1.639 0.155 -0.72 0.326 536.328 132.724 93.064
68 IRC: SLS Class
70R+A Loading -1.56 1.413 0.204 -0.772 0.001 271.833 76.935 -45.482
55 IRC: SLS Class
70R+A Loading -0.235 0.316 -0.417 0.467 0.526 340.567 70.769 -16.263
Tablel 4.16l Plate Stressess Summaryl ofl Midl Spanl 40m
Shear Membran
e Bending Moment
Plate L/C SQX
(local) N/mm2
SQY (local)
N/mm2 SX (local) N/mm2 SY (local) N/mm2 SXY (local) N/mm2 kNm/m Mx kNm/m My kNm/Mxy
m
72 1.5X(DEAD+LI
VE) 0.849 -0.518 -0.056 -0.389 0.239 210.018 35.271 19.032
73 1 EQ+X -0.001 -0.001 -0.001 0.053 0.047 -0.67 0.106 0.031
85 1.2X(DEAD+LI
VE+SEISMIC) -0.242 0.111 0.054 -0.098 -0.081 145.676 19.405 -0.94
75 1.5X(DEAD+LI
VE) 0.267 0.273 -0.005 -0.584 -0.084 59.5 -0.135 -9.789
73 IRC: SLS Class
70R+A Loading
© 2019, IRJET | Impact Factor value: 7.34 | ISO 9001:2008 Certified Journal
| Page 2117
81 IRC: SLS Class
70R+A Loading
-0.313 -0.37 -0.023 -0.043 0.008 330.011 63.13 -6.191
NOTE:
In The Above Comparation we compare the Plate Maximum stress between 40m span model and 70m span model. We found that 40 m span model plae stresses result is very low compare to 70 m span so we suggested that 40 m span
model is suitable for the used.
6.1.5NODES MAXIMUM DISPLACEMENT
Tablel 4.17l Node Displacement Summaryl ofl Midl Spanl 70m
Horizontal Vertical Horizontal Resultant Rotational
Node L/C X mm Y mm Z mm mm rX rad rY rad rZ rad
15 EQ+X 2.891 1.095 -0.922 3.226 0 0 0
24 1.5X(DEAD+LIVE) 17.599 -822.939 -5.738 823.147 -0.035 0 -0.037
22 1.2X(DEAD+LIVE+SEISMIC) 4.326 -24.306 6.174 25.448 0.007 0 0.006
29 1.5X(DEAD+LIVE) 9.096 -143.095 -2.511 143.406 -0.003 0 -0.034
5 IRC: SLS Class 70R+A Loading 11.414 -100.528 0.978 101.178 0.021 0 0.014
22 IRC: SLS Class 70R+A Loading 17.599 -822.939 -5.738 823.147 -0.035 0 -0.037
Tablel 4.18l Node Displacement Summaryl ofl Midl Spanl 40m
Horizontal Vertical Horizontal Resultant Rotational
Node L/C X mm Y mm Z mm mm rX rad rY rad rZ rad
20 EQ+X 5.912 2.535 -1.099 6.526 0 0 0
20 1.5X(DEAD+LIVE) 8.369 -205.391 -2.955 205.583 -0.006 0 -0.018
23 1.2X(DEAD+LIVE+SEISMIC) 9.279 -40.567 -1.094 41.629 -0.005 0 -0.01
28 1.5X(DEAD+LIVE) 7.2 -78.075 -3.324 78.477 0.001 0 0.018
5 IRC: SLS Class 70R+A Loading 7.692 -78.071 -1.934 78.473 0.011 0 0.015
23 IRC: SLS Class 70R+A Loading 7.333 -104.017 -2.613 104.308 -0.008 0 -0.022
NOTE:
In The Above Comparation we compare the Nodes maximum Displacement on 40m span model and 70m span model). We found that 40 m span models Nodes maximum Displacement is very low compare to 70 m span so we suggested
© 2019, IRJET | Impact Factor value: 7.34 | ISO 9001:2008 Certified Journal
| Page 2118
6.2CONCLUSIONSIn this comparative study we are analyzing curve girder bridge of Total span length is 100 m in which mid span 70m(model 1 ) and 40 m(model 2) with end span of 15 m(model 1) and 30 m(model 2) respectively and in which we are concluded that since the 40 m span curve bridge stability is more and it is cost effective in comparation with 70 m span curve girder Bridge now following comparative analysis has been shown below.
COMPARE TOTAL REINFORCEMENTOF BEAMS IN 40 M & 70 M SPAN MODEL
SPAN REINFORCEMENT RATIO
40 1080.00 QTL 0.663
70 1629.32 QTL
Here it is observed that the variation in Total Reinforcement of Beams in 40 m & 70 m span model is 66% . so we can suggested that 40 m span model is suitable for design and construction as well traffic planning issues also the 40 m span model is economical as compare to 70 m span model.
COMPARE TOTAL REINFORCEMENT OF PIERS IN 40 M & 70 M SPAN MODEL
SPAN REINFORCEMENT RATIO
40 229.05 QTL 0.336
70 681.89l QTL
Here it is observed that the variation in Total Reinforcement of piers in 40 m & 70 m span model is 33% . so we can suggested that 40 m span model is suitable for design and construction as well traffic planning issues also the 40 m span model is economical as compare to 70 m span model.
COMPARE TOTAL CONCRETE QUANTITY IN 40 M & 70 M SPAN MODEL
SPAN CONCRETE RATIO
40 540.00l CU.METER 0.677
70 798.47l CU.METER
Here it is observed that the variation in Total Concrete Quantity in 40 m & 70 m span model is 67% . so we can suggested that 40 m span model is suitable for design and construction as well traffic planning issues also the 40 m span model is economical as compare to 70 m span model.
MAXIMUM SUPPORT REACTION COMPARE BETWEEN 40 M & 70 M SPAN MODEL
SPAN Fx(kN) Fy(kN) Fz(kN) Mx(kNm) My(kNm) Mz(kNm) RATIO
40M 1015.39 34172.93 2341.54 12271.43 506.449 10453.57 0.513 70M 5752 49368.23 12798.544 56243.61 5056.449 33486.26
© 2019, IRJET | Impact Factor value: 7.34 | ISO 9001:2008 Certified Journal
| Page 2119
BEAM MAXIMUM STRESS COMPARE BETWEEN 40 M & 70 M SPAN MODELSPAN Fx(kN) Fy(kN) Fz(kN) Mx(kNm) My(kNm) Mz(kNm) RATIO
40M 34172 2475 2205 1961 12271 22888.09 0.433
70M 49368.23 12102.346 12798.54 3243.753 8137.466 89864.06
Here it is observed that the variation in Axial force (Fx) in 40 m & 70 m span model is 69% . and Shear force (Fy) variation in 40 m & 70 m span model is 20%. And Maximum Bending moment (Mz) variation in 40 m & 70 m span model is 25%. so on the bases of above all variation we can suggested that 40 m span is suitable for design and construction as well traffic planning also the 40 m span model is economical as compare to 70 m span model.
NODES MAXIMUM DISPLACEMENT COMPARE BETWEEN 40 M & 70 M SPAN MODEL
SPAN X mm Y mm Z mm Resultant RATIO
40M 9.279 -205.391 -2.955 205.583 0.254
70M 17.599 -822.939 6.174 823.147
On the basis of all comparision and Rccl Design Resultlforl alll piers & girdersl inl modell withl midl spanl ofl 40l ml arel similarl thatl willl makel constructionl easier.
On the basis of all comparision and Rccldesign Resultforl alll piers & girdersl inl modell withl midl spanl ofl 70l ml arel differentl thatl willl makel constructionl difficult.
Overalll variationl ofl Support Reactionsl forl differentl loadl casesl forl modell withl spanl 40ml isl lowerl thanl modell withl spanl 70m.
Overalll variationl ofl beaml forcesl forl differentl loadl casesl forl modell withl spanl 40ml isl lowerl thanl modell withl spanl 70m.
Overalll variationl ofl beaml stressesl (compressive/tensile)l forl differentl loadl casesl forl modell withl spanl 40ml isl lowerl thanl modell withl spanl 70m.
On the basis of all compression we suggested that 40m span is suitable for that location because the variation of all comparative results of 40m span model is very low as compare to 70 m span.
7. REFERENCES
1. Kuppumanikandan A (2013), parametic studies on major element of an elevated metro bridge,Department of Structural engineering,Nit Rourkela
2. Gupta P.K, Singh KK, Mishra A. (2010). Parametric Study on Behaviour of Box-Girder Bridges using Finite Element Method. Asian Journal of Civil Engineering (Building and Housing), 11(1), 135–148.
3. . IRS Concrete Bridge Code (1997). Code of Practice for Plain, Reinforced & Prestressed Concrete for General Bridge Construction Code. Research Designs and Standards Organisation, Lucknow.
4. IS 13920 (1993). Indian Standard Code of Practice for Ductile Detailing of Reinforced Concrete Structures Subjected to Seismic Forces. Bureau of Indian Standards, New Delhi.
5. IS 1893 Part 1 (2002). Indian Standard Criteria for Earthquake Resistant Design of Structures. Bureau of Indian Standards. New Delhi.
6. IS 456 (2000). Indian Standard for Plain and Reinforced Concrete - Code of Practice. Bureau of Indian Standards. New Delhi.
7. Design Basis Report of Lucknow Metro (2013). Lucknow Metro Rail Corporation Limited. Lucknow(Lmrc).
8. Detailed Project Report of Lucknow Metro (2013). Lucknow Metro Rail Corporation Limited. Lucknow (u.p).
© 2019, IRJET | Impact Factor value: 7.34 | ISO 9001:2008 Certified Journal
| Page 2120
10. Shushkewich, K. W. (1988). Approximate analysis of concrete box girder bridge. J. Struct. Eng., 114 (7), 1644–1657..11. IRC:6-2000; Standard Specifications and code of practice for road bridges; Section II: Loads and Stresses (4th revision); The Indian Roads Congress (New Delhi, 2000).
12 Sisodiya, R. G., Cheung, Y. K., and Ghali, A. (1970). Finite-element analysis of skew, curved box girder bridges. Int. Assoc. Bridges Struct. Eng., (IABSE), 30 (II), 191–199.
13. N. Krishna Raju (2009), “Design of Bridges”, Fourth edition, Oxford and IBH Publishing Co. Pvt. Ltd., India
14. Mahesh Pokhrel (FEBRUARY, 2013), in his study Comparative Study of RCC T girder bridge design using different codes, Nepal
15. Kees Vanamölder (MAY,2017) conducted study in order to evaluate possible structural solutions for bridges in practical case, case-study was performed on the basis of designed Rail Baltic bridge over Pärnu river.
BIOGRAPHIES
Mr Nilesh Shadunkey
P.G. Scholar,Deptt of structural engineering,
Truba institute of Engineering and Information Technology, Rgpv university ,Bhopal,(M.P),INDIA
Rashmi Sakalle