http://www.scirp.org/journal/ajac ISSN Online: 2156-8278
ISSN Print: 2156-8251
Assessment of Minor and Trace Elements in
Aquatic Macrophytes, Soils and Bottom
Sediments Collected along Different Water
Objects in the Black Sea Coastal Zone by Using
Neutron Activation Analysis
Pavel Nekhoroshkov
1, Alexandra Kravtsova
1, Alexander Kamnev
2, Olga Bun’kova
3,
Octavian Duliu
4, Marina Frontasyeva
1, Igor Yermakov
21Frank Laboratory of Neutron Physics, Joint Institute for Nuclear Research, Dubna, Russia 2Faculty of Biology, Lomonosov Moscow State University, Moscow, Russia
3Faculty of Soil Science, Lomonosov Moscow State University, Moscow, Russia
4Department of the Structure of Matter, Earth and Atmospheric Physics, and Astrophysics, Faculty of Physics, University of
Bucharest, Bucharest, Romania
Abstract
The levels and compartmentalization of Na, Mg, Al, Cl, K, Ca, Sc, Ti, V, Cr, Mn, Fe, Co, Ni, Zn, As, Se, Br, Rb, Sr, Mo, Sb, I, Cs, Ba, La, Ce, Sm, Eu, Tb, Hf, Ta, Au, Th, and U in Phragmites australis (Cav.) Trin. ex Steud., Carex conescens L. and Cladophora sericea (Hudson) Kutzing from the Caucasian coast of the Black Sea-Anapa recreational region was investigated by Neutron Activation Analysis. The study touches upon subject of the sediment-to-plant and root-to-leaf elemental transfer as well as of the influence of anthropogenic pollution on wetland ecosystems in zone of resort. The content of the majority of considered elements was found higher in the belowground organs of P. australis than in the aboveground tissues while a reverse regularity was evi-denced for C. conescens. The levels of elements decrease from bottom sedi-ments to aquatic plants with the notable exception of the halogens Cl, Br and I that presented 5 to 100 fold higher content in plants than in sediments. The increased levels of As, Mo, and Sb in some soil and sediment samples most probably indicate the anthropogenic pollution. It recommends them for a continuous monitoring of the same area.
Keywords
Trace Elements, Neutron Activation Analysis, The Black Sea, Phragmites
How to cite this paper: Nekhoroshkov, P., Kravtsova A., Kamnev, A., Bun’kova, O., Duliu, O., Frontasyeva, M. and Yermakov, I. (2017) Assessment of Minor and Trace Elements in Aquatic Macrophytes, Soils and Bottom Sediments Collected along Different Water Objects in the Black Sea Coastal Zone by Using Neutron Activation Analysis. American Journal of Analytical Chemistry, 8, 225-244.
https://doi.org/10.4236/ajac.2017.84018
Received: February 20, 2017 Accepted: April 11, 2017 Published: April 14, 2017
Copyright © 2017 by authors and Scientific Research Publishing Inc. This work is licensed under the Creative Commons Attribution International License (CC BY 4.0).
Australis (Cav.) Trin. ex Steud., Carex conescens L., Cladophora sericea
(Hudson) Kutzing
1. Introduction
The aquatic macrophytes are widely used for assessing the environmental situa-tion in fresh as well as seawater [1]-[10]. As the accumulation of trace metals in organisms depends on the concentration of pollutants in water and sediments as well as on exposure time, a tissue analysis of aquatic macrophytes may provide cumulative evaluation of exposure [1] [6] [11] [12] [13].
The concentrations of chemical elements in aquatic plants can be more than 100,000 times higher than in the associated water [1] [14]. This accumulation ability of certain macrophytes is used for monitoring purposes in relatively clean and recreation zones where low level of contamination might be difficult to detect [15].
Our previous investigations in polluted waters of the Black Sea region [16] [17] [18] evidenced the increased elemental concentrations in marine algae re-flecting their great potential for biomonitoring water quality. They proved not only the existence of a certain degree of anthropogenic contamination but also the suitability of aquatic plants for biomonitoring trace elements.
To extend our studies regarding the elemental content of more than 35 ele-ments for the territory of an important but poor investigated recreation zone of the Caucasian coast of the Black Sea, the aquatic macrophytes Phragmites aus-tralis, Carex conescens L. as well as the green algae Cladophora sericea (Hudson) Kutzing. were used.
P. australis is one of the most distributed macrophytes in aquatic ecosystems, and numerous studies showed its capacity of trace element bioaccumulation [11] [13] [15] [19] [20] [21] [23]. Thus Duman [19] reported that the roots of
As, Fe, K, Mn, Zn in roots [13].
The data of using the species of Carex (sedges) in biomonitoring purposes are scarce in comparison with Phragmites. Horovitz [26] reported the content of Ag, Co, Cr, Cs, Fe, Rb, Sc, Th, Zn and in Carex pendula sampled in botanical garden in Germany. Pederson and Harper [27] studied the chemical composition of some major forage plants of mountain summer ranges of southeastern Utah, USA, reported the content of K, Ca and Mg in Carex geyeri. Ohlson [28] studied the content of Al, Ca, Cu, Fe, K, Na, Mg, Mn, Mo, Zn in eleven plants from the mires of central and north Sweden, and he found that the largest variation in elemental concentration of roots and leaves was observed in Carex rostra. He also reported that the concentration of K in tissues of Carex species was highly correlated with its concentration in the substrate.
The species of green algae of genus Cladophora has frequently been suggested as a suitable organism to monitor water contamination and its practical use in monitoring river, lake and sea pollution has been reported from a range of countries [29]-[34]. Thus Whitton et al. [29] reported that there were highly sig-nificant correlations between Cu, Fe, Zn content in Cladophora glomerata from rivers and streams in Northern England and water. The similar results were re-ported by [31] for Cr, Ni and V determined in Cladophora glomerata from refi-nery sewage lagoon (Bratislava). Levkov and Krstic [33] found that the levels of Co, Cu, Fe, Mn and Zn in Cladophora glomerata reflected their load in the River Vardar, Macedonia, and recommended it as a precise biomonitoring tool for de-termination and quantification of heavy metal pollution in this river. In [34] the distribution patterns of Ca, Cu, K, Mg, Mn, Na, Ni, Zn and in the green algae
Cladophora sp. from the Southern Baltic is assessed. The study concluded that
Cladophora sp. can be used the most successfully as biomonitor of Cu and Zn content in the Baltic Sea because of its ability to accumulate metal contaminants from seawater, tolerance to metals, simple morphology and adequate tissue for analysis.
The preliminary study [13] of elemental composition of Cladophora sericea, collected in the Anapa region in 2013, showed that the plant to soil ratios greater than one and pointing towards a possible contamination process were detected only for As, and Sr.
For our study, we have chosen three types of phototrophic macrophytes as ones of the most convenient organisms-biomonitors. Moreover, they occur in different ecological conditions and are the first ones that take the fall of the coastal pollution runoff [11] [13]. Accordingly, we have investigated the hydro-phyte filamentous marine green alga Cladophora sericea (Hudson) Kutzing, he-lophyte Phragmites australis (Cav.) Trin. Ex Steud as well as the hygrophyte Ca-rex conescens L.
Cladophora sericea lives in shallow sandy areas of the Black Sea; absorbs mi-nor and trace elements by all surface of its body, dosen’t have root system [31],
absorb minor and trace elements from soil, sediment and water by additional roots [15] [20]. Carex conescens L. grows on the banks of the rivers. Unlike
Phragmites australis, it is a plant which has a small root system, so it absorbs minor and trace elements only from the soil [26].
The main goals of the study consist of: 1) quantifying the content of a wide range of major as well as trace elements in Phragmites australis, Carex cones-cens, Cladophora sericea and corresponding soil and bottom sediments samples; 2) assessing the elemental content in different parts of plants (leaves, roots); 3) quantifying the element mobility from sediment to organs, as well as within the plant; 4) providing new data on the geochemistry of sediments and soil from the Anapa region; 5) quantifying the level of the anthropogenic pollution of the study area. The results of this project will be further presented and discussed.
2. Materials and methods
2.1. Study Area and Sampling
A resort city of Anapa (Krasnodar region) located on the Caucasian coast of the Black Sea is characterized by humid subtropical climate and long sandy beach. The Anapka river crossing the territory of the town connects Anapa reed beds with the Black Sea [35].
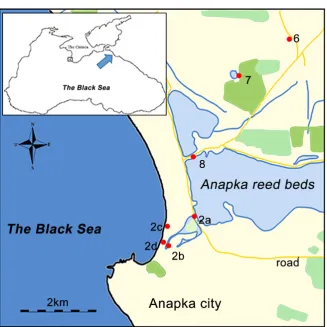
The investigated area (Figure 1, Table 1) includes the municipal waste dump at the Krasnyi hutor and some reservoirs, i.e. a lake, a river and reed beds at the foot of the hill and below the dump situated on the highland. These water bodies form an indivisible watershed of the river Anapka which estuary occupies the main city beach within the city recreation zone. The solid waste city dump of Anapa (Figure 1, st. 6) is located near the Krasnyi hutor, 4.65 km from the Black Sea. During 10 years, the total area of the dump increased from 9 to 26 hectares in 2013 [35]. There is a lake located in the distance of 1 km downhill from the dump at village Krasnyi hutor (Figure 1. st. 7). The next sampling point is Ana-pa reed beds (Figure 1, st. 8). This marshland is situated at the hollow, where the Kotloma and Kumatyr Rivers get its confluence, not far from the Anapa station. The length of the Anapka reed beds (Figure 1, st. 2a) is 1.7 km long. The station 2b is situated in old bed of the Anapka river. The mouth of the Anapka river (Figure 1, st. 2с) is located at the main city beach (Figure 1, st. 2d).
The samples of vegetation (live and dead leaves and roots of Phragmites and
Carex, algae Cladophora) (n = 35) and the corresponding soil (n = 40) and bot-tom sediment (BS) (n = 15) were collected at 7 sites along the transect located near Anapa city in summer of 2013 and 2014. The sampling sites are shown in Figure 1 while Table 1 presents more details regarding the sampling points lo-cation as well as a summary description of each category of samples. The sam-pling of soils, bottom sediments and plants were carried out by using standards manuals [36] [37] for studied region.
2.2. Neutron Activation Analysis
Figure 1. Sampling sites in the studied area near Anapa city (Anapa transect or cross- section).
Table 1. The location of sampling points as well as the type of collected material.
Sampling point Latitude (N) Longitude (E) Type description Summary
6. City dump 44˚57'31.76'' 37˚21'51.01'' Soil Dump without vegetation
7. Lake near Krasnyi Hutor
(village) 44˚56'51.52'' 37˚20'41.70''
Soil Sediments
Plants
Waste liquid disposal, polluted runoff
8. Anapa reed
beds 44˚55'35.97'' 37˚19'47.57''
Soil Sediments
Plants Traffic, Gas station
2a. Anapka river 44˚54'35.84'' 37˚19'45.33'' Sediments Soil
Plants Traffic 2b. Old bed of
Anapka river 44˚54'10.27'' 37˚19'10.18''
Soil Sediments
Plants
Beach, objects of recreation
2c. Mouth of
Anapka river 44˚54'21.59'' 37˚19'06.89''
Soil Sediments
Plants Beach
[image:5.595.206.537.458.731.2]of the Frank Laboratory of Neutron Physics (FLNP) of the Joint Institute for Nuclear Research (JINR), Dubna, Russia. The analytical procedures and the ba-sic characteristics of the employed experimental facility are described in detail elsewhere [38]. The samples of about 0.3 g were packed in polyethylene bags for short-term irradiation and in aluminum cups for long-term irradiation.
To determine the short-lived isotopes of Mg, Al, Cl, Ca, Ti, V, Mn and I the samples were irradiated for 3 min in the reactor channel with a neutron flux density of 1.3·1012 n (cm−2·s−1). Gamma spectra of induced activity were meas-ured for 12 - 15 min after 20 min of decay. The elemental contents of the long-lived isotopes of Na, K, Sc, Cr, Fe, Co, Ni, Zn, As, Se, Br, Rb, Sr, Mo, Sb, Cs, Ba, La, Ce, Sm, Eu, Tb, Hf, Ta, Au, Th, and U were determined using epithermal neutrons in a cadmium-screened irradiation channel with a neutron flux density of 1.6·1012 n cm−2·s−1). Samples were irradiated for 90 h, repacked and then mea- sured twice after 4 - 5 d of decay during 30 minutes and after 20 days of decay during 1.5 hours.
To process gamma spectra of induced activity and to calculate concentrations of elements in the samples, software developed at FLNP, JINR was used [39]. The uncertainties in the determined concentrations were in the range of % - 15%, and of 30% or more for those elements which concentrations in the sam-ples were at the detection limit.
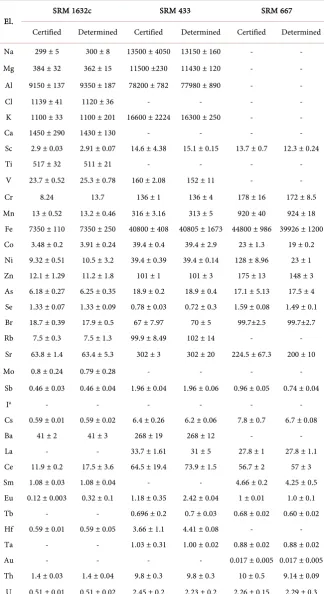
Quality control was provided by using reference materials (SRM): NIST 1632c (trace elements in coal), IAEA-433 (marine sediment), BCR-667 (estuarine se-diment) as well as NIST 1515 (apple leaves) irradiated in the same conditions together with the samples under investigation. We were chosen that set of stan-dards due to the most accurate determined values of concentrations of elements. The NAA data and certified values of reference materials are given in Table 2. Certified values with errors were taken from passports of SRMs, determined values with errors were calculated through neutron activation analysis in the same conditions as samples (more deep explanation is given in [38] [39]).
2.3. Data Analysis
To unify the minor and trace composition of each plant we used the Reference Plant (RP) contents [40] as normalizing factors. In this way, it was possible to compare the distribution of the considered elements in all species of plants cho-sen for the precho-sent study.
Table 2. The NAA data and certified values of reference materials (mean ± error, in µg·g−1 dry weight).
El. SRM 1632c SRM 433 SRM 667
Certified Determined Certified Determined Certified Determined
Na 299 ± 5 300 ± 8 13500 ± 4050 13150 ± 160 - - Mg 384 ± 32 362 ± 15 11500 ±230 11430 ± 120 - - Al 9150 ± 137 9350 ± 187 78200 ± 782 77980 ± 890 - -
Cl 1139 ± 41 1120 ± 36 - - - -
K 1100 ± 33 1100 ± 201 16600 ± 2224 16300 ± 250 - -
Ca 1450 ± 290 1430 ± 130 - - - -
Sc 2.9 ± 0.03 2.91 ± 0.07 14.6 ± 4.38 15.1 ± 0.15 13.7 ± 0.7 12.3 ± 0.24
Ti 517 ± 32 511 ± 21 - - - -
V 23.7 ± 0.52 25.3 ± 0.78 160 ± 2.08 152 ± 11 - - Cr 8.24 13.7 136 ± 1 136 ± 4 178 ± 16 172 ± 8.5 Mn 13 ± 0.52 13.2 ± 0.46 316 ± 3.16 313 ± 5 920 ± 40 924 ± 18 Fe 7350 ± 110 7350 ± 250 40800 ± 408 40805 ± 1673 44800 ± 986 39926 ± 1200 Co 3.48 ± 0.2 3.91 ± 0.24 39.4 ± 0.4 39.4 ± 2.9 23 ± 1.3 19 ± 0.2 Ni 9.32 ± 0.51 10.5 ± 3.2 39.4 ± 0.39 39.4 ± 0.14 128 ± 8.96 23 ± 1 Zn 12.1 ± 1.29 11.2 ± 1.8 101 ± 1 101 ± 3 175 ± 13 148 ± 3 As 6.18 ± 0.27 6.25 ± 0.35 18.9 ± 0.2 18.9 ± 0.4 17.1 ± 5.13 17.5 ± 4 Se 1.33 ± 0.07 1.33 ± 0.09 0.78 ± 0.03 0.72 ± 0.3 1.59 ± 0.08 1.49 ± 0.1 Br 18.7 ± 0.39 17.9 ± 0.5 67 ± 7.97 70 ± 5 99.7±2.5 99.7±2.7 Rb 7.5 ± 0.3 7.5 ± 1.3 99.9 ± 8.49 102 ± 14 - - Sr 63.8 ± 1.4 63.4 ± 5.3 302 ± 3 302 ± 20 224.5 ± 67.3 200 ± 10 Mo 0.8 ± 0.24 0.79 ± 0.28 - - - -
Sb 0.46 ± 0.03 0.46 ± 0.04 1.96 ± 0.04 1.96 ± 0.06 0.96 ± 0.05 0.74 ± 0.04
Ia - - - - - -
Cs 0.59 ± 0.01 0.59 ± 0.02 6.4 ± 0.26 6.2 ± 0.06 7.8 ± 0.7 6.7 ± 0.08 Ba 41 ± 2 41 ± 3 268 ± 19 268 ± 12 - - La - - 33.7 ± 1.61 31 ± 5 27.8 ± 1 27.8 ± 1.1 Ce 11.9 ± 0.2 17.5 ± 3.6 64.5 ± 19.4 73.9 ± 1.5 56.7 ± 2 57 ± 3 Sm 1.08 ± 0.03 1.08 ± 0.04 - - 4.66 ± 0.2 4.25 ± 0.5 Eu 0.12 ± 0.003 0.32 ± 0.1 1.18 ± 0.35 2.42 ± 0.04 1 ± 0.01 1.0 ± 0.1 Tb - - 0.696 ± 0.2 0.7 ± 0.03 0.68 ± 0.02 0.60 ± 0.02 Hf 0.59 ± 0.01 0.59 ± 0.05 3.66 ± 1.1 4.41 ± 0.08 - - Ta - - 1.03 ± 0.31 1.00 ± 0.02 0.88 ± 0.02 0.88 ± 0.02 Au - - - - 0.017 ± 0.005 0.017 ± 0.005 Th 1.4 ± 0.03 1.4 ± 0.04 9.8 ± 0.3 9.8 ± 0.3 10 ± 0.5 9.14 ± 0.09
U 0.51 ± 0.01 0.51 ± 0.02 2.45 ± 0.2 2.23 ± 0.2 2.26 ± 0.15 2.29 ± 0.3
aI concentration was determined using SRM 1515 (apple leaves): certified value 0.3 ± 0.09; determined
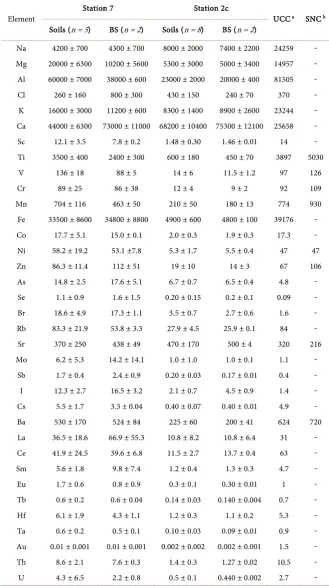
[image:7.595.211.536.102.697.2]Table 3. The average for 2013-2014 years elemental content of soils and bottom sedi- ments (BS) for two different stations of Anapa region, upper continental crust (UCC) and average soils of the North Caucasus (SNC) (mean ± standard deviation, µg/g dry weight).
Element Station 7 Station 2c UCC a SNC b
Soils (n = 5) BS (n = 2) Soils (n = 8) BS (n = 2)
Na 4200 ± 700 4300 ± 700 8000 ± 2000 7400 ± 2200 24259 ‒ Mg 20000 ± 6300 10200 ± 5600 5300 ± 3000 5000 ± 3400 14957 ‒ Al 60000 ± 7000 38000 ± 600 23000 ± 2000 20000 ± 400 81505 ‒ Cl 260 ± 160 800 ± 300 430 ± 150 240 ± 70 370 ‒ K 16000 ± 3000 11200 ± 600 8300 ± 1400 8900 ± 2600 23244 ‒ Ca 44000 ± 6300 73000 ± 11000 68200 ± 10400 75300 ± 12100 25658 ‒ Sc 12.1 ± 3.5 7.8 ± 0.2 1.48 ± 0.30 1.46 ± 0.01 14 ‒ Ti 3500 ± 400 2400 ± 300 600 ± 180 450 ± 70 3897 5030 V 136 ± 18 88 ± 5 14 ± 6 11.5 ± 1.2 97 126 Cr 89 ± 25 86 ± 38 12 ± 4 9 ± 2 92 109 Mn 704 ± 116 463 ± 50 210 ± 50 180 ± 13 774 930 Fe 33500 ± 8600 34800 ± 8800 4900 ± 600 4800 ± 100 39176 ‒ Co 17.7 ± 5.1 15.0 ± 0.1 2.0 ± 0.3 1.9 ± 0.3 17.3 ‒ Ni 58.2 ± 19.2 53.1 ±7.8 5.3 ± 1.7 5.5 ± 0.4 47 47 Zn 86.3 ± 11.4 112 ± 51 19 ± 10 14 ± 3 67 106 As 14.8 ± 2.5 17.6 ± 5.1 6.7 ± 0.7 6.5 ± 0.4 4.8 ‒
Se 1.1 ± 0.9 1.6 ± 1.5 0.20 ± 0.15 0.2 ± 0.1 0.09 ‒ Br 18.6 ± 4.9 17.3 ± 1.1 3.5 ± 0.7 2.7 ± 0.6 1.6 ‒ Rb 83.3 ± 21.9 53.8 ± 3.3 27.9 ± 4.5 25.9 ± 0.1 84 ‒ Sr 370 ± 250 438 ± 49 470 ± 170 500 ± 4 320 216 Mo 6.2 ± 5.3 14.2 ± 14.1 1.0 ± 1.0 1.0 ± 0.1 1.1 ‒
Sb 1.7 ± 0.4 2.4 ± 0.9 0.20 ± 0.03 0.17 ± 0.01 0.4 ‒ I 12.3 ± 2.7 16.5 ± 3.2 2.1 ± 0.7 4.5 ± 0.9 1.4 ‒ Cs 5.5 ± 1.7 3.3 ± 0.04 0.40 ± 0.07 0.40 ± 0.01 4.9 ‒ Ba 530 ± 170 524 ± 84 225 ± 60 200 ± 41 624 720 La 36.5 ± 18.6 66.9 ± 55.3 10.8 ± 8.2 10.8 ± 6.4 31 ‒ Ce 41.9 ± 24.5 39.6 ± 6.8 11.5 ± 2.7 13.7 ± 0.4 63 ‒ Sm 5.6 ± 1.8 9.8 ± 7.4 1.2 ± 0.4 1.3 ± 0.3 4.7 ‒ Eu 1.7 ± 0.6 0.8 ± 0.9 0.3 ± 0.1 0.30 ± 0.01 1 ‒ Tb 0.6 ± 0.2 0.6 ± 0.04 0.14 ± 0.03 0.140 ± 0.004 0.7 ‒ Hf 6.1 ± 1.9 4.3 ± 1.1 1.2 ± 0.3 1.1 ± 0.2 5.3 ‒ Ta 0.6 ± 0.2 0.5 ± 0.1 0.10 ± 0.03 0.09 ± 0.01 0.9 ‒ Au 0.01 ± 0.001 0.01 ± 0.001 0.002 ± 0.002 0.002 ± 0.001 1.5 ‒ Th 8.6 ± 2.1 7.6 ± 0.3 1.4 ± 0.3 1.27 ± 0.02 10.5 ‒ U 4.3 ± 6.5 2.2 ± 0.8 0.5 ± 0.1 0.440 ± 0.002 2.7 ‒
aelements in the average UCC according to [41],belements in soils of the North Caucasus according to
[image:8.595.206.536.117.704.2]For a better description of the local conditions for each sampling site, we de-termined the content of the same elements in soil as well as in sediments. This procedure were used for a more complete analysis of the distribution of elemen-tal content of all considered elements in plants, soil and sediments collected from the Anapa region. In that case, standard deviations reflected the variability of values based on sets of samples.
Besides the above mentioned statistical analysis techniques, we have also used some graphic analysis procedure such as the ternary diagrams. They allowed re-vealing at which extent the content of Cl, Br and I could be used to discriminate the different species of studied plants. All computations were performed using the Libre Office 5.0.2 and Past 3.0 [42] as well as OriginTM 8, Statsoft Statisti-caTM 11.
3. Results and Discussion
3.1. Accumulation of Elements in Soils and Bottom Sediments
The levels of the minor and trace elements in soils and sediments from two sta-tions located at 1 km (station 7) and 4 km (station 2c) from the city dump is given in Table 3 where you can see the statistical stability of the data as well. The content of the same elements in the average UCC [41] and the levels of some elements in soils of the North Caucasus [43] are listed.
The average values from 2013-2014 years were calculated from two different sets of data. Standard deviations reflected the variability of values through neu-tron activation analysis of samples.
The determined concentrations of the majority of elements in soils and BS for each station belonged to close ranges. In that case, we would contemplate these milieus for plants as one. For further analysis, the average values were calculated as arithmetic means for soils (data from surface and from 0 - 20, 20 - 40, 40 - 60 cm layers) and bottom sediments (only from surface). The standard deviation for joint is given on the Figure 2.
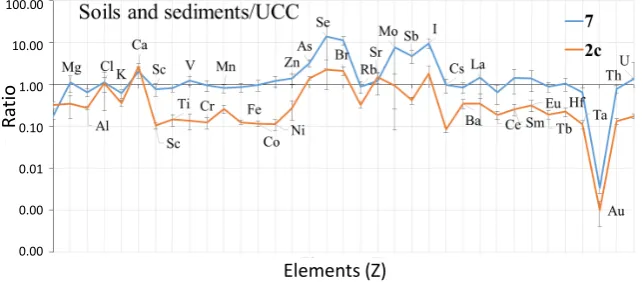
[image:9.595.212.534.560.701.2]As follows from Table 3, Se, Br, and I concentrations in soils and BS from both stations (Figure 2) are higher than in UCC. It can be explained by the loca-
Figure 2. The diagram of the elemental content in soils and sediments normalized on
UCC for 7 and 2c stations. 100.00
10.00
1.00
0.10
0.01
0.00
0.00
Rat
io
tion of Anapa region near the sea and the fact that atmospheric supply from the marine environment is the predominant source of these elements in the soil [44] [45]. As described in [46] [47] soil contamination may be considered when con-centrations of an element in soils were two-to three times greater than the mean background levels. For our study station 7 (the closest to city dump) hypotheti-cally was the most polluted and the station 2c which situated on the shore was used as background for whole transect. The increasing levels of As, Mo, and Sb in soils and BS from the most polluted station 7 probably indicates the anthro-pogenic pollution with these elements. Increasing trend of levels of elements from the relatively pristine to polluted area probably ensue from influences of local disposal dump and traffic impacts.
The concentrations of all elements (except for V and Ni) reported by Dya-chenko et al. [43] for the soils of the North Caucasus are higher than those de-termined in the soil samples from the most polluted station 7 near city dump of Anapa.
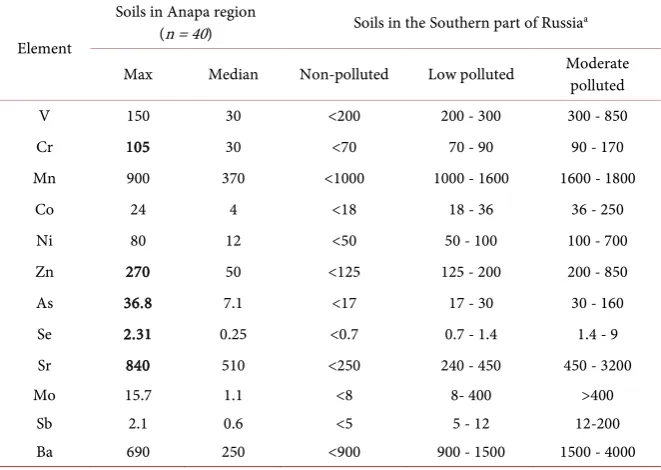
Our data were also compared to results of [48] who determined in laboratory conditions the levels of several elements for non-polluted, low polluted and moderate polluted soil from the Southern part of Russia using the integral index of biological state of soil (Table 4). It helps to realize the level of local differences in elemental content of soils from the standard levels for whole region.
[image:10.595.208.539.476.711.2]The maximal concentrations of Cr, Zn, As, Se and Sr in soils of Anapa region that were determined at the stations 6 and 7 (the nearest to city dump) are simi-lar with the values reported for moderate polluted soils. Nevertheless all median
Table 4. Maximal and median elemental concentrations (µg/g dry weight) in soils from
Anapa region (our data) and values for non-polluted and polluted soils from the Sou- thern part of Russia.
Element
Soils in Anapa region
(n = 40) Soils in the Southern part of Russiaa
Max Median Non-polluted Low polluted Moderate polluted
V 150 30 <200 200 - 300 300 - 850 Cr 105 30 <70 70 - 90 90 - 170 Mn 900 370 <1000 1000 - 1600 1600 - 1800
Co 24 4 <18 18 - 36 36 - 250
Ni 80 12 <50 50 - 100 100 - 700 Zn 270 50 <125 125 - 200 200 - 850 As 36.8 7.1 <17 17 - 30 30 - 160 Se 2.31 0.25 <0.7 0.7 - 1.4 1.4 - 9 Sr 840 510 <250 240 - 450 450 - 3200
Mo 15.7 1.1 <8 8- 400 >400
Sb 2.1 0.6 <5 5 - 12 12-200
Ba 690 250 <900 900 - 1500 1500 - 4000
aelements in soil according to [48]. The concentration of elements which relate to moderate polluted
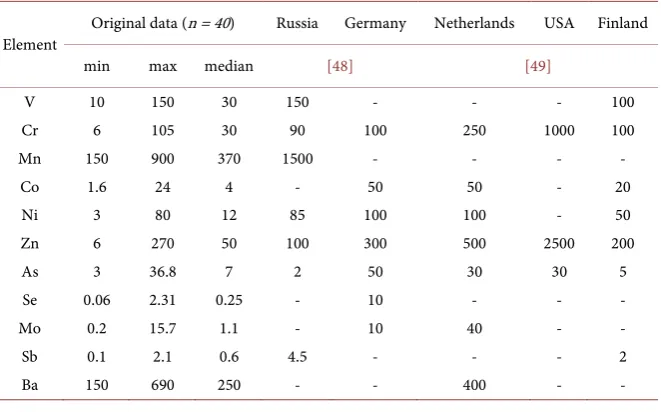
values of studied elements (except for Sr) in soils of Anapa region are within the range of concentrations determined for non-polluted soils (Table 4) and less than maximum permissible levels of elements established in different countries (Table 5) [49]. Data of maximum permissible levels is widely used for ecological management in assessment of environmental impacts. It was concluded that the soils in study region were in low-polluted state despite the sources of anthropo-genic stress.
3.2. Accumulation and Compartmentalization of Elements in
Water and Coastal-Aquatic Plants
The data about accumulation of elements in different organs of plants were ana-lyzed at the all stations, but after that, the average levels of elemental concentra-tions for whole Anapa region were calculated as arithmetic mean values ob-tained from all sampling stations. It helped to realize the ability of different spe-cies of plants to reflect the chemical features of environment, including the local pollution influences.
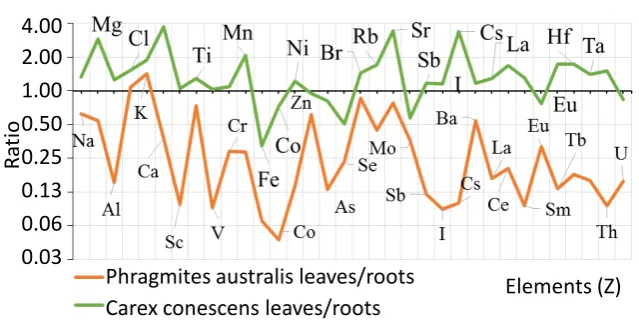
The concentrations of all elements determined (except for K and Cl) are high-er in roots of P. australis than in leaves. In particular, the leaf/root ratios range from 0.86 for Br to 0.05 for Co (Figure 3). For Sc, V, Fe, Co, I, Cs, Sm and Th the root concentrations are one order of magnitude higher than concentrations in leaf. The obtained results confirm the data that Phragmites australis is preva-lently a root bioaccumulator species [11] [13] [15] [20]. It is well known that roots are generally the main pathway of trace elements to plants. However, other tissues of P. australis, in particular, leaves, show the ability readily to translocate such elements as Na, Ti, Zn, Br, and Sr [15].
[image:11.595.209.540.535.741.2]In contrast to P. australis, the concentrations of all elements, except for Fe, Se, Mo, Eu and U are higher in leaves of Carex conescens than in roots (Figure 3). Our results emphasized the differences between accumulation features of these
Table 5. Maximum permissible levels of elements in soils established in different coun-
tries.
Element Original data (n = 40) Russia Germany Netherlands USA Finland
min max median [48] [49]
V 10 150 30 150 - - - 100
Cr 6 105 30 90 100 250 1000 100
Mn 150 900 370 1500 - - - -
Co 1.6 24 4 - 50 50 - 20
Ni 3 80 12 85 100 100 - 50
Zn 6 270 50 100 300 500 2500 200
As 3 36.8 7 2 50 30 30 5
Se 0.06 2.31 0.25 - 10 - - -
Mo 0.2 15.7 1.1 - 10 40 - -
Sb 0.1 2.1 0.6 4.5 - - - 2
Figure 3. Average differences between leaves/roots ratios for Phragmites australis and
Carex conescens.
two species. The Carex conescens could be used as a good bioconcentrator of majority of elements from soils and bottom sediments but P. australis could be used as a good comparative biomonitor (root type) in clean and polluted areas due to its self-cleaning processes.
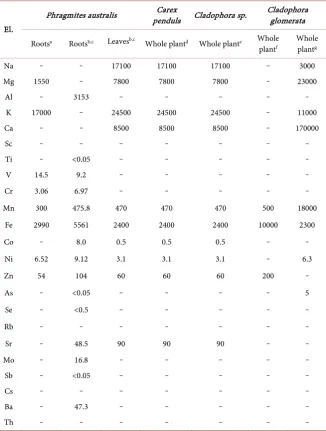
The obtained results were compared to the available data for Phragmites, Ca-rex, and Cladophora, reported by other authors (Table 6) to represent the varia-bility of concentrations in different regions. The concentrations of most ele-ments in leaves and roots of Phragmites australis sampled in the mountain lake in Italy [20] and in the mouth of the longest Sicilian river [15] [20] are higher compared to our results. The exceptions are Ti, Mn, As, Sb and Ti, V, As, Se, which values in roots and leaves, respectively, are higher in the present study. The values of Co, Zn, Rb, and Th in Carex pendula sampled in Germany in bo-tanical garden [26] are higher than our data; the reverse trend is observed for Sc, Cr, Fe and Cs. The elemental content of Cladophora reported by different au-thors varies in a wide range depending on the sampling region and the species. Thus, the levels of Mg, Ca and Mn in Cladophora glomerata from the lake Kara-sevoe in Siberia are one order of magnitude higher compared to our results [51]. In contrast, the content of Ca, Co and Ni in Cladophora sp. from the Baltic Sea [52] is one order of magnitude lower than those determined in the present study. The levels of Fe and Zn in Cladophora glomerata sampled in the Danube river [53] are 2-fold higher than our data. Thus, the exact concentrations of elements in studied species are absent or not widely available. As a result, it is necessary to determine the range of variability in different pollution conditions.
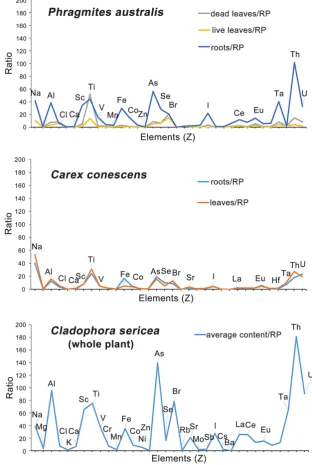
According to the wide variability of elemental content of studied plants across the regions we normalized our data on values for so called reference plant for comparative analysis. The results of normalized elemental concentrations against Reference Plant (RP) show that roots and leaves of P. australis are good accumulators of Na, Ti, and Br and, in contrast, contain lower levels of Zn, Rb, and Ba than RP (Figure 4). In Carex roots and leaves the levels of Na, Ti, As, Th, and U are one order of magnitude higher than in RP. In contrast, Mg, K, Mn,
Rat
io
4.00
2.00
1.00
0.50
0.25
0.13
0.06
0.03
Elements (Z)
Phragmites australis leaves/roots
Table 6. Elemental content of different species of Phragmites, Carex and Cladophora
(µg·g−1 dry weight).
El.
Phragmites australis pendula Cladophora sp. Carex Cladophora glomerata
Rootsa Rootsb,c Leavesb,c Whole plantd Whole plante Whole
plantf Whole plantg
Na ‒ ‒ 17100 17100 17100 ‒ 3000
Mg 1550 ‒ 7800 7800 7800 ‒ 23000
Al ‒ 3153 ‒ ‒ ‒ ‒ ‒
K 17000 ‒ 24500 24500 24500 ‒ 11000
Ca ‒ ‒ 8500 8500 8500 ‒ 170000
Sc ‒ ‒ ‒ ‒ ‒ ‒ ‒
Ti ‒ <0.05 ‒ ‒ ‒ ‒ ‒
V 14.5 9.2 ‒ ‒ ‒ ‒ ‒
Cr 3.06 6.97 ‒ ‒ ‒ ‒ ‒
Mn 300 475.8 470 470 470 500 18000 Fe 2990 5561 2400 2400 2400 10000 2300
Co ‒ 8.0 0.5 0.5 0.5 ‒ ‒
Ni 6.52 9.12 3.1 3.1 3.1 ‒ 6.3
Zn 54 104 60 60 60 200 ‒
As ‒ <0.05 ‒ ‒ ‒ ‒ 5
Se ‒ <0.5 ‒ ‒ ‒ ‒ ‒
Rb ‒ ‒ ‒ ‒ ‒ ‒ ‒
Sr ‒ 48.5 90 90 90 ‒ ‒
Mo ‒ 16.8 ‒ ‒ ‒ ‒ ‒
Sb ‒ <0.05 ‒ ‒ ‒ ‒ ‒
Cs ‒ ‒ ‒ ‒ ‒ ‒ ‒
Ba ‒ 47.3 ‒ ‒ ‒ ‒ ‒
Th ‒ ‒ ‒ ‒ ‒ ‒ ‒
a[20], b[15], c[49], d[26], e[52], f[53], g[51].
Zn, Rb, Cs, and Ba show lower levels in comparison to RP concentrations (Figure 4). The concentrations of the majority of elements in algae Cladophora
are at least one order of magnitude higher than in RP. The levels of Zn and Rb, that are lower than RP concentrations, become the exception (Figure 4).
The different composition of Phragmites australis and Carex conescens with
[image:13.595.211.538.101.533.2]Figure 4. Studied plant/Reference plant ratios for different parts of Phragmites australis,
Carex conescens and Cladophora sericea.
The similar patterns of elemental accumulation for all three species are found for several elements. Thus, the levels of Na, Ti and Br are higher than in RP; the reverse trend is revealed for Zn and Rb. It could be explained by abundance or lower concentrations of mentioned elements in the surrounding environment (soils, BS).
3.3. Transport of Minor and Trace Elements from Bottom
Sediments to Plants
be-tween species accumulation with taking into account the type of accumulation (roots for P. australis and live leaves for C. conescens) were represented by nor-malizing concentrations of elements in plants from the same station (2c) on val-ues in bottom sediments (Figure 5). BS was used as a milieu, which at the same station reflects the local elemental fingerprint of water and other components.
It is known that most rooted macrophytes uptake chemicals primarily from sediment pore water [15], but it is also reported that some rooted submersed plants may absorb metals directly from water when they are not readily available in sediments and/or in high concentrations in the surroundings [55]. The one more way of coming the elements to plants is an uptake mechanism of them from air. Plants may absorb Cl, Br, and I directly from the atmosphere; and the marine environment is the main source of these halogens for plants [45] [53].
It is found that the levels of Br and I in algae Cladophora are higher than in
Phragmites and Carex (Figure 4). Our results are in agreement with the state-ment that algae are one of the best accumulators of these elestate-ments [56].
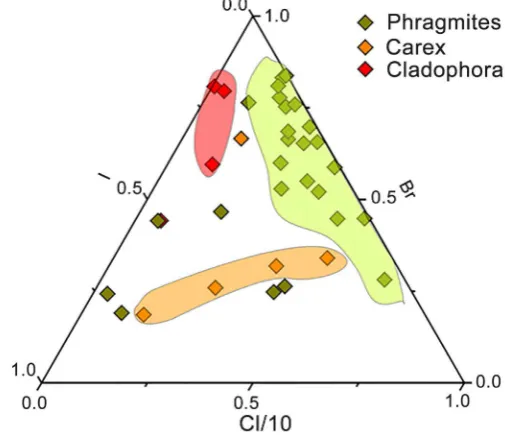
To reveal the differences of halogens accumulation in Phragmites, Carex and
Cladophora the ternary diagram for the levels of Cl (Cl/10), Br and I in plants normalized against content of these elements in sediments is built (Figure 6). After that for ternary diagram the values was proportionally reduced to relative units (by using OriginTM 8). Phragmites is characterized by high levels of Cl at the majority of sampling sites. In Carex the content of Br is equal at all stations except one. Cladophora is characterized by high levels of Br and I, while the content of Cl is the minimal. These results demonstrate the specific accumula-tion features of plants. For example Cladophora sericea accumulates Cl in small relative amounts in comparison to Br and I. Phragmites australis in the major cases selects I and Cl regardless Br. In that sense the Carex conescens demon-strates the most flexible ability for accumulation of these halogens.
4. Conclusions
• The similarity in elemental concentration in soils and sediments at the ma-jority of sampling stations is established (Table 3). Sediments act as the pri-mary source of elements for water plants. Regarding Cl, Br and I, the atmos-pheric supply from the marine environment is the predominant source. The concentration of majority of elements in soils of Anapa region are corres-ponded to values reported for non-polluted zones. The exceptions are the most polluted stations (6 and 7) near city dump, where elemental levels are several times higher if compared to median values.
• The study shows that Phragmites australis is prevalently a root bioaccumula-tor species; in contrast, the concentrations of all elements except for Fe, Se and Mo are higher in leaves of Carex conescens than in roots.
Figure 5. The elemental content of Phragmites australis, Carex conescens and Clado- phora sericea normalized against bottom sediments (station 2c).
Figure 6. Ternary diagram for concentrations of Cl (Cl/10), Br and I for Phragmites
australis, Carex conescens and Cladophora sericea normalized against content of these elements in sediments (BS). With some exceptions (Phragmites samples), all other points form three distinct clusters corresponding to each type of plant.
• Translocation of elements varies depending on the physiological property of elemental uptake and is generally more intense through plant tissues than from sediments to plants. Leaves of Phragmites australis show the ability to translocate such elements as Na, Ti, Zn, Br, and Sr. Among the determined elements the highest translocation between roots and leaves of Carex cones-cens is found for Sc, V, Cr, and Zn.
• The results of normalized elemental concentrations against Reference Plant show that roots and leaves of Phragmites australis are good accumulators of Na, Ti, and Br and, in contrast, contain lower levels of Zn, Rb, and Ba than RP. In Carex conescens roots and leaves the levels of Na, Ti, As, Th, and U
Carex conescens live leaves/BS Cladophora sericea whole plant/BS
Phragmites autralis roots/BS 128.00
[image:16.595.246.499.288.506.2]are one order of magnitude higher than in RP. In contrast, Mg, K, Mn, Zn, Rb, Cs, and Ba show lower levels in comparison to RP concentrations. The concentrations of the majority of elements in algae Cladophora sericea. are at least one order of magnitude higher than in RP.
• Cladophora sericea accumulated Cl in small relative amounts in comparison to Br and I. Phragmites australis in the major cases selected I and Cl regard-less Br. In that sense the Carex conescens demonstrated the most flexible ability for accumulation of these halogens.
• The found ratios BS to plants demonstated the different ability of this three species to reflect the local elemental fingerprints. The levels of majority of elements in Phragmites australis, Carex conescens, Cladophorasericea could be used in future biomonitoring studies on local and regional scales. These plants are potentially useful for monitoring of pollution in general, and for the most elements examined in particular.
References
[1] Burdin, K.S. (1985) The Basis of Biological Monitoring. MSU, Moscow.
[2] Burdin, K.S., Gavrilenko, E.E., Zolotukhina, E.Y., Kamnev, A.N., Krupina, M.V., et al. (1988) Study of the Macrophytes of the Seas of the USSR as Biomonitoring Ob-jects of Heavy Metals in the Sea Water. Ocean Biology. 16-25. (In Russian)
[3] Burdin, K.S., Voskoboinikov, G.M., Zubov, E.V., Kamnev, A.N., et al. (1993) Ma-rine Macroalgae as Monitoring Objects. In: Arctic Ocean: bioindication, Environ-mental State, Bioassay and the Waste Destruction Technology. MMBI RAS, Apatity, 72-81. (In Russian)
[4] Kamnev, A.N. (1989) Structure and Functions of the Brown Algae. MSU, Mos-cow.
[5] Vozžinskaya, V.B. and Kamnev, A.N. (1994) Ecological and Biological Foundations of Cultivation and Utilization of Marine Benthic Algae. Nauka, Moscow.
[6] Phillips, D.J.H. and Rainbow, P.S. (1994) Biomonitoring of Trace Aquatic Conta-minants. 2nd Edition, Chapman and Hall, London.
[7] Wang, W., Gorsuch, J.W. and Hughes, J.S. (1997) Plants for Environmental Studies. CRC Press, New York.https://doi.org/10.1201/9781420048711
[8] Gerhardt, A. (2000) Biomonitoring of Polluted Water. Trans Tech Publications, Zu-rich.
[9] Markert, B., Breure, T. and Zechmeister, H. (2003) Bioindicators and Biomoni-tors—Principles, Concepts and Applications. Elsevier, Amsterdam.
[10] Marques, J.C., Salas, F., Patrício, J., Teixeira, H. and Neto, J.M. (2009) Ecological Indicators for Coastal and Estuarine Environmental Assessment—A User Guide. WIT Press, Southampton.
[11] Kamnev, A.N., Frontasyeva, M.V., Kravtsova, A.V., Nekhoroshkov, P.S., Bun’kova, O.M., et al. (2014) Assessment of Elemental Composition of Macrophytes, Soil and Bottom Sediments along a Transect in the Coastal Zone of Anapa, Studied by Neu-tron Activation Analysis. Proceedings of the International Conference Ecological Physiology of Aquatic Phototrophic: Distribution, Stocks, Chemical Composition and Use, 3S (7S). http://algology.ru/647
[13] Kamnev, A.N., Bunkova, O.M., Bogatyrev, L.G., Stukolova, I.V. and Yakovlev, A.S. (2015) Sabinin’s Ideas and Their Embodiment. Mineral Composition of Macro-phytes Is One of the Most Important Indicator of Their Contribution to a Biogeo-chemical Exchange of the World Ocean. Issues of Modern Algology, 3. (In Russian) [14] Albers, P.H. and Camardese, M.B. (1993) Effects of Acidification on Metal Accu-mulation by Aquatic Plants and Invertebrates. 1. Constructed Wetlands. Environ-mental Toxicology and Chemistry, 12, 959-967.
https://doi.org/10.1002/etc.5620120602
[15] Bonanno, G. (2011) Trace Element Accumulation and Distribution in the Organs of
Phragmites australis (Common Reed) and Biomonitoring Applications. Ecotox-icology and Environmental Safety, 74, 1057-1064.
[16] Bun’kova, O., Kamnev, A., Yakovlev, A., Suhova, T. and Shahpenderyan, E. (2014) Studying of Mineral Structure of Cystoseira barbata in a Sublittoral Zone of the Northeast Coast of the Black Sea. Proceedings of World Conference on Marine Bio-diversity, Qingdao, 12-16 October 2014.
[17] Kravtsova, A.V., Milchakova, N.A. and Frontasyeva, M.V. (2015) Levels, Spatial Variation and Compartmentalization of Trace Elements in Brown Algae Cystoseira from Marine Protected Areas of Crimea (Black Sea). Marine Pollution Bulletin, 97, 548-554.
[18] Pankova, E.S., Kamnev, A.N. and Golubeva, E.I. (2015) Features of the Distribution of Heavy Metals in Brown Algae Cystoseira barbata (Anapa District of Krasnodar Region, Russia). International Popular Science Journal Europe-Asia. Earth Sciences, 5, 25-28.
[19] Duman, F., Cicek, M. and Sezen, G. (2007) Seasonal Changes of Metal Accumula-tion and DistribuAccumula-tion in Common Club Rush (Schoenoplectus lacustris) and Common Reed (Phragmites australis). Ecotoxicology, 16, 457-463.
https://doi.org/10.1007/s10646-007-0150-4
[20] Baldantoni, D., Ligrone, R. and Alfani, A. (2009) Macro- and Trace-Element Con-centrations in Leaves and Roots of Phragmites australis in a Volcanic Lake in Southern Italy. Journal of Geochemical Exploration, 101, 166-174.
[21] Maddison, M., Soosaar, K., Mauring, T. and Mander, U. (2009) The Biomass and Nutrient and Heavy Metal Content of Cattails and Reeds in Wastewater Treatment Wetlands for the Production of Construction Material in Estonia. Desalination, 246, 120-128.
[22] Bonanno, G. (2013) Comparative Performance of Trace Element Bioaccumulation and Biomonitoring in the Plant Species Typha domingensis, Phragmites australis
and Arundo donax. Ecotoxicology and Environmental Safety, 97, 124-130.
[23] Štrbac, S., Šajnović, A., Kašanin Grubin, M., Vasić, N., Dojčinović, B., et al. (2014) Metals in Sediment and Phragmites australis (Common Reed) from Tisza River, Serbia. Applied Ecology and Environmental Research, 12, 105-122.
https://doi.org/10.15666/aeer/1201_105122
[24] Bragato, C., Schiavon, M., Polese, R., Ertani, A., Pittarello, M., et al. (2009) Seasonal Variations of Cu, Zn, Ni and Cr Concentration in Phragmites australis (Cav.) Trin. ex Steud. in a Constructed Wetland of North Italy. Desalination, 246, 35-44. [25] Ahmad, S.S., Reshi, Z.A., Shah, M.A., Rashid, I., Ara, R., et al. (2014)
Phytoremedia-tion Potential of Phragmites australis in Hokersar Wetland—A Ramsar Site of Kashmir Himalaya. International Journal of Phytoremediation, 16, 1183-1191. https://doi.org/10.1080/15226514.2013.821449
Plant and Soil, 40, 397-403.https://doi.org/10.1007/BF00011522
[27] Pederson, J.C. and Harper, K.T. (1979) Chemical Composition of Some Important Plants of Southeastern Utah Summer Ranges Related to Mule Deer Reproduction.
The Great Basin Naturalist, 39, 122-128.
[28] Ohlson, M. (1988) Variation in Tissue Element Concentration in Mire Plants over a Range of Sites. Ecography, 11, 267-279.
https://doi.org/10.1111/j.1600-0587.1988.tb00809.x
[29] Whitton, B.A., Burrows, I.G. and Kelly, M.G. (1989) Use of Cladophora glomerata
to Monitor Heavy Metals in Rivers. Journal of Applied Phycology, 1, 293-299. https://doi.org/10.1007/BF00003464
[30] Malea, P., Haritonidis, S. and Kevrekidis, T. (1995) Metal Content of Some Green and Brown Seaweeds from Antikyra Gulf (Greece). Hydrobiologia, 310, 19-31. https://doi.org/10.1007/BF00008180
[31] Chmielewská, E. and Medved, J. (2001) Bioaccumulation of Heavy Metals by Green Algae Cladophora glomerata in a Refinery Sewage Lagoon. Croatica Chemica Acta, 74, 135-145.
[32] Vershinin, A. and Kamnev, A. (2001) Harmful Algae in Russian European Coastal Waters. Proceedings of 9th International Conference on Harmful Algal Blooms, Hobart, 7-11 February 2001.
[33] Levkov, Z. and Krstic, S. (2003) Use of Algae for Monitoring of Heavy Metals in the River Vardar, Macedonia. Mediterranean Marine Science, 3, 99-102.
[34] Żbikowski, R., Szefer, P. and Latała, A. (2007) Comparison of Green Algae Clado-phora sp. and Enteromorpha sp. as Potential Biomonitors of Chemical Elements in the Southern Baltic. Science of the Total Environment, 387, 320-332.
[35] Pogorelov, A.V., Dulepa, S.V. and Lipilin, D.A. (2013) The Space Monitoring on the Territory of the Krasnodar Region. Geomatics, 4, 64-71.
[36] GOST (State Standard) 17.4.4.02-84: Nature Protection. Soils. Methods of Sampling and Preparation of Material for Chemical, Bacteriological, and Helminthological Analysis. (In Russian)
[37] GOST (State Standard) 17.1.5.01-80: Nature Protection. Hydrosphere. General Re-quirements for Sampling of Bottom Sediments of Water Objects for Their Pollution Analysis. (In Russian)
[38] Frontasyeva, M.V. (2011) Neutron Activation Analysis for the Life Sciences. A Re-view. Physics of Elementary Particles and Atomic Nuclei, 42, 332-378.
[39] Dmitriev, A.Y. and Pavlov, S.S. (2013) Automated Quantitative Determination of Elements in Samples by Neutron Activation Analysis at the IBR-2 at LNP JINR.
Phisika elementarnikh chastits i atomnogo yadra, 10, 58-64.
[40] Markert, B. (1992) Establishing of “Reference Plant” for Inorganic Characterization of Different Plant Species by Chemical Fingerprinting. Water, Air, and Soil Pollu-tion, 64, 533-538.https://doi.org/10.1007/BF00483363
[41] Rudnick, R.L. and Gao, S. (2003) Composition of the Continental Crust. Treatise on Geochemistry, 3, 1-64.
[42] Hammer, Ø., Harper, D.A.T. and Paul, D.R. (2001) PAST: Paleontological Statistics Software Package for Education and Data Analysis. Palaeontologia Electronica, 4. [43] Dyachenko, V., Matasova, I. and Ponomareva, O. (2014) The Trace Elements
Con-centrations Dynamics in the Soil Landscapes of the Southern Russia. Universal Journal of Geoscience, 2, 28-34.
Animal Health. Environmental Geochemistry and Health, 10, 51-61. https://doi.org/10.1007/BF01758592
[45] Frontasyeva, M.V. and Steinnes, E. (2004) Marine Gradients of Halogens in Moss Studies by Epithermal Neutron Activation Analysis. Journal of Radio Analytical and Nuclear Chemistry, 261, 101-106.
https://doi.org/10.1023/B:JRNC.0000030941.78117.77
[46] Logan, T.J. and Miller, R.H. (1983) Background Levels of Heavy Metals in Ohio Farm Soils. Research Circular (275) AGDEX 508-530.
[47] Chen, M., Ma, L.Q. and Harris, W.G. (1999) Baseline Concentrations of 15 Trace Elements in Florida Surface Soils. Journal of Environmental Quality, 28, 1173-1181. https://doi.org/10.2134/jeq1999.00472425002800040018x
[48] Kolesnikov, S.I., Kazeev, K.S., Denisova, T.V. and Dadenko, E.V. (2012) Develop-ment of Regional Ecological Regulations of Content of Contaminants in Soils of Southern Russia. Polythematic Online Scientific Journal of Kuban State Agrarian University, 82, 1-17. (In Russian)
[49] Mynbayeva, B.N. and Imanbekova, T.G. (2013) Assessment of Standards of Soil’s Contamination by Heavy Metals (Analytical Review). The Bulletin of the National Academy of Sciences of the Republic of Kazakhstan, 4, 29-39. (In Russian)
[50] Bonanno, G. and Lo, G.R. (2010) Heavy Metal Bioaccumulation by the Organs of
Phragmites australis (Common Reed) and Their Potential Use as Contamination Indicators. Ecological Indicators, 10, 639-645.
[51] Maltsev, A.E., Leonova, G.A., Bogush, A.A. and Bulycheva, T.M. (2014) Ecogeo-chemical Assessment of Anthropogenic Pollution of Flooded Open Pits Ecosystems in Novosibirsk. Ecology of Industrial Production, 2, 44-53. (In Russian)
[52] Bojanowski, R. (1973) The Occurrence of Major and Minor Chemical Elements in the More Common Baltic Seaweed. Oceanologia, 2, 81-152.
[53] Ravera, O. (2001) Monitoring of the Aquatic Environment by Species Accumulator of Pollutants: A Review. Journal of Limnology, 60, 63-78.
https://doi.org/10.4081/jlimnol.2001.s1.63
[54] Kabata-Pendias, A. and Pendias, H. (2001) Trace Elements in Soils and Plants. 3rd Edition, CRC Press, Boca Raton, London, New York.
[55] Guilizzoni, P. (1991) The Role of Heavy Metals and Toxic Materials in the Physio-logical Ecology of Submersed Macrophytes. Aquatic Botany, 41, 87-109.
Submit or recommend next manuscript to SCIRP and we will provide best service for you:
Accepting pre-submission inquiries through Email, Facebook, LinkedIn, Twitter, etc. A wide selection of journals (inclusive of 9 subjects, more than 200 journals)
Providing 24-hour high-quality service User-friendly online submission system Fair and swift peer-review system
Efficient typesetting and proofreading procedure
Display of the result of downloads and visits, as well as the number of cited articles Maximum dissemination of your research work