Munich Personal RePEc Archive
Why Inventions Occurred in Some
Countries and Not in Others?
Sequeira, Tiago and Santos, Marcelo and Ferreira-Lopes,
Alexandra
Universidade da Beira Interior and CEFAGE-UBI, Universidade da
Beira Interior and CEFAGE-UBI, ISCTE-IUL, BRU-IUL and
CEFAGE-UBI
18 November 2013
Why Inventions Occurred in Some Countries and Not in
Others?
∗
Tiago Neves Sequeira
†Univ. Beira Interior and CEFAGE-UBI
Marcelo Santos
‡Univ. Beira Interior and CEFAGE-UBI
Alexandra Ferreira-Lopes
§ISCTE-IUL, BRU-IUL, and CEFAGE-UBI
Abstract
The reasons why inventions that shaped industrial revolutions, occurred in the UK and in the USA, have been suggested by economic historians. For the first time, we access the determinants of more than a hundred inventions around the world, explaining why they occurred in a given country and why some occurred earlier than others. We confirm the importance of scale effects and dismiss the importance of education as triggers of inventions. Geographic and genetic distance from the UK and the USA have proven to be significant in explaining inventions. Both distance from the UK and proximity to the USA seem to have significant effect on the rise of the probability to invent and on the probability to invent earlier.
Keywords: Inventions; Industrial Revolutions; TFP; Determinants of Development JEL Codes: I25, N10, N30, O10, O50, Z10
1
Introduction
There is a proficuous literature on the drivers of industrial revolutions which could be translated into the drivers of earlier inventions. There are essentially three different views about the triggers of the first inventions in Britain, which shaped the beginning of the industrial revolution. First, a view that inventions occurred in Britain because it paid to invent them there. This is the view of Allen (2009a, 2009b) who bases the
∗We thank financial support from FCT.
†Departamento de Gest˜ao e Economia and CEFAGE-UBI. Universidade da Beira Interior. Estrada do Sineiro. 6200-209 Covilh˜a, Portugal. Corresponding author. e-mail: [email protected].
‡Departamento de Gest˜ao e Economia and CEFAGE-UBI. Universidade da Beira Interior. Estrada do Sineiro. 6200-209 Covilh˜a, Portugal.
argument on the relative factor prices in Britain in the middle of the Eighteen century. In fact, Britain experienced at that time relatively high wages but relatively cheap capital and energy, which was an incentive to come up with inventions which would allow for the substitution of labor by capital. According to this view, this is the reason why the industrial revolution began in Britain and not, e.g., in France, where labor was much cheaper. Allen also recognizes that the supply of inventors is important and he points out that in the years prior to 1800, a cultural revolution had happened in Britain and that the stock of human capital at that time was much bigger than one or two centuries before. This difference in the relative supply of production factors has been used in models of endogenous growth to explain different patterns of industrial revolutions (see e.g. Iacopetta, 2010 and G´omez and Sequeira, 2012).
Second, a view that justifies the British Industrial Revolution due to the quality of institutions in Britain relative to other countries, since Britain had been committed on constructing solid and trustable institutions for a while. This is a view argued by Mokyr (2009). According to Mokyr’s view ““Britain became the leader of the Industrial Revo-lution because, more than any other European economy, it was able to take advantage of its endowment of human and physical resources thanks to the great synergy of the Enlightenment: the combination of the Baconian program in useful knowledge and the recognition that better institutions created better incentives” (p.122). Mokyr believes that the combination of skilled scientists, engineers, entrepreneurs, and craftsman allowed for the invention and adoption of technologies by firms. Thus, the Enlightenment period in Britain has caused two main effects: it improved technological capabilities and institu-tional quality. The Baconian program comprised research based on experimentation and scientific method, directing the research to solve practical problems, and making results accessible (p.40). Mokyr acknowledges that the impact of the Enlightenment on institu-tions is hard to quantify but argues that the success of its ideology reduced rent-seeking and promoted competitive markets (p.63). It was manifested in terms of legislation, such as the abolition of the Corn Laws, but also strengthened informal institutions, in the form of social norms that favored gentlemanly capitalism rather than opportunistic behavior (ch.16). Clark (1996) also focused on the important political and institutional evolutions that preceded and influenced the Industrial Revolution. As the author writes: “The years between the Glorious Revolution and the Industrial Revolution saw widespread change in the British economy: the transport system was radically improved; a large scale conversion to purely private agriculture was accelerated; new institutions of finance and commerce were put in place; and the government debt was regarded as the safest asset in the economy” (p. 564).
Third, a view based on the unified growth theory (due to Galor, 2005) which argues that the transition to a post-Malthusian epoch (i.e., an Industrial Revolution) was due to scale effects provided by an increased or larger population. The transition to sustainable growth is supported by an increasing demand for human capital, provided by families, that increasingly bet on the quality of the offspring in opposition to the quantity.
growth rate, Broadberry et al. (2011) clearly show that the industrial sector was the one that presented the fastest growth (when compared with services and agriculture) between 1760 and 1860, and with accelerating growth during the period. The impor-tance of technology has been emphasized (e.g. Crafts and Harley, 1992, Crafts, 2004), where estimates of TFP growth has been presented and compared with those from other references.
Our work is an empirical attempt to answer the question “why technologies appeared where they appeared?”. This may be interpreted as a re-statement of the question “why in Britain?” that many authors addressed before. However, we depart from the existing literature in two important ways. First, we study a number of documented technologies that were invented throughout the centuries (e.g. tractor, cellphone, or spindle mule), and second, we assign those inventions to the countries in which they were invented. Hence, we are not only studying England only, like most of the previous literature did. We want to contribute to answer the question “why in Britain?” but also “why not in Britain?”
The paper is organized as follows. Section 2 presents the data and respective sources. Section 3 presents the main results and Section 4 concludes.
2
Data and Sources
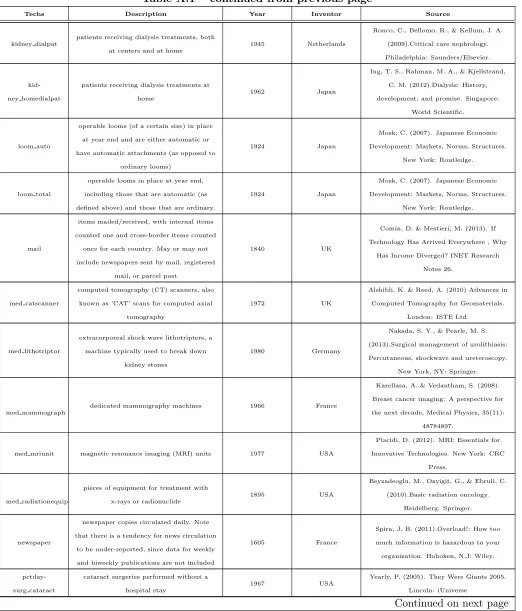
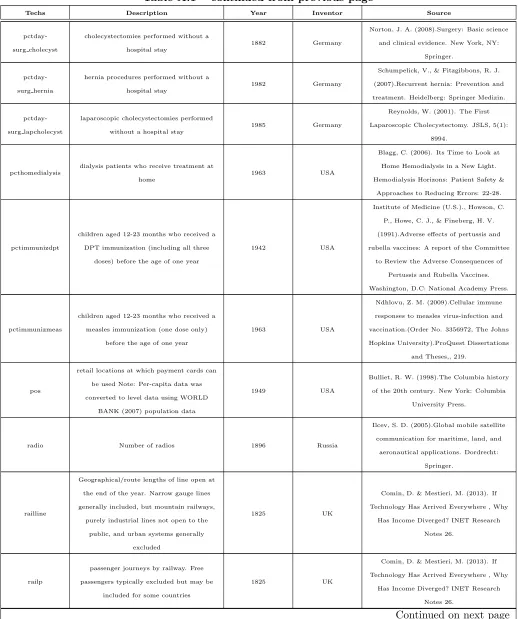
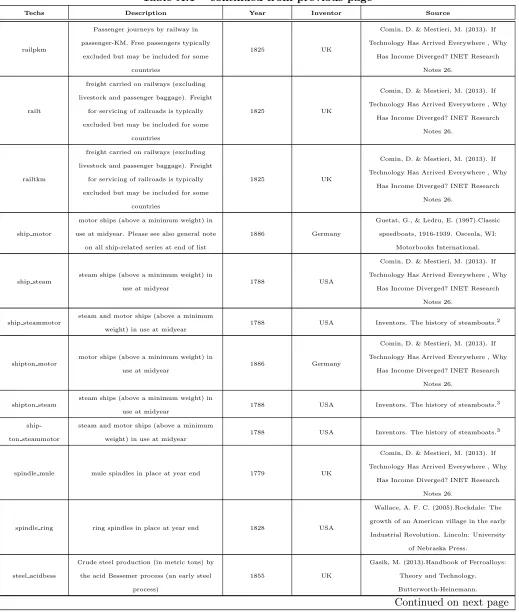
We began collecting data on all the 104 technologies that were mentioned in the CHAT dataset of Comin and Hobijn (2009). However, we do not use data from the CHAT dataset, we only collected the designation of technologies. Then, we searched, in different bibliographic references, for the invention year of all technologies invented after 1600 (see Table Appendix A) and collected them. There were 14 technologies invented before 1600 and 6 other for which it was not possible to identify the invention year. So, we remain with 84 technologies to be studied. This allowed us to build two different and alternative dependent variables: a dummy variable which takes the value 1 for the country which invented the given technology and 0 for all the other countries, and then a variable which measures how many years ago the technology was invented (this was made by subtracting the year of invention from the year 2000). For the first variable, we have 84 technologies per country (which can be the inventor or not) and 10 countries which have invented at least one technology after 1600. While the first variable allows us to identify the reasons why a given technology was invented in a given country and not on some other country, the second allows us to explain the reasons why some inventions are discovered first than others. The countries presented in the database were the USA, with 40 technologies invented, followed by the UK, with 17, Germany with 15, France (4), Japan (3), and Switzerland, Netherlands, Austria, Australia, and Russia with one (1) each.
proxies for the scale effect. While data for the population and for the degree of openness, which was our own calculation, were collected from Mitchell (1998), data for GDP per
capita are from the Maddison Project (Bolt and van Zanden, 2013). To account for
the idea that institutional changes may have occurred earlier to allow for an increase in the invention activity we use the overall knowledge presented in the country in 1500, a variable developed by Comin et al. (2010). This variable is fixed on different pairs of technology-year of invention, so it can be also regarded as a country fixed effect which al-lows to account for other institutional country-specific changes. Distance (or proximity) has been argued to be a determinant of the diffusion of technologies (e.g. Comin et al., 2010; Spolaore and Wacziarg, 2011), since the diffusion of ideas can be spread through the countries’ borders, which could happen even in earlier times. For instance, Mokyr (2005) studied the flow of scientists between European countries, as a contribution to un-derstand the Industrial Revolution. Communication between different scientists is eased by geographic and cultural proximity. Cultural proximity can also be a determinant of similar values, norms, and preferences, which shape the demand for a given good and also make more profitable the use of a certain technology. We also include geographic distance (from Mayer and Zignago, 2011) and genetic distance, as a measure of cultural and communication affinity, (from Spolaore and Wacziarg, 2011) from the UK and the USA, as explanatory variables. Table 1 summarizes variables and sources.
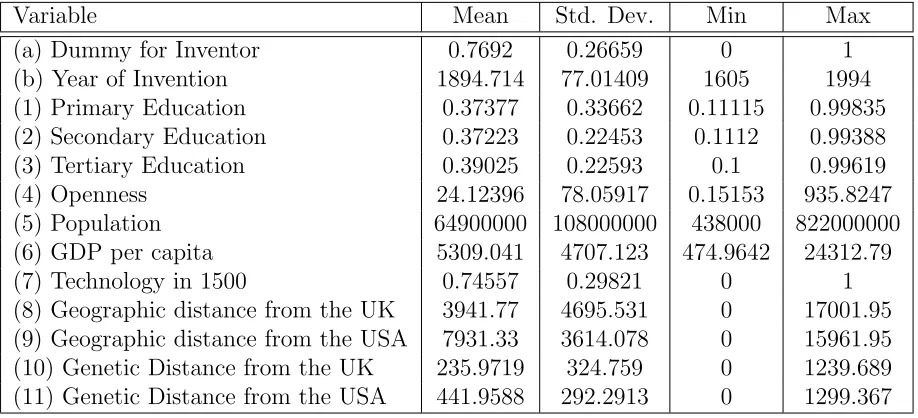
Table 2 presents descriptive statistics for the main variables.
3
Results
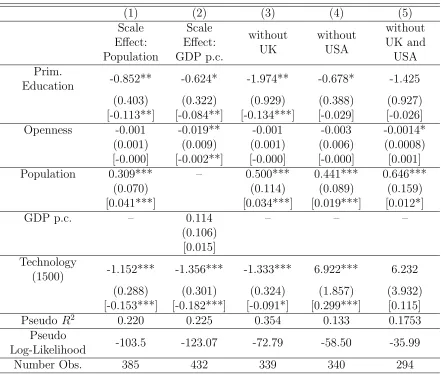
We begin by considering a probit regression for the dummy of the inventor with the proxies we selected for human capital (primary education enrollment five years before the year of invention), for the scale effect (total population measured five years before the year of invention), for the diffusion of ideas, international spillovers (openness ratio measured in the year of invention), and a proxy for previous accumulated knowledge - the average of the technological adoption index in 1500 - which can also account for previous political and institutional reforms. For the human capital proxies, we have also tested school enrollments in secondary schools (E2 in Table 1) and enrollment ratio in colleges and universities (E3 in Table 1). However, these two variables proved to be always statistically insignificant in regressions, so we have dismissed them. For the scale effect we also tested GDP per capita and some results are presented below with this variable as a regressor.
Table 1: Variables
Dependent Variables Name Measure (source)
Dummy for Inventor DI 0 or 1. Various Sources (see Appendix A).
Age of Invention AI 2000-Year of Invention. Various Sources (see Appendix A).
Explanatory Variables Name Measure (years and source)
Education (Primary) E1 Enrollment in Primary Schools/Population five years before
the year of invention. Mitchell (1998).
Education (Secondary) E2 Enrollment in Secondary Schools/Population five years before
the year of invention. Mitchell (1998).
Education (Tertiary) E3 Enrollment in Colleges and Universities/Population five years
before the year of invention. Mitchell (1998).
Openness open (Exports+Imports)/GDP in the year of invention. Mitchell
(1998).
Population Pop Logarithm of the total population five years before the year of
invention. Mitchell (1998).
GDP per capita GDPpc Logarithm of the GDP per capita in the year of invention.
Maddison Project (Bolt and van Zanden, 2013).
Technology in 1500 tr3 Average of the sectoral technology adoption indexes in 1500
AD. Cominet. al.(2010).
Geographic distance from the UK Dist UK Geographic distance from the United Kingdom (distance
be-tween capitals) in kilometers. Mayer and Zignago (2011)
Geographic distance from the USA Dist USA Geographic distance from the United States of America
(dis-tance between capitals) in kilometers. Mayer and Zignago
(2011)
Genetic Distance from the UK GenD UK Weighted FST genetic distance between United Kingdom and
another country. Spolaore and Wacziarg (2011)
Genetic Distance from the USA GenD USA Weighted FST genetic distance between United States of
Table 2: Descriptive Statistics
Variable Mean Std. Dev. Min Max
(a) Dummy for Inventor 0.7692 0.26659 0 1 (b) Year of Invention 1894.714 77.01409 1605 1994 (1) Primary Education 0.37377 0.33662 0.11115 0.99835 (2) Secondary Education 0.37223 0.22453 0.1112 0.99388 (3) Tertiary Education 0.39025 0.22593 0.1 0.99619 (4) Openness 24.12396 78.05917 0.15153 935.8247 (5) Population 64900000 108000000 438000 822000000 (6) GDP per capita 5309.041 4707.123 474.9642 24312.79 (7) Technology in 1500 0.74557 0.29821 0 1 (8) Geographic distance from the UK 3941.77 4695.531 0 17001.95 (9) Geographic distance from the USA 7931.33 3614.078 0 15961.95 (10) Genetic Distance from the UK 235.9719 324.759 0 1239.689 (11) Genetic Distance from the USA 441.9588 292.2913 0 1299.367
Column (2) repeats the regression but substituting population for GDP per capita. In this case, the only important change is that GDP per capita becomes statistically non-significant and openness becomes statistically non-significant with a negative sign and with a very small marginal effect, meaning that openness to trade has a small negative effect on inventions and that population is in fact the best proxy for the scale effect. We also consider subsets of the complete sample in regressions that we present in columns (3), (4), and (5). In particular, due to their leadership role in the first and the second indus-trial revolutions, respectively, we exclude the UK and USA from the sample, and analyze if results are maintained or not. All the regressions confirm the high importance of the scale effect due to population, a small negative effect of education, and a negligible effect of openness. The negative and significant effect of technology in 1500 is reverted to a significantly positive effect when the USA is dropped from the sample. This is explained because the USA is the only great inventor in the post-industrial revolution, that did not have a significant endowment of knowledge in 1500. Thus, when the USA is dropped from the sample, a strong positive effect of technology in 1500 appears, meaning that more 0.1 points in the technological index would increase in nearly 3% the probability to invent. On the contrary, the presence of the UK increases the importance of technology in 1500 as a explanatory variable for technologies after the sixteenth century. Thus the exclusion of both countries results on a non-significant result.
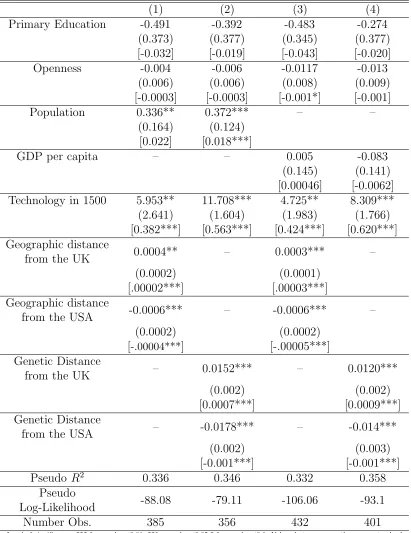
of 0.1 in technological knowledge in 1500 would imply a 3.8% to 6.2% increase in the probability of inventing. This result supports the argument according to which countries invented in the last centuries because they have previously built knowledge and institu-tions that allowed inveninstitu-tions to be paid for. The introduction of distances to the UK and to the USA present also interesting results. Paradoxically, distance to the UK and proximity to the USA enhances the capacity to invent, ceteris paribus the effects of other regressors. In fact, more 100 km distance to the UK imply 0.2%-0.3% more probability of inventing. On the contrary, more 100 km distance to the USA decreases the probability of invention between 0.4% and 0.5%. The genetic distance between populations of the inventing countries and the UK and the USA seem to have even bigger effects. More 100 points in genetic distance to the UK (roughly 1/3 of the genetic distance between the USA and the UK) implies more 7%-9% more probability of inventing.
One may wonder if these results are due to the presence of observations from the UK and the USA in the sample. So we run the same regressions first eliminating the USA, then eliminating UK, and finally eliminating both. When we eliminate the USA from the sample, geographic distances to the USA and the UK remain highly significant and the positive and significant signs of population and technology in 1500 are maintained (although, only marginally for technological knowledge in 1500). Moreover, the statistical significance of genetic distance disappears. When we eliminate the UK from the sample, geographic distance to the UK increases the probability to invent and geographic distance to USA decreases the probability to invent, a result that is almost replicated when genetic distance is considered. Population and technological knowledge in 1500 remain with a statistically significant (positive) effect (in the case of population it is only marginally significant in regressions that consider genetic distance). When we eliminate both the UK and the USA, geographic distance to the UK and proximity to the USA increase the probability to invent of other countries, recovering the initial effects described in Table 4. On the contrary, genetic distance turns out to be non-significant.
Overall, when the effect of distances (both geographic and genetic) to the invention leaders (the UK and the USA) is taken into account, positive significant effects of scale (population) and previous accumulated knowledge are evident on the probability to in-vent. Significant positive effects of distance to the UK and proximity to the USA have also been uncovered. However, when we remove these two countries from the sample, only the geographic distance (and not the genetic one) seems to influence the probability to invent.
3.1
Determinants of Earlier Inventions
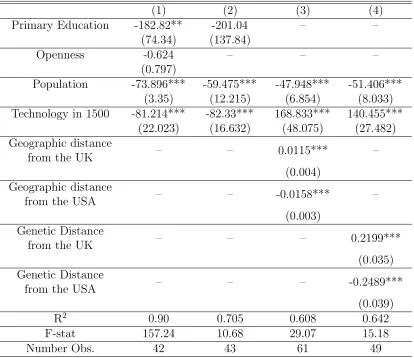
In this section we present results for OLS regressions with a dependent variable that intends to measure how early an invention occurs. With this, our aim is to test the determinants of some inventions being invented earlier than others. The dependent variable is the difference between the year 2000 and the year of the invention. We run regressions using the same explanatory variables of the previous section. However, due to the lack of degrees of freedom, we successively eliminated variables that proved to be non-significant.
Table 3: Benchmark Probit Regressions
(1) (2) (3) (4) (5)
Scale Effect: Population
Scale Effect: GDP p.c.
without UK
without USA
without UK and USA Prim.
Education -0.852** -0.624* -1.974** -0.678* -1.425 (0.403) (0.322) (0.929) (0.388) (0.927) [-0.113**] [-0.084**] [-0.134***] [-0.029] [-0.026] Openness -0.001 -0.019** -0.001 -0.003 -0.0014*
(0.001) (0.009) (0.001) (0.006) (0.0008) [-0.000] [-0.002**] [-0.000] [-0.000] [0.001] Population 0.309*** – 0.500*** 0.441*** 0.646***
(0.070) (0.114) (0.089) (0.159) [0.041***] [0.034***] [0.019***] [0.012*]
GDP p.c. – 0.114 – – –
(0.106) [0.015] Technology
(1500) -1.152*** -1.356*** -1.333*** 6.922*** 6.232 (0.288) (0.301) (0.324) (1.857) (3.932) [-0.153***] [-0.182***] [-0.091*] [0.299***] [0.115] Pseudo R2 0.220 0.225 0.354 0.133 0.1753
Pseudo
Log-Likelihood -103.5 -123.07 -72.79 -58.50 -35.99
Number Obs. 385 432 339 340 294
Table 4: Extended Probit Regressions
(1) (2) (3) (4)
Primary Education -0.491 -0.392 -0.483 -0.274 (0.373) (0.377) (0.345) (0.377) [-0.032] [-0.019] [-0.043] [-0.020] Openness -0.004 -0.006 -0.0117 -0.013
(0.006) (0.006) (0.008) (0.009) [-0.0003] [-0.0003] [-0.001*] [-0.001]
Population 0.336** 0.372*** – –
(0.164) (0.124) [0.022] [0.018***]
GDP per capita – – 0.005 -0.083
(0.145) (0.141) [0.00046] [-0.0062] Technology in 1500 5.953** 11.708*** 4.725** 8.309*** (2.641) (1.604) (1.983) (1.766) [0.382***] [0.563***] [0.424***] [0.620***] Geographic distance
from the UK 0.0004** – 0.0003*** – (0.0002) (0.0001)
[.00002***] [.00003***] Geographic distance
from the USA -0.0006*** – -0.0006*** – (0.0002) (0.0002)
[-.00004***] [-.00005***] Genetic Distance
from the UK – 0.0152*** – 0.0120***
(0.002) (0.002)
[0.0007***] [0.0009***] Genetic Distance
from the USA – -0.0178*** – -0.014***
(0.002) (0.003)
[-0.001***] [-0.001***] Pseudo R2 0.336 0.346 0.332 0.358
Pseudo
Log-Likelihood -88.08 -79.11 -106.06 -93.1
Number Obs. 385 356 432 401
of primary education to invent earlier (other levels of education were tested, but as before, they proved to be always non-significant), a non-significant effect of openness and a puzzling negative effect of technological knowledge in 1500. There is also a negative scale effect. This must be because when early inventions appeared, population levels were smaller than when latter inventions appeared, a natural effect due to the fact that population was growing in the analyzed periods. When openness - with a non-significant effect - is dropped (column 2) education also becomes statistically non-significant and the other effects remain qualitatively similar to those in column (1). In columns (3) and (4) we dropped education and included geographic and genetic distance, respectively. An increase in 2.7 in population would have deterred inventions by 47 to 51 years, a strong effect. However, the sign of the technological knowledge in 1500 effect is switched to a more intuitive effect. Now, more technology in 1500, say more 0.1, fostered inventions in 14 to 17 years. The introduction of distance has again interesting effects. In positive fact distance to the UK and proximity to the USA (both geographic and genetic) have a role in fostering inventions. While the quantitative effect of geographic distance is rather modest (a 100 km distance from the UK have fostered inventions in 1 year while 100 km closer to the USA fostered inventions in 1 year and 1/2), the quantitative effect of genetic distance is more important. In fact, 100 additional points in genetic distance from the UK would have deterred inventions for more 22 years, while 100 additional points in genetic proximity to the USA would have fostered invention in 25 years.
4
Conclusion
We collected the invention dates for more than 100 inventions, since the seventeenth century, around the world. With that we studied the determinants of the probability of inventions to occur in a given country, trying to contribute to the literature that explains the triggers of industrial revolutions.
We found evidence according to which the scale effect of the country, measured by its population, is an important determinant of the probability to invent. This strong effect means that nearly more 30 inhabitants in a country could increase the probability to invent from 12% to 41%. Our results show a small negative effect of education, reflecting the relatively lower importance of education as a source of inventions. This corroborates the opinion of some economic historians, which argue that the advent of formal education was posterior to the rise of inventions during the industrial revolution. Openness is rarely a significant determinant of inventions and when it appears to be significant has a negative sign. Inventions from 1600 onwards are also related to previous technological knowledge in the country. We found a negative effect if the USA is included in the sample and a positive effect otherwise. This reflects the fact that the United States developed a strong industrial revolution without any substantial technological development in 1500. A standard-deviation increase in technology in 1500 (near 0.3) would increase the probability to invent from 3% to 9%.
Table 5: OLS Regressions for Earlier Inventions
(1) (2) (3) (4)
Primary Education -182.82** -201.04 – – (74.34) (137.84)
Openness -0.624 – – –
(0.797)
Population -73.896*** -59.475*** -47.948*** -51.406*** (3.35) (12.215) (6.854) (8.033) Technology in 1500 -81.214*** -82.33*** 168.833*** 140.455***
(22.023) (16.632) (48.075) (27.482) Geographic distance
from the UK – – 0.0115*** –
(0.004) Geographic distance
from the USA – – -0.0158*** –
(0.003) Genetic Distance
from the UK – – – 0.2199***
(0.035) Genetic Distance
from the USA – – – -0.2489***
(0.039)
R2 0.90 0.705 0.608 0.642
F-stat 157.24 10.68 29.07 15.18
Number Obs. 42 43 61 49
contrary, more 100 km distance to the USA decreases the probability to invent between 0.4% to 0.5%. More 100 in genetic distance to the UK (roughly 1/3 of the genetic distance between the USA and the UK) implies more 7%-9% more probability of inventing.
References
[1] Allen, R. (2009a). The British Industrial Revolution in Global Perspective. Cam-bridge University Press, CamCam-bridge.
[2] Allen, R. (2009b). Engels ’Pause: Technical Change, Capital Accumulation, and Inequality in the British Industrial Revolution Explorations in Economic History, 46: 418—445.
[3] Bolt, J. and J. L. van Zanden (2013). The First Update of the Maddison Project;
Re-Estimating Growth Before 1820. Maddison Project Working Paper 4.
[4] Broadberry, S. B. Campbell, A. Klein, M. Overton, and B. van-Leeuwen (2011).
British Economic Growth, 1270-1870: An Output-based Approach. University of
Kent School of Economics Discussion Papers, KDPE 1203.
[5] Clark, G. (1996). The Political Foundations of Modern Economic Growth: England 1540-1800. Journal of Interdisciplinary History,26 (4): 563-588.
[6] Crafts, N. and C. Harley (1992). Output Growth and the British Industrial Revolu-tion: A Re-statement of the Crafts-Harley View. Economic History Review,45 (4): 703-730.
[7] Crafts, N. (2004). Productivity Growth in the Industrial Revolution: A New Growth Accounting Perspective, Journal of Economic History,64 (2): 521-535.
[8] Comin, D. and B. Hobijn (2009). The CHAT dataset. NBER Working Paper 15319. [9] Comin, D., W. Easterly, and E. Gong (2010). Was the Wealth of Nations Determined
in 1000 BC? American Economic Journal: Macroeconomics,2 (3): 65-97.
[10] Easterlin, R. A. (1981). Why Isn’t the Whole World Developed? Journal of
Eco-nomic History,41 (1): 1-19.
[11] Galor, O. (2005). From Stagnation to Growth: Unified Growth Theory Handbook
of Economic Growth, Vol. 1A, ch. 4, Edited by Philippe Aghion and Steven N.
Durlauf, Amsterdam, The Netherlands, Elsevier, North-Holland.
[12] G´omez, M. and T. N. Sequeira (2012). Phases of Economic Development: Do Initial Endowments Matter? The BE Journal of Macroeconomics (Topics),12 (1): Article 21.
[13] Greasley, D and L. Oxley (2007). Patenting, Intellectual Property Rights and Sec-toral Outputs in Industrial Revolution Britain, 1780-1851.Journal of Econometrics, 139: 340-354.
[14] Iacopetta, M. (2010). Phases of Economic Development and the Transitional Dy-namics of an Innovation-education Growth Model. European Economic Review, 54 (2): 317—330.
[15] Mayer, T. Zignago, S. (2011). Notes on CEPIIs distances measures : the GeoDist
[16] Mokyr, J. (2005). Mobility, Creativity and Technological Development. Prepared for the session on “Creativity and the Economy”, German Association of Philosophy, Berlin, Sept. 18, 2005.
[17] Mokyr, J. (2009).The Enlightened Economy: An Economic History of Britain
1700-1850. New Haven: Yale University Press.
[18] Mitchell, B. (1998).Historical Statistics. 4th Edition, New York: Stockton Press [19] Spolaore, E. and R. Wacziarg (2011).Long-Term Barriers to the International
Dif-fusion of Inventions. NBER Working Paper 17271.
[20] Stockey, N. (2001). A Quantitative Model of the British Industrial Revolution, 1780-1850. Carnegie-Rochester Conference Series on Public Policy,55: 55-109.
A
Invention Dates and Sources of Technologies
Techs Description Year Inventor Source
ag harvester
self-propelled machines that reap and
thresh in one operation
1912 USA
Comin, D. & Mestieri, M. (2013). If
Technology Has Arrived Everywhere , Why
Has Income Diverged? INET Research
Notes 26.
ag milkingmachine
installations consisting of several complete
milking units
1878 USA
Burton, L. D. V. (2010).Agriscience:
Fundamentals and applications. Clifton
Park, NY: Delmar Cengage Learning.
ag tractor
wheel and crawler tractors (excluding
garden tractors)
1892 USA
Comin, D. & Mestieri, M. (2013). If
Technology Has Arrived Everywhere , Why
Has Income Diverged? INET Research
Notes 26.
atm
electromechanical devices that permit
authorized users, typically using
machine-readable plastic cards, to withdraw
cash from their accounts and/or access
other services
1960 USA
Simjian, L. (1963). Patent N. 3079603.
United States of America.
aviationpkm
Civil aviation passenger-KM traveled on
scheduled services by companies registered
in the country concerned. Not a measure of
travel through a countrys airports
1903 USA
Comin, D. & Mestieri, M. (2013). If
Technology Has Arrived Everywhere , Why
Has Income Diverged? INET Research
Notes 26.
aviationtkm
Civil aviation ton-KM of cargo carried on
scheduled services by companies registered
in the country concerned. Not a measure of
travel through a countrys airports
1903 USA
Comin, D. & Mestieri, M. (2013). If
Technology Has Arrived Everywhere , Why
Has Income Diverged? INET Research
Notes 26.
bed acute
beds available for those seeking in-patient
acute care, including diagnosis or treatment
of an injury or illness and performance of
surgery
1874 USA
National Association of Bedding
Manufacturers, March 1964, Nation’s
Oldest Family-Held Bedding Firm: Adam
Wuest, Inc.
Table A.1 – continued from previous page
Techs Description Year Inventor Source
bed hosp
beds, including inpatient beds available in
public, private, general, and specialized
hospitals and rehabilitation centers. In
most cases beds for both acute and chronic
care are included
1874 USA
National Association of Bedding
Manufacturers, March 1964, Nation’s
Oldest Family-Held Bedding Firm: Adam
Wuest, Inc.
bed longterm
beds for people who need assistance on a
continuing basis due to chronic impairments
and a reduced degree of independence in
activities of daily living (including those in
both hospitals and nursing homes)
1874 USA
National Association of Bedding
Manufacturers, March 1964, Nation’s
Oldest Family-Held Bedding Firm: Adam
Wuest, Inc.
cabletv
Number of households that subscribe to a
multi-channel television service delivered by
a fixed line connection
1948 USA
Hitchner, J. R. (2010).Financial valuation:
Applications and models. Hoboken, N.J:
Wiley.
cellphone Number of users of portable cell phones 1973 USA
Comin, D. & Mestieri, M. (2013). If
Technology Has Arrived Everywhere , Why
Has Income Diverged? INET Research
Notes 26.
cheque Number of payments by cheque (in millions) 1717 UK
Cheque & Credit Clearing Company.
History of the Cheque: Cheque & Credit
Clearing Company.1
computer
Number of self-contained computers
designed for use by one person
1973 France
Comin, D. & Mestieri, M. (2013). If
Technology Has Arrived Everywhere , Why
Has Income Diverged? INET Research
Notes 26.
creditdebit
Payments by credit and debit cards (in
millions)
1949 USA
Bulliet, R. W. (1998).The Columbia history
of the 20th century. New York: Columbia
University Press.
eft
Number of transactions using payment
cards at points of service (retail locations)
1949 USA
Bulliet, R. W. (1998).The Columbia history
of the 20th century. New York: Columbia
University Press.
elecprod
Gross output of electric energy (inclusive of
electricity consumed in power stations) in
KwHr
1882 USA
Comin, D. & Mestieri, M. (2013). If
Technology Has Arrived Everywhere , Why
Has Income Diverged? INET Research
Notes 26.
fert total
Metric tons of fertilizer consumed.
Aggregate of 25 individual types listed in
source
1910 Germany
Comin, D. & Mestieri, M. (2013). If
Technology Has Arrived Everywhere , Why
Has Income Diverged? INET Research
Notes 26.
internetuser access to the worldwide network 1983 USA
Comin, D. & Mestieri, M. (2013). If
Technology Has Arrived Everywhere , Why
Has Income Diverged? INET Research
Notes 26.
Continued on next page
Table A.1 – continued from previous page
Techs Description Year Inventor Source
kidney dialpat
patients receiving dialysis treatments, both
at centers and at home
1945 Netherlands
Ronco, C., Bellomo, R., & Kellum, J. A.
(2009).Critical care nephrology.
Philadelphia: Saunders/Elsevier.
kid-ney homedialpat
patients receiving dialysis treatments at
home
1962 Japan
Ing, T. S., Rahman, M. A., & Kjellstrand,
C. M. (2012).Dialysis: History,
development, and promise. Singapore:
World Scientific.
loom auto
operable looms (of a certain size) in place
at year end and are either automatic or
have automatic attachments (as opposed to
ordinary looms)
1924 Japan
Mosk, C. (2007). Japanese Economic
Development: Markets, Norms, Structures.
New York: Routledge.
loom total
operable looms in place at year end,
including those that are automatic (as
defined above) and those that are ordinary.
1924 Japan
Mosk, C. (2007). Japanese Economic
Development: Markets, Norms, Structures.
New York: Routledge.
items mailed/received, with internal items
counted one and cross-border items counted
once for each country. May or may not
include newspapers sent by mail, registered
mail, or parcel post
1840 UK
Comin, D. & Mestieri, M. (2013). If
Technology Has Arrived Everywhere , Why
Has Income Diverged? INET Research
Notes 26.
med catscanner
computed tomography (CT) scanners, also
known as ’CAT’ scans for computed axial
tomography
1972 UK
Alshibli, K. & Reed, A. (2010) Advances in
Computed Tomography for Geomaterials.
London: ISTE Ltd.
med lithotriptor
extracorporeal shock wave lithotripters, a
machine typically used to break down
kidney stones
1980 Germany
Nakada, S. Y., & Pearle, M. S.
(2013).Surgical management of urolithiasis:
Percutaneous, shockwave and ureteroscopy.
New York, NY: Springer.
med mammograph
dedicated mammography machines 1966 France
Karellasa, A. & Vedantham, S. (2008).
Breast cancer imaging: A perspective for
the next decade, Medical Physics, 35(11):
48784897.
med mriunit magnetic resonance imaging (MRI) units 1977 USA
Placidi, D. (2012). MRI: Essentials for
Innovative Technologies. New York: CRC
Press.
med radiationequip
pieces of equipment for treatment with
x-rays or radionuclide
1895 USA
Beyzadeoglu, M., Ozyigit, G., & Ebruli, C.
(2010).Basic radiation oncology.
Heidelberg: Springer.
newspaper
newspaper copies circulated daily. Note
that there is a tendency for news circulation
to be under-reported, since data for weekly
and biweekly publications are not included
1605 France
Spira, J. B. (2011).Overload!: How too
much information is hazardous to your
organization. Hoboken, N.J: Wiley.
pctday-surg cataract
cataract surgeries performed without a
hospital stay
1967 USA
Yearly, P. (2005). They Were Giants 2005.
Lincoln: iUniverse
Table A.1 – continued from previous page
Techs Description Year Inventor Source
pctday-surg cholecyst
cholecystectomies performed without a
hospital stay
1882 Germany
Norton, J. A. (2008).Surgery: Basic science
and clinical evidence. New York, NY:
Springer.
pctday-surg hernia
hernia procedures performed without a
hospital stay
1982 Germany
Schumpelick, V., & Fitzgibbons, R. J.
(2007).Recurrent hernia: Prevention and
treatment. Heidelberg: Springer Medizin.
pctday-surg lapcholecyst
laparoscopic cholecystectomies performed
without a hospital stay
1985 Germany
Reynolds, W. (2001). The First
Laparoscopic Cholecystectomy. JSLS, 5(1):
8994.
pcthomedialysis
dialysis patients who receive treatment at
home
1963 USA
Blagg, C. (2006). Its Time to Look at
Home Hemodialysis in a New Light.
Hemodialysis Horizons: Patient Safety &
Approaches to Reducing Errors: 22-28.
pctimmunizdpt
children aged 12-23 months who received a
DPT immunization (including all three
doses) before the age of one year
1942 USA
Institute of Medicine (U.S.)., Howson, C.
P., Howe, C. J., & Fineberg, H. V.
(1991).Adverse effects of pertussis and
rubella vaccines: A report of the Committee
to Review the Adverse Consequences of
Pertussis and Rubella Vaccines.
Washington, D.C: National Academy Press.
pctimmunizmeas
children aged 12-23 months who received a
measles immunization (one dose only)
before the age of one year
1963 USA
Ndhlovu, Z. M. (2009).Cellular immune
responses to measles virus-infection and
vaccination.(Order No. 3356972, The Johns
Hopkins University).ProQuest Dissertations
and Theses,, 219.
pos
retail locations at which payment cards can
be used Note: Per-capita data was
converted to level data using WORLD
BANK (2007) population data
1949 USA
Bulliet, R. W. (1998).The Columbia history
of the 20th century. New York: Columbia
University Press.
radio Number of radios 1896 Russia
Ilcev, S. D. (2005).Global mobile satellite
communication for maritime, land, and
aeronautical applications. Dordrecht:
Springer.
railline
Geographical/route lengths of line open at
the end of the year. Narrow gauge lines
generally included, but mountain railways,
purely industrial lines not open to the
public, and urban systems generally
excluded
1825 UK
Comin, D. & Mestieri, M. (2013). If
Technology Has Arrived Everywhere , Why
Has Income Diverged? INET Research
Notes 26.
railp
passenger journeys by railway. Free
passengers typically excluded but may be
included for some countries
1825 UK
Comin, D. & Mestieri, M. (2013). If
Technology Has Arrived Everywhere , Why
Has Income Diverged? INET Research
Notes 26.
Table A.1 – continued from previous page
Techs Description Year Inventor Source
railpkm
Passenger journeys by railway in
passenger-KM. Free passengers typically
excluded but may be included for some
countries
1825 UK
Comin, D. & Mestieri, M. (2013). If
Technology Has Arrived Everywhere , Why
Has Income Diverged? INET Research
Notes 26.
railt
freight carried on railways (excluding
livestock and passenger baggage). Freight
for servicing of railroads is typically
excluded but may be included for some
countries
1825 UK
Comin, D. & Mestieri, M. (2013). If
Technology Has Arrived Everywhere , Why
Has Income Diverged? INET Research
Notes 26.
railtkm
freight carried on railways (excluding
livestock and passenger baggage). Freight
for servicing of railroads is typically
excluded but may be included for some
countries
1825 UK
Comin, D. & Mestieri, M. (2013). If
Technology Has Arrived Everywhere , Why
Has Income Diverged? INET Research
Notes 26.
ship motor
motor ships (above a minimum weight) in
use at midyear. Please see also general note
on all ship-related series at end of list
1886 Germany
Guetat, G., & Ledru, E. (1997).Classic
speedboats, 1916-1939. Osceola, WI:
Motorbooks International.
ship steam
steam ships (above a minimum weight) in
use at midyear
1788 USA
Comin, D. & Mestieri, M. (2013). If
Technology Has Arrived Everywhere , Why
Has Income Diverged? INET Research
Notes 26.
ship steammotor
steam and motor ships (above a minimum
weight) in use at midyear
1788 USA Inventors. The history of steamboats.2
shipton motor
motor ships (above a minimum weight) in
use at midyear
1886 Germany
Comin, D. & Mestieri, M. (2013). If
Technology Has Arrived Everywhere , Why
Has Income Diverged? INET Research
Notes 26.
shipton steam
steam ships (above a minimum weight) in
use at midyear
1788 USA Inventors. The history of steamboats.3
ship-ton steammotor
steam and motor ships (above a minimum
weight) in use at midyear
1788 USA Inventors. The history of steamboats.3
spindle mule mule spindles in place at year end 1779 UK
Comin, D. & Mestieri, M. (2013). If
Technology Has Arrived Everywhere , Why
Has Income Diverged? INET Research
Notes 26.
spindle ring ring spindles in place at year end 1828 USA
Wallace, A. F. C. (2005).Rockdale: The
growth of an American village in the early
Industrial Revolution. Lincoln: University
of Nebraska Press.
steel acidbess
Crude steel production (in metric tons) by
the acid Bessemer process (an early steel
process)
1855 UK
Gasik, M. (2013).Handbook of Ferroalloys:
Theory and Technology.
Butterworth-Heinemann.
Continued on next page
Table A.1 – continued from previous page
Techs Description Year Inventor Source
steel basicbess
Crude steel production (in metric tons) by
the basic Bessemer process (an early steel
process)
1878 UK
Almqvist, E. (2003).History of industrial
gases. New York, N.Y: Kluwer
Academic/Plenum Publishers.
steel bof
Crude steel production (in metric tons) in
blast oxygen furnaces (a process that
replaced Bessemer and OHF processes)
1952 Austria
Comin, D. & Mestieri, M. (2013). If
Technology Has Arrived Everywhere , Why
Has Income Diverged? INET Research
Notes 26.
steel eaf
Crude steel production (in metric tons) in
electric arc furnaces (a process that
complemented and improved upon Bessemer
and OHF processes)
1907 USA
Comin, D. & Mestieri, M. (2013). If
Technology Has Arrived Everywhere , Why
Has Income Diverged? INET Research
Notes 26.
steel ohf
Crude steel production (in metric tons) in
open hearth furnaces (a process that
complemented the Bessemer process)
1865 UK
Comin, D. & Mestieri, M. (2013). If
Technology Has Arrived Everywhere , Why
Has Income Diverged? INET Research
Notes 26.
steel other
Crude steel production (in metric tons) by
methods other than those listed here
1614 UK
McCosh, F. W. J. (1984).Boussingault,
chemist and agriculturist. Dordrecht: D.
Reidel Pub. Co.
steel stainless
Stainless steel production (in metric tons).
Stainless and crude steel have different
functions
1904 France
Reardon, A. C. (2011).Metallurgy for the
non-metallurgist. Materials Park, Ohio:
ASM International.
surg appendectomy
Number of appendectomies performed 1735 UK
Stockman, J. (2013).Year Book of
Pediatrics 2013: Pediatrics. London:
Elsevier Health Sciences.
surg breastcnsv breast conservation surgeries performed 1976 USA
Ueno, N. T., & Cristofanilli, M.
(2012).Inflammatory breast cancer: An
update. Dordrecht: Springer.
surg cardcath
cardiac catheterizations (insertion of a
catheter into a chamber or vessel of the
heart) performed
1929 Germany
Lilly, L. S., & Harvard Medical School.
(2011).Pathophysiology of heart disease: A
collaborative project of medical students
and faculty. Baltimore, MD: Wolters
Kluwer/Lippincott Williams & Wilkins.
surg cholecyst
cholecystectomies (gallbladder removals)
performed, either laparoscopically or by
other methods
1882 Germany
Norton, J. A. (2008).Surgery: Basic science
and clinical evidence. New York, NY:
Springer.
surg corbypass coronary bypass surgeries performed 1960 USA
DeSilva, R. (2013).Heart disease. Santa
Barbara, Calif: Greenwood.
surg corinterven
percutaneous coronary interventions (used
to reduced or eliminate the symptoms of
coronary artery disease) performed
1977 Switzerland
Estafanous, F. G., Barash, P. G., & Reves,
J. G. (2001).Cardiac anesthesia: Principles
and clinical practice. Philadelphia:
Lippincott Williams & Wilkins.
surg corstent
coronary stenting procedures performed.
This is a particular type of percutaneous
coronary intervention
1994 USA
In Bandhyopadhya, A., & In Bose, S.
(2013).Characterization of biomaterials.
Table A.1 – continued from previous page
Techs Description Year Inventor Source
surg hernia
procedures performed to correct inguinal
and femoral hernias (the most common
types)
1879 UK
Hupp, F. (1924). Intra-abdominal rupture
of intestine following strangulated femoral
hernia. Ann. Surg. 80 (4): 504-10
surg hipreplace hip replacement surgeries performed 1891 Germany
Gomez, P. & Morcuende J. (2005). Early
Attempts at Hip Arthroplasty. Iowa Orthop
J. 25: 25-29.
surg hysterectomy
vaginal hysterectomies performed (does not
include abdominal or laparoscopic
procedures)
1813 Germany
Mettler, L. (2007).Manual of new
hysterectomy techniques. New Delhi:
Jaypee Brothers Med. Publ. [u.a..
surg kneereplace knee replacement surgeries 1968 UK
Scuderi, G. R., & Tria, A. J.
(2002).Surgical techniques in total knee
arthroplasty. New York: Springer.
surg lapcholecyst
cholecystectomies (gallbladder removals)
performed laparoscopically
1882 Germany
Norton, J. A. (2008).Surgery: Basic science
and clinical evidence. New York, NY:
Springer.
surg mastectomy mastectomies performed 1882 USA
Pilnik, S. (2003).Common breast lesions: A
photographic guide to diagnosis and
treatment. Cambridge: Cambridge
University Press.
surg pacemaker
pacemaker implantation procedures
performed
1926 Australia
Torok, S. & Holper, P. (2006). Inventing
Millions: Creating wealth, changing lives.
New Delhi: Orient Paperbacks
telegram telegrams sent 1835 USA
Comin, D. & Mestieri, M. (2013). If
Technology Has Arrived Everywhere , Why
Has Income Diverged? INET Research
Notes 26.
telephone
mainline telephone lines connecting a
customer’s equipment to the public
switched telephone network as of year end
1876 USA
Comin, D. & Mestieri, M. (2013). If
Technology Has Arrived Everywhere , Why
Has Income Diverged? INET Research
Notes 26.
trans-plant bonemarrow
bone marrow transplants performed 1956 USA
Kidder, D. S., Oppenheim, N. D., & Young,
B. K. (2009).The intellectual devotional
health: Revive your mind, complete your
education, and digest a daily dose of
wellness wisdom. Emmaus, Pa.: Rodale.
transplant heart heart transplants performed 1968 USA
Comin, D. & Mestieri, M. (2013). If
Technology Has Arrived Everywhere , Why
Has Income Diverged? INET Research
Notes 26.
transplant kidney kidney transplants performed 1954 USA
Comin, D. & Mestieri, M. (2013). If
Technology Has Arrived Everywhere , Why
Has Income Diverged? INET Research
Notes 26.
Table A.1 – continued from previous page
Techs Description Year Inventor Source
transplant liver liver transplants performed 1963 USA
Comin, D. & Mestieri, M. (2013). If
Technology Has Arrived Everywhere , Why
Has Income Diverged? INET Research
Notes 26.
transplant lung lung transplants performed. 1963 USA
Couture, K. A., & Couture, K. A.
(2001).The lung transplantation handbook.
Victoria, B.C: Trafford.
tv television sets in use 1884 Germany
Peddie, J. (2013).The history of visual
magic in computers: How beautiful images
are made in CAD, 3D, VR and AR.
London: Springer.
txtlmat artif artificial (cellulosic) fibers used in spindles 1865 UK
Baird, G., Mertins, D., & Mies, . R. L.
(1994).The presence of Mies. New York,
NY: Princeton Architectural Press.
txtlmat synth
synthetic (non-cellulosic) fibers used in
spindles
1924 USA
Comin, D. & Mestieri, M. (2013). If
Technology Has Arrived Everywhere , Why
Has Income Diverged? INET Research
Notes 26.
vehicle car
passenger cars (excluding tractors and
similar vehicles) in use. Numbers typically
derived from registration and licensing
records, meaning that vehicles out of use
may occasionally be included.
1885 Germany
Comin, D. & Mestieri, M. (2013). If
Technology Has Arrived Everywhere , Why
Has Income Diverged? INET Research
Notes 26.
vehicle com
commercial vehicles, typically including
buses and taxis (excluding tractors and
similar vehicles), in use. Numbers typically
derived from) registration and licensing
records, meaning that vehicles out of use
may occasionally be included
1885 Germany
Comin, D. & Mestieri, M. (2013). If
Technology Has Arrived Everywhere , Why
Has Income Diverged? INET Research