ISSN Online: 2327-4344 ISSN Print: 2327-4336
DOI: 10.4236/gep.2017.512011 Dec. 26, 2017 153 Journal of Geoscience and Environment Protection
Misalignment Angle Calculation Accuracy
Analysis of Three-Axis Stabilized
Geostationary Satellite
Jian Shang, Chengbao Liu, Lei Yang
*, Zhiqing Zhang
*, Jing Wang
National Satellite Meteorological Center, China Meteorological Administration, Beijing, China
Abstract
The most challenging problem of navigation in three-axis stabilized geosta-tionary satellite is accurate calculation of misalignment angles, deduced by orbit measurement error, attitude measurement error, thermal elastic defor-mation, time synchronization error, and so on. Before the satellite is launched, the misalignment model must be established and validated. But there were no observation data, which is a non-negligible risk of yielding the greatest returns on investment. On the basis of misalignment modeling using landmarks and stars, which is not available between different organizations and is developed by ourselves, experimental data are constructed to validate the navigation processing flow as well as misalignment calculation accuracy. In the condition of using landmarks, the maximum misalignment calculation errors of roll, pitch, and yaw axis are 2, 2, and 104 micro radians, respectively, without con-sidering the accuracy of image edge detection. While in the condition of using stars, the maximum errors of roll, pitch, and yaw axis are 1, 1, and 3 micro ra-dians, respectively, without considering the accuracy of star center extraction. Results are rather encouraging, which pave the way for high-accuracy image navigation of three-axis stabilized geostationary satellite. The misalignment modeling as well as calculation method has been used in the new generation of geostationary meteorological satellite in China, FY-4 series, the first satellite of which was launched at the end of 2016.
Keywords
Misalignment Angle, Accuracy Analysis, Landmark Navigation, Star Navigation, Three-Axis Stabilization Satellite
1. Introduction
The development of three-axis stabilized geostationary satellites is the trend of How to cite this paper: Shang, J., Liu, C.B.,
Yang, L., Zhang, Z.Q. and Wang, J. (2017) Misalignment Angle Calculation Accuracy Analysis of Three-Axis Stabilized Geosta-tionary Satellite. Journal of Geoscience and Environment Protection, 5, 153-165.
https://doi.org/10.4236/gep.2017.512011
Received: November 2, 2017 Accepted: December 23, 2017 Published: December 26, 2017
Copyright © 2017 by authors and Scientific Research Publishing Inc. This work is licensed under the Creative Commons Attribution International License (CC BY 4.0).
DOI: 10.4236/gep.2017.512011 154 Journal of Geoscience and Environment Protection geostationary satellites, which has tremendous advantages over spin-stabilized satellites in observation efficiency and operation flexibility [1]. However, three-axis stabilized attitude control mode brings great challenge to image navi-gation and registration (INR) compared with spin-stabilized satellite, which can satisfy the navigation requirement just by using edge detection of the earth’s disk [2]. That’s because a spin stabilized satellite tends to equalize the thermal varia-tion seen by the instrument over the day, whereas the thermal gradients across the three-axis stabilized platform are more extreme [3]. This can introduce thermal distortions in the platform structure causing changes in the instrument to platform alignment, which will result in navigation error. And this makes the navigation of three-axis stabilized satellite more complicated, and more precise navigation method shall be put into use.
INR is the engineering discipline that deals with the problem of calibrating and stabilizing image geometry [4]. Without accurate navigation, the satellite products could not be retrieved accurately. For three-axis stabilized geostatio-nary satellites, the misalignment caused by thermal elastic deformation, which can’t be measured directly, is the most difficult element to model and the great-est challenge of INR. The misalignment must be calculated and forecasted accu-rately in the ground system. With uploaded coefficients, compensation could be accomplished by the on-board system. Navigation is fulfilled by complicated sa-tellite-earth operation [5]. Studies about navigation process have been carried out for American GOES satellites, European MTG satellites, and so on [3] [6]. But the misalignment modeling and calculating technique is so critical that there are seldom fully open reports and articles describing the methods in detail.
On account of the great image navigation risk, experimental data must be si-mulated to support analysis before the satellite’s launch. In this paper, effective experimental data are constructed to validate the navigation processing flow as well as misalignment calculation accuracy, based on misalignment modeling. Landmark and star navigations are both realized, which are indispensable to high-accuracy navigation for three-axis stabilized geostationary satellites, in-cluding meteorological satellites, earth resource satellites, military satellites, and so on.
2. Misalignment Angle Calculation and Experimental
Data Construction
2.1. Misalignment Modeling
Two navigation methods are considered for new generation three-axis stabilized geostationary satellite, one uses landmarks and the other uses stars. The former takes the errors of the whole satellite-to-ground link into consideration, while the latter can achieve higher accuracy. This technique is so critical in geolocation of three-axis stabilized geostationary satellite that there are not any reports and articles describing the methods in detail.
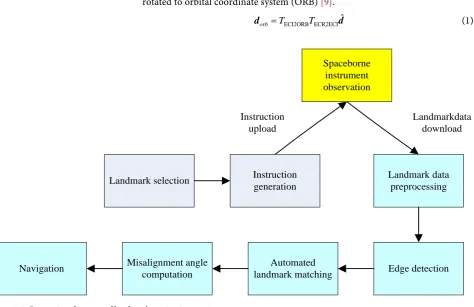
DOI: 10.4236/gep.2017.512011 155 Journal of Geoscience and Environment Protection The errors of whole satellite-to-ground link in geostationary satellite system, including time synchronization error, orbit determination and prediction error, attitude measurement error, calculation error of star navigation, and so on, im-pact navigation accuracy. Landmark navigation can correct navigation error systematically, which makes it indispensible in image navigation. The primary steps of landmark navigation are proposed as follows, which is shown in Figure 1.
a) Select proper landmarks, according to the distribution, cloud cover, obser-vation time, etc.
b) Generate observation instructions corresponding to each selected land-mark, and upload to the satellite.
c) The spaceborne instruments carry out observations of the selected land-marks, and observation data are transmitted to the ground.
d) Implement automated landmark matching and obtain the deviated position of each effective landmark [7] [8].
e) Calculate misalignment angles using landmarks’ deviations and ideal posi-tions.
f) Finish accurate navigation calculation using misalignment angles, orbit data, attitude data, etc.
According to observation geometry of navigation equation, the actual view vector
d
and the idea view vector dˆ of a landmark are both described inearth centered rotating coordinate system (ECR). The view vectors need to be rotated to orbital coordinate system (ORB) [9].
ECI2ORB ECR2ECIˆ
orb=T T
[image:3.595.64.539.408.715.2]d d (1)
Figure 1. Processing diagram of landmark navigation.
Landmark selection Instruction
generation
Spaceborne instrument observation
Instruction upload
Landmark data preprocessing
Landmarkdata download
Edge detection Automated
landmark matching Misalignment angle
DOI: 10.4236/gep.2017.512011 156 Journal of Geoscience and Environment Protection where TECI2orb and TECR2ECI are the rotating matrices from earth centered iner-tial coordinate system (ECI) to ORB and from ECR to ECI, respectively.
The view vector in instrument coordinate system (INST) is rotated to ORB.
ORB =TMISA SAT2ORB INST2SAT INSTT T V
u (2)
where TMISA is the misalignment matrix, VINST is the view vector in INST,
SAT2ORB
T and TINST2SAT are the rotating matrices from satellite coordinate sys-tem (SAT) to ORB and from INST to SAT, respectively. The former is attitude matrix, and the latter is mounting matrix.
Denote the misalignment angles of roll, yaw and pitch axis as
ξ ξ ξ
r, y, p, re-spectively. The misalignment matrix is expressed as( )
( )
( )
MISA z y x r y p
T =R −ξ R −ξ R −ξ (3)
where
( )
( )
( )
1 0 0 cos 0 sin
0 cos sin , 0 1 0 ,
0 sin cos sin 0 cos
cos sin 0
sin cos 0
0 0 1
x y
z
R R
R
θ θ
θ θ θ θ
θ θ θ θ
θ θ
θ θ θ
− = = − = − (4)
and
θ
denotesξ ξ ξ
r, y, p.As long as the three angles are pretty small, the misalignment matrix, which is the most important information in three-axis stabilized geostationary satellite, can be written as
MISA 1 1 1 y p y r p r T ξ ξ ξ ξ ξ ξ − = − − (5)
Using Equation (2) and the unit vector of Equation (1), the following equation can be obtained:
SAT2ORB INST2SAT INST
1 1
1
y p x
y r y
p r z
u
T T V u
u ξ ξ ξ ξ ξ ξ − − = − (6)
Equation (6) can be reorganized to get the final equation, based on which , ,
r y p
ξ ξ ξ
can be calculated.(
)
(
)
(
)
(
)
(
)
(
)
(
)
(
)
(
)
3 2 1
3 1 2
2 1 3
0 , , ,
, 0 , ,
, , 0 ,
r x
p y
y z
f f u f
f f u f
f f u f
α β α β ξ α β
α β α β ξ α β
α β α β ξ α β
− − − = − − − (7) 1
2 2 2
3
( , ) ( , ) ( , )
SAT ORB INST SAT INST
f
f T T V
f α β α β α β = (8)
DOI: 10.4236/gep.2017.512011 157 Journal of Geoscience and Environment Protection step angle in north-south direction, respectively.
2) Star navigation
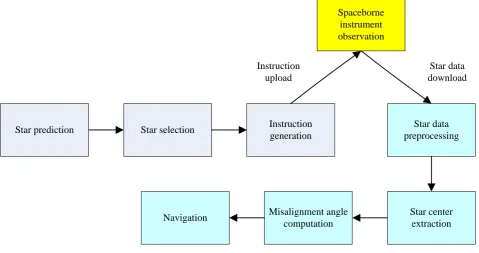
Although landmark navigation deals with the errors of the whole link of satel-lite-to-ground, the navigation accuracy is limited greatly by the accuracy of landmark matching and cloud cover. The primary steps of star navigation are proposed as follows, which is shown in Figure 2.
a) Predict stars according to given time and predicted satellite orbit. b) Select proper stars using star observation strategy.
c) Generate observation instructions corresponding each selected landmark, and upload to the satellite.
d) The spaceborne instruments carry out observations of the stars, and data are transmitted to the ground.
e) Implement star center extraction and obtain the deviated position of each star.
f) Calculate misalignment angles using stars’ deviations and ideal positions. g) Finish accurate navigation calculation using misalignment angles, orbit data, attitude data, etc.
Denote a star’s right ascension and declination as α0 and δ0, respectively, at a given time. The view vector of the star is
0 0
0 0
0
cos cos cos sin
sin
δ α
δ α δ
(9)
[image:5.595.60.540.458.711.2]The instrument view vector can be denoted by its pointing angles, corres-ponding to the target. Rotate the view vector from INST to ECI, and we can get
Figure 2. Processing diagram of star navigation.
Star selection Instruction
generation
Spaceborne instrument observation
Instruction upload
Star data preprocessing
Star data download
Star center extraction Misalignment angle
computation Navigation
DOI: 10.4236/gep.2017.512011 158 Journal of Geoscience and Environment Protection
0 0
ORB2ECI SAT2ORB INST2SAT INST 0 0
0
cos cos cos sin
sin
T T T V
δ α δ α δ = (10)
The misalignment angles can be treated as the attitude variation in ORB. So suppose three misalignment angles
ξ ξ ξ
r, y, p to represent the misalignment in roll, yaw and pitch direction, respectively. Equation (10) is changed to( )
( )
( )
SAT2ORB INST2ST INST0 0
1
ORB2ECI 0 0
0 cos cos
cos sin sin
z y x r y p
x
y
z
R R R T T V
u
T u
u
ξ ξ ξ
δ α δ α δ − − − − = = (11) and
SAT2ORB INST2SAT INST
1 1
1
y p x
y r y
p r z
u
T T V u
u ξ ξ ξ ξ ξ ξ − − = − (12)
After transformation, Equation (13) can be obtained, which is the basis of mi-salignment angle calculation.
(
)
(
)
(
)
(
)
(
)
(
)
(
)
(
)
(
)
3 2 1
3 1 2
2 1 3
0 , , ,
, 0 , ,
, , 0 ,
r x
p y
y z
f f u f
f f u f
f f u f
α β α β ξ α β
α β α β ξ α β
α β α β ξ α β
− − − = − − − (13)
(
)
(
)
(
)
12 SAT2ORB INST2SAT INST
3
, , ,
f
f T T V
f α β α β α β = (14)
2.2. Experimental Data Construction and Analyzing Method
Before the satellite is launched, there are no observation data which can be used to go through navigation procedures and estimate navigation accuracy. Without these analyses, image navigation of three-axis stabilized geostationary satellite exists risks. Under this condition, we try to construct experimental data as fol-lows.
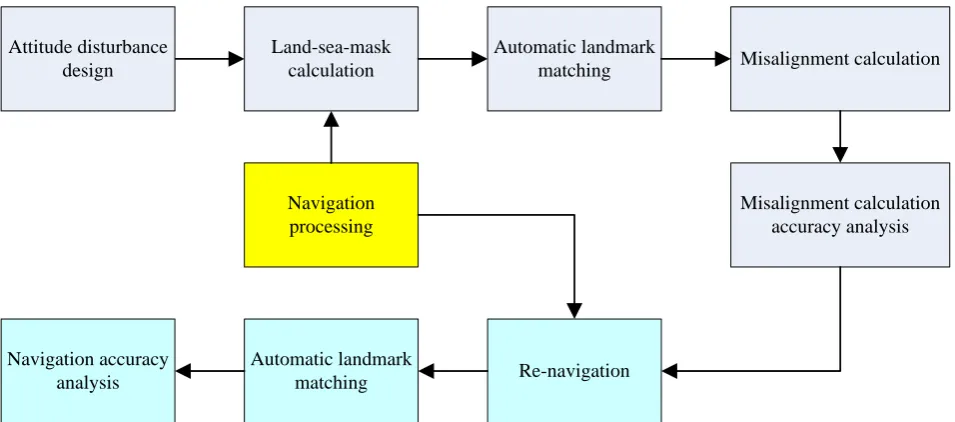
For landmark navigation and corresponding misalignment calculation: 1) Design different attitude disturbance.
2) Calculate land-sea-masks by means of navigation processing, including nominal land-sea-mask and land-sea-masks corresponding to each attitude dis-turbance.
3) Implement automatic landmark matching between each land-sea-mask with attitude disturbance and nominal land-sea-mask, and obtain the matching results.
4) Calculate misalignment angles using misalignment model.
DOI: 10.4236/gep.2017.512011 159 Journal of Geoscience and Environment Protection 6) To go a step further, redo image navigation using the misalignment angles, and output corresponding land-sea-masks.
7) Implement automatic landmark matching between land-sea-masks ob-tained from (f) and land-sea-masks obob-tained from (b), and output the matching results.
8) Analyze the results of (g) and evaluate navigation accuracy.
Note that the landmarks used in (g) are different from those used in (c). The procedures are shown in Figure 3.
For star navigation and corresponding misalignment calculation: 1) Design different attitude disturbance.
2) Specify observation angles of different stars.
3) By means of coordinate system transformation, calculate each star’s posi-tion in observaposi-tion images; this procedure should use the misalignment matrix.
4) By means of coordinate system transformation, calculate each star’s right ascension and declination, using each star’s observation angles.
5) Calculate misalignment angles using each star’s right ascension, declina-tion, position in observation images, orbit data, attitude data, etc.
6) Compare the misalignment calculation results with the designed attitude disturbance, and evaluate the accuracy of misalignment calculation.
The procedures of experimental data construction and misalignment calcula-tion accuracy analysis are shown in Figure 4.
3. Results
3.1. Landmark Navigation
[image:7.595.60.538.494.705.2]The simulated experimental data are shown in Figure 5. Figure 5(a) shows nominal land-sea-mask overlapped with small attitude disturbance, while Figure 5(b) with large disturbance. The attitude disturbance represents the thermal
Figure 3. Procedures of experimental data construction and accuracy analysis of landmark navigation. Land-sea-mask
calculation
Automatic landmark matching Attitude disturbance
design Misalignment calculation
Misalignment calculation accuracy analysis
Re-navigation Automatic landmark
matching Navigation accuracy
analysis
DOI: 10.4236/gep.2017.512011 160 Journal of Geoscience and Environment Protection Figure 4. Procedures of experimental data construction and accuracy analysis of star navigation.
(a)
(b)
Figure 5. Nominal land-sea-mask overlapped with attitude disturbance. (a) Small attitude disturbance; (b)Large attitude disturbance.
Star position calculation (in image coordinate system) Attitude disturbance
design
Misalignment calculation accuracy analysis Coordinate system
transformation Star observation
angle design
Star position calculation (in ECI)
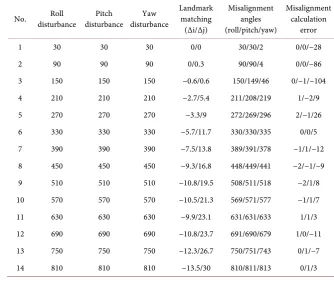
DOI: 10.4236/gep.2017.512011 161 Journal of Geoscience and Environment Protection elastic distortion here. The thermal elastic distortion can reach into hundreds of micro radians on the GOES instruments [4]. The designed attitude disturbances range from 30 to 810 micro radians. Data are processed using the method pre-sented in part 2.2, and the detailed results are given in Table 1. The inputs in-clude disturbances added to roll, pitch, and yaw axes, and important procedures are navigation calculation, automatic landmark matching, and misalignment an-gle calculation. The outputs include landmark deviations and misalignment cal-culation errors, which are the differences of the calcal-culation results and the simu-lated attitude disturbance. The misalignment angle errors of roll axis and pitch axis both range from 0 to 2 micro radians, which are rather small, although there are fluctuations. The misalignment angle errors of yaw axis range from 3 to 104 micro radians. Although the calculation error of yaw axis is larger than the other two axes, the overall results are satisfying for geostationary satellites. The main reason of yaw axis error is from the error of automatic landmark matching, which is difficult to indicate the rotation while attitude disturbance is not very large.
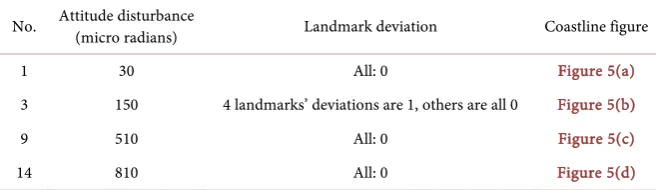
[image:9.595.202.537.449.736.2]To go a step further, image navigation is redone using the calculated misa-lignment angles, and the new landmark matching results are the most useful in-formation in navigation accuracy analysis. This time the automatic landmark matching should be carried out between land-sea-masks obtained from re-navigation and land-sea-masks obtained from original navigation. Several cases of land-sea-masks with attitude disturbances overlapped with re-navigated land-sea-masks are given in Figure 6, in which Australian northern coast and China’s Bohai Bay are
Table 1. Misalignment calculation results of landmarks (unit: micro radians).
No. disturbance Roll disturbance Pitch disturbance Yaw Landmark matching (Δi/Δj)
Misalignment angles (roll/pitch/yaw)
Misalignment calculation
error
1 30 30 30 0/0 30/30/2 0/0/−28
DOI: 10.4236/gep.2017.512011 162 Journal of Geoscience and Environment Protection
(a)
(b)
(c)
(d)
Figure 6. Land-sea-mask with attitude disturbance overlapped with re-navigated land-sea-mask. (a) 30 micro radians disturbance; (b) 150 micro radians disturbance; (c) 510 micro radians disturbance; (d) 810 micro radians disturbance.
[image:10.595.205.541.63.592.2]DOI: 10.4236/gep.2017.512011 163 Journal of Geoscience and Environment Protection Table 2. Re-navigation results.
No. Attitude disturbance (micro radians) Landmark deviation Coastline figure
1 30 All: 0 Figure 5(a)
3 150 4 landmarks’ deviations are 1, others are all 0 Figure 5(b)
9 510 All: 0 Figure 5(c)
14 810 All: 0 Figure 5(d)
medium and large attitude disturbance, and other results are similar. This means the calculation of misalignment angles as well as the whole navigation proce-dures are practicable and effective.
3.2. Star Navigation
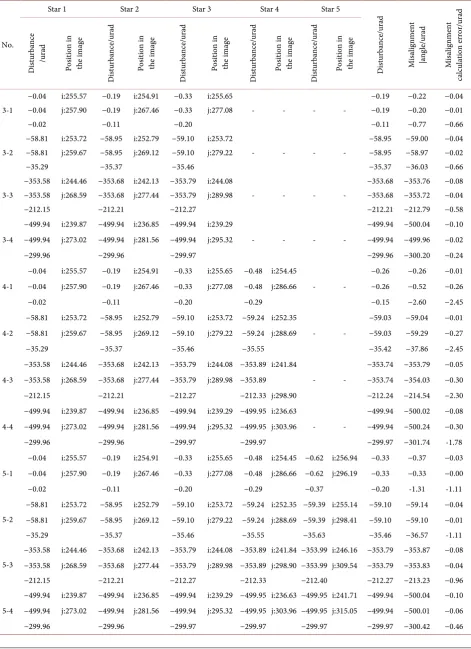
As misalignment angle calculation needs at least three stars’ information, analy-sis is carried out in the case of three, four and five stars. In these different cases, the maximum misalignment angle calculation errors are less than 1, 3 and 2 mi-cro radians, respectively. The maximum misalignment angle calculation errors of roll, pitch, and yaw axis are less than 1, 1, and 3 micro radians, respectively. Although the error of yaw axis is larger than the other two axes, it is still small enough. And the results are pretty stable. Table 3 shows the detailed simulation results. These results demonstrate that the misalignment modeling using stars and calculation are more accurate than using landmarks, which confirms the statement as mentioned above, as the accuracy of star position is higher than 0.1 milliarcseconds and the accuracy of star centroid extraction is higher than that of landmarks. In the face of the challenges in image navigation brought by three-axis stabilized attitude control mode in geostationary orbit, star navigation is indispensable.
4. Conclusion
[image:11.595.210.540.90.185.2]DOI: 10.4236/gep.2017.512011 164 Journal of Geoscience and Environment Protection Table 3. Misalignment calculation results of stars.
No.
Star 1 Star 2 Star 3 Star 4 Star 5
D ist ur ban ce/ ur ad M isa lig nm en t |an gl e/ ur ad M isa lig nm en t ca lcu la tio n e rro r/ ura d D istu rb an ce /u ra d Po sit io n in th e i m age D ist ur ban ce/ ur ad Po sit io n in th e i m age D ist ur ban ce/ ur ad Po sit io n in th e i m age D ist ur ban ce/ ur ad Po sit io n in th e i m age D ist ur ban ce/ ur ad Po sit io n in th e i m age 3-1
−0.04 i:255.57 −0.19 i:254.91 −0.33 i:255.65
- - - -
−0.19 −0.22 −0.04 −0.04 j:257.90 −0.19 j:267.46 −0.33 j:277.08 −0.19 −0.20 −0.01
−0.02 −0.11 −0.20 −0.11 −0.77 −0.66
3-2
−58.81 i:253.72 −58.95 i:252.79 −59.10 i:253.72
- - - -
−58.95 −59.00 −0.04 −58.81 j:259.67 −58.95 j:269.12 −59.10 j:279.22 −58.95 −58.97 −0.02
−35.29 −35.37 −35.46 −35.37 −36.03 −0.66
3-3
−353.58 i:244.46 −353.68 i:242.13 −353.79 i:244.08
- - - -
−353.68 −353.76 −0.08 −353.58 j:268.59 −353.68 j:277.44 −353.79 j:289.98 −353.68 −353.72 −0.04
−212.15 −212.21 −212.27 −212.21 −212.79 −0.58
3-4
−499.94 i:239.87 −499.94 i:236.85 −499.94 i:239.29
- - - -
−499.94 −500.04 −0.10 −499.94 j:273.02 −499.94 j:281.56 −499.94 j:295.32 −499.94 −499.96 −0.02
−299.96 −299.96 −299.97 −299.96 −300.20 −0.24
4-1
−0.04 i:255.57 −0.19 i:254.91 −0.33 i:255.65 −0.48 i:254.45
- -
−0.26 −0.26 −0.01 −0.04 j:257.90 −0.19 j:267.46 −0.33 j:277.08 −0.48 j:286.66 −0.26 −0.52 −0.26
−0.02 −0.11 −0.20 −0.29 −0.15 −2.60 −2.45
4-2
−58.81 i:253.72 −58.95 i:252.79 −59.10 i:253.72 −59.24 i:252.35
- -
−59.03 −59.04 −0.01 −58.81 j:259.67 −58.95 j:269.12 −59.10 j:279.22 −59.24 j:288.69 −59.03 −59.29 −0.27
−35.29 −35.37 −35.46 −35.55 −35.42 −37.86 −2.45
4-3
−353.58 i:244.46 −353.68 i:242.13 −353.79 i:244.08 −353.89 i:241.84
- -
−353.74 −353.79 −0.05 −353.58 j:268.59 −353.68 j:277.44 −353.79 j:289.98 −353.89 −353.74 −354.03 −0.30 −212.15 −212.21 −212.27 −212.33 j:298.90 −212.24 −214.54 −2.30
4-4
−499.94 i:239.87 −499.94 i:236.85 −499.94 i:239.29 −499.95 i:236.63
- -
−499.94 −500.02 −0.08 −499.94 j:273.02 −499.94 j:281.56 −499.94 j:295.32 −499.95 j:303.96 −499.94 −500.24 −0.30 −299.96 −299.96 −299.97 −299.97 −299.97 −301.74 -1.78
5-1
−0.04 i:255.57 −0.19 i:254.91 −0.33 i:255.65 −0.48 i:254.45 −0.62 i:256.94 −0.33 −0.37 −0.03 −0.04 j:257.90 −0.19 j:267.46 −0.33 j:277.08 −0.48 j:286.66 −0.62 j:296.19 −0.33 −0.33 −0.00 −0.02 −0.11 −0.20 −0.29 −0.37 −0.20 -1.31 -1.11
5-2
−58.81 i:253.72 −58.95 i:252.79 −59.10 i:253.72 −59.24 i:252.35 −59.39 i:255.14 −59.10 −59.14 −0.04 −58.81 j:259.67 −58.95 j:269.12 −59.10 j:279.22 −59.24 j:288.69 −59.39 j:298.41 −59.10 −59.10 −0.01 −35.29 −35.37 −35.46 −35.55 −35.63 −35.46 −36.57 -1.11
5-3
−353.58 i:244.46 −353.68 i:242.13 −353.79 i:244.08 −353.89 i:241.84 −353.99 i:246.16 −353.79 −353.87 −0.08 −353.58 j:268.59 −353.68 j:277.44 −353.79 j:289.98 −353.89 j:298.90 −353.99 j:309.54 −353.79 −353.83 −0.04 −212.15 −212.21 −212.27 −212.33 −212.40 −212.27 −213.23 −0.96
5-4
DOI: 10.4236/gep.2017.512011 165 Journal of Geoscience and Environment Protection
Acknowledgements
This work was supported by the National Natural Science Foundation of China (Grant No. 61172113 and 91338109).
References
[1] NOAA and NASA (2005) GOES N Data Book (Rev B). NASA, Washington DC. [2] Lu, F., Zhang, X. and Xu, J. (2008) Image Navigation for the FY2 Geostationary
Meteorological Satellite. Journal of Atmospheric and Oceanic Technology, 25, 1149-1165. https://doi.org/10.1175/2007JTECHA964.1
[3] Harris, J. and Just, D. (2010) INR Performance Simulations for MTG. SpaceOps 2010 Conference of the American Institute of Aeronautics and Astronautics, Ala-bama, 25-30 April 2010.https://doi.org/10.2514/6.2010-2322
[4] Carr, J. (2009) Twenty-Five Years of INR. Journal of the Astronautical Sciences, 57, 505-515. https://doi.org/10.1007/BF03321514
[5] Li, Q. and Dong, Y. (2008) Achievement and Forecast of Meteorological Satellite Technology in China. Aerospace Shanghai,25, 1-10.
[6] U.S. DOC, NOAA, NESDIS and NASA (2014) Product Definition and Users’ Guide (PUG) Volume 5A: Level 2+ Products. NOAA, Washington DC.
[7] Yang, L. and Yang, Z. (2009) Automatic Image Navigation Method for Remote Sensing Satellite. Computer Engineering and Applications, 45, 204-207.
[8] Yang, L., Feng, X., Lv, K. and Shang, J. (2014) Automated Landmark Matching of FY-2 Visible Imagery with Its Applications to the On-Orbit Image Navigation Per-formance Analysis and Improvements. Chinese Journal of Electronics, 23, 649-654. [9] Yang, L. and Shang, J. (2011) Modeling and Computation on the Attitude