ORIGINAL RESEARCH
Association between Carotid Artery Plaque Type
and Cerebral Microbleeds
L. Saba R. Montisci E. Raz R. Sanfilippo J.S. Suri M. Piga
BACKGROUND AND PURPOSE: CMBs have become increasingly recognized with the widespread use of MR imaging techniques that are sensitive to iron deposits. The purpose of this study was to correlate the presence of CMBs and carotid plaque characteristics.
MATERIAL AND METHODS:Seventy consecutive patients (47 men; 23 women; mean age, 65 years) were prospectively analyzed. Carotid arteries were studied using a 16-detector row CT scanner, whereas the brain was explored with an MR imaging 1.5T system. CMBs were studied using a T2*-weighted GRE sequence. CMBs were classified by an ordinal scale and carotid plaques were characterized based on their composition as fatty, mixed, or calcified. Patients were classified as symptomatic and asymptomatic. Chi-square and multiple logistic regression analyses, as well as ROCs, were calculated.
RESULTS: The prevalence of CMBs was 30%. A statistically significant difference in CMB prevalence was observed between symptomatic (46%) and asymptomatic (19%) patients (Pvalue⫽.0021; OR⫽ 3.7). Correlation analysis demonstrated an association between the number of CMBs and the symp-toms (P⫽.0001). A statistically significant association was observed between the presence of fatty plaque and CMBs (P⫽.0019).
CONCLUSIONS:The results of this study suggest an association between the presence of carotid artery fatty plaque, symptoms, and CMBs. Moreover, we found that the presence (and entity) of CMBs may represent an indicator of cerebrovascular symptom severity.
ABBREVIATIONS:AUC⫽area under the ROC curve; CMB⫽cerebral microbleed; GRE⫽gradient recalled-echo; HU⫽Hounsfield unit; MDCTA⫽multidetector row CT angiography; OR⫽odds ratio; ROC⫽receiving operator characteristic
C
MBs are small, rounded hypointensities visualized on GRE T2*-weighted MR imaging brain scans that are in-creasingly detected in patients with ischemic stroke.1-3It has been suggested that microbleeds are a useful biomarker for pathologic damage to small vessels from hypertension or ce-rebral amyloid angiopathy, but little is known about the de-velopment of CMBs over time in patients with ischemic stroke, though they may have cumulative effects on brain function, including cognition.4There are controversial results suggesting that the presence of cerebral microbleeds indicates an increased risk of bleeding complications from thrombolytic treatment or the use of antiplatelet drugs,5,6and some authors found that presence of CMBs is related to risk of hemorrhagic transformation after ischemic stroke and to recurrence of spontaneous intracerebral bleeding.7,8The question of whether CMBs are an expression of diffuse disease or the consequence of other factors, such as carotid plaque composition, is still debated,9and the hypothesis we explore in this study is whether there might be a relationship between the presence of CMBs and the presence and charac-teristics of carotid plaque. Within the last several years, it was demonstrated that the composition of the carotid plaque plays
a fundamental role in stroke risk assessment,10-15and MDCTA demonstrated to be an excellent and reproducible technique for the study of carotid artery plaque composition.16-21We will test our hypothesis by studying carotid plaque type using MDCTA and the presence of CMBs using MR imaging.
Materials and Methods
Study Design and Patient Population
Institutional review board approval for this study was obtained. Based on a power calculation (type I error,␣⫽0.05; type II error,⫽0.1; AUC null hypothesis value⫽0.5; AUC significant value ⫽0.75, pooled group), we estimated that a sample size of at least 70 carotid arteries would be sufficient for investigating the relationship between carotid artery plaque type and CMBs. Therefore, 70 consecutive pa-tients (47 men, 23 women; mean age, 65 years; range, 42– 86 years) were prospectively enrolled in this study from May 2009 to June 2010. All patients underwent MDCTA of supra-aortic vessels and brain MR imaging.
At our institute (Azienda Ospedaliera Universitaria di Cagliari), inclusion criteria for performing MDCTA of carotid arteries were previously published22,23and are as follows: presence of a sonography
examination that showed a pathologic stenosis (50% of stenosis ac-cording to the NASCET criteria22-24) and/or a plaque alteration that
was considered as the presence of a heterogeneous plaque, an irregu-lar surface, intraplaque hemorrhage, and/or the presence of ulcer-ation in the plaque. Another criterion for performing MDCTA was identified when the ultrasound could not provide adequate informa-tion about the degree of stenosis and plaque type. Known allergies to iodinated contrast material or elevated renal function tests were con-sidered as exclusion criteria for the MDCTA examination.
Received October 4, 2011; accepted after revision February 27, 2012.
From the Departments of Radiology (L.S.), Vascular Surgery (R.M., R.S.), and Nuclear Medicine (M.P.), Azienda Ospedaliero Universitaria, di Cagliari, Cagliari, Italy; Department of Radiology (E.R.), New York University Langone Medical Center, New York, New York; Biomedical Engineering (J.S.S.), Idaho State University, Pocatello, Idaho; and Global Biomedical Technologies Inc. (J.S.S.), Roseville, California.
Please address correspondence to Luca Saba, MD, Department of Radiology, Azienda Ospedaliero Universitaria, di Cagliari – Polo di Monserrato s.s. 554 Monserrato, Cagliari, 09045, Italy; e-mail: lucasaba@tiscali.it
We did not include those patients with a potentially confounding condition (ie, suspected embolism from a cardiac source, follow-up after carotid endarterectomy, intracerebral aneurysms, brain tumors) or with posterior cerebrovascular symptoms in this study.
At our institution, carotid arteries of asymptomatic patients were also studied in those patients who underwent cardiac interventions for coronary artery disease, aortic interventions, and lower-leg artery surgery, and in diabetics who were⬎50 years old.
Classification of Cerebrovascular Symptoms
Vascular risk factors and coexisting comorbidities and treatment known before stroke or transient ischemic attack are systematically recorded in our institution. Causes of stroke were classified according to Trial of Org 10172 in Acute Stroke Treatment criteria.25We
clas-sified patients as symptomatic or asymptomatic according to the neu-rologic assessment documented in the clinical chart review. In the case of a TIA or stroke, a patient was considered symptomatic. TIA was regarded as an episode of neurologic dysfunction (hemiparesis, hemiparesthesia, dysarthria, dysphasia, or monocular blindness) not exceeding 24 hours. If the episode of neurologic dysfunction exceeded 24 hours, it was classified as a stroke. The time window to be included in the symptomatic group was 3 months; when a patient underwent MDCTA examination⬎3 months after the TIA or stroke event, he or she was excluded from the symptomatic group and included in the asymptomatic group. Diabetes was indicated by an abnormal fasting plasma glucose level (⬎7.9 mmol/l) or the current use of insulin or an oral hypoglycemic agent. Dyslipidemia was defined as abnormal fast-ing plasma cholesterol (low-attenuation lipoprotein cholesterol) lev-els (fasting cholesterol⬎5.0 mmol/l) or the current use of lipid-low-ering agents (only if these agents were prescribed for a history of hyperlipidemia or dyslipidemia). Essential hypertension included those patients with systolic blood pressure⬎140 mm Hg and/or dia-stolic blood pressure⬎90 mm Hg, or who were being treated with blood-pressure-lowering drugs. Cigarette smoking status was catego-rized as never/former (24 months) or current.
MDCTA Technique
All patients underwent MDCTA of the supra-aortic vessels with a 16 multidetector row CT system (Brilliance; Philips, Best, the Nether-lands) using a technique previously described.24,26 Angiographic
phase was obtained by injecting 80 mL of contrast medium (Ultravist 370; Bayer, Leverkusen, Germany) at a flow rate of 5 mL/s. A bolus
tracking technique was used to calculate the correct timing of the scan. CT technical parameters included matrix 512⫻512; FOV 14 –19 cm; mAs 180 –220; kV 120 –140; an intermediate reconstruc-tion algorithm (C-filter) was used. Angiographic acquisireconstruc-tion included the carotid siphon. None of the patients included in the study had a medical history of cardiac output failure or any contraindications to iodinated contrast media.
Brain MR Technique
Imaging examinations were performed with a Gyroscan 1.5T super-conducting magnet (Philips) with a head coil, according to a stan-dardized protocol. In all participants, conventional 2D T2*-weighted GRE MR imaging was performed (TR shortest; TE 23 ms; flip angle 15°; in-plane resolution 0.9⫻0.9 mm; FOV 230 mm; matrix 512⫻ 512; section thickness 5 mm; 0.5 mm intersection gap). Two-dimen-sional T2*-weighted GRE was performed with flow compensation, with an echo time of 20 msec and a section thickness of 5 mm, in line with conventional settings.27-29DWI was performed with single-shot
spin-echo with 2 diffusion sensitivity values of 0 and 1000 seconds/ mm2along the transverse axis. In addition to T2*-weighted GRE and
DWI sequences, axial spin-echo T1-weighted images (500 – 600/15/2 for TR/TE/excitations) and fast spin-echo T2-weighted images (2200 –3200/80 –120/1,2 for TR/TE/excitations; turbo factor, 24) were also obtained with the same section thickness.
CMBs Definition and Rating
Acquisition date and participant identification were removed from all images. Two experienced radiologists (L.S. and E.R., with 10 and 8 years of experience, respectively), unaware of the clinical data, re-viewed, blinded to each other, all images for presence and location of CMBs. This analysis was performed to evaluate the interobserver vari-ability. After a 3-week gap, datasets were reanalyzed in consensus to obtain the reference parameter for the statistical analysis. At this time, the T1-weighted images were additionally used to confirm the loca-tion of microbleeds, as the inherent properties of microbleeds will cause these to appear as a focus of low signal intensity (without marked blooming) on the weighted image as well. Thus, the T1-weighted image further facilitated differentiation of microbleeds from calcification in the ventricle or from sulcal vessels.30The
pres-ence, location, and number of all cerebral microbleeds was recorded. In our study, CMBs were considered as focal, rounded, or circular areas of very low signal intensity that were smaller than 10 mm in size,
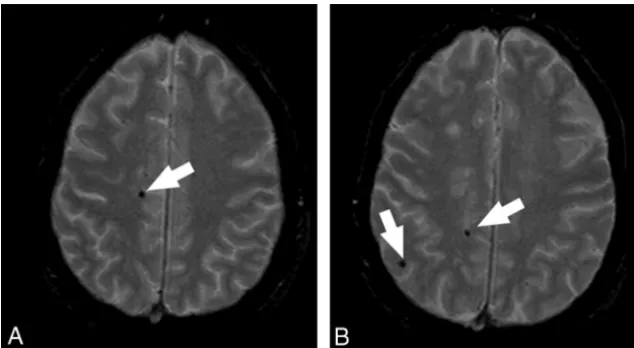
Fig 1.MR axial images that demonstrate the presence of CMBs. Thewhite arrowsindicate the CMBs.
EXTRACRANIAL
VASCULAR
ORIGINAL
[image:2.594.135.452.43.217.2]as suggested by Jeerakathil et al31(Fig 1).In accordance with
consen-sus guidelines on standards for neuroimaging in vascular cognitive impairment, we considered 2 mm as the lower size limit.32We also
categorized the locations of the CMBs27,31as lobar (cortical gray
mat-ter and subcortical white matmat-ter), deep (deep gray matmat-ter [basal gan-glia and thalamus] and deep white matter [corpus callosum]), or infratentorial (brain stem and cerebellum). Symmetric hypointensi-ties in the globi pallidi, likely to represent calcification, and sulcal flow voids from cortical vessels were disregarded.33
Microbleeds were classified in each cerebral hemisphere (and for infratentorial lesions, these were considered in the right/left cerebel-lum of right/left side of the brain stem) as absent (grade 1), mild (grade 2; total number of microbleeds, 1–2), moderate (grade 3; total number of microbleeds, 3–10), and severe (grade 4; total number of microbleeds,⬎10), according to Lee and colleagues.34
Carotid Artery Plaque Classification
A single experienced radiologist (L.S., 10 years of experience), blinded to the clinical information and MR brain analysis, performed all MDCTA measurements. MDCTA axial images were analyzed, with a varying magnification from 120%– 400%, in comparison with the acquisition. Window parameters (width and level) were not pre-set.18,35We categorized different types of plaques, dividing them into
fatty plaques, with attenuation⬍60 HU; mixed plaques, with atten-uation between 60 –120 HU; and calcified plaques, with attenatten-uation
⬎130 HU (Fig 2). To measure HU value, a circular or elliptical ROI cursor in the predominant area of plaque was used by the method outlined according to Saba et al.12Regions of beam hardening in
calcified areas were also excluded. The radiologist took the measure-ments at the point of major stenosis, which was identified by elabo-rating oblique axial images normal to the ICA lumen centerline.
Statistical Analysis
For the analysis of the data, we considered the carotid and cerebral hemisphere of each side as an independent unit. Therefore, the total number of studied carotid arteries and brain hemispheres was 140. In symptomatic patients, we considered the ipsilateral carotid artery and brain hemisphere as “symptomatic,” and the contralateral carotid
artery and brain hemisphere as “asymptomatic,” whereas in asymp-tomatic patients, both carotids and brain hemispheres were consid-ered “asymptomatic.” In symptomatic patients, we considconsid-ered a symptomatic side and asymptomatic side according to the clinical symptoms, whereas in asymptomatic patients, both sides were con-sidered asymptomatic. We tested the interobserver reliability for CMB rating using the Cohentest.36Continuous data were described
as the mean value⫾SD and were compared using the Wilcoxon signed rank test. ROC curve analysis was performed to identify thresholds in number of CMBs associated with presence of symp-toms. The Studentttest for paired samples was used to test the dif-ference in the number of CMBs in the same subjects between the side with the fatty plaques and the side without the fatty plaques. Presence or absence of cerebrovascular symptoms was compared between pa-tients with and without CMBs, according to the different plaque types, using a Cochran-Mantel-Haenszel test. Logistic regression and stepwise logistic regression analysis was used to identify the most accurate linear combinations of distinguishing variables. R software (http://www.r-project.org) was used for statistical analyses.
Results
The clinical characteristics of the studied patients are shown in Table 1. We observed 39 patients (55.7%) with ischemic symptoms (12 with strokes, 20 with cerebral TIAs, 7 with monocular TIAs) and 31 without ischemic symptoms. There-Fig 2.CTA axial images that demonstrate (A) fatty plaque, (B) mixed plaque, and (C) calcified plaque.
Table 1: Patient characteristics
Presence of CMBs Absence of CMBs PValue Age (mean [SD]) 63 years (14.5 years) 65 years (13.3 years) .42
Sex (male) 71% 67% .74
Tobacco user 52% 37% .22
Hypertension 62% 45% .19
CAD 52% 53% .95
Diabetes 21% 12% .36
Dyslipidemia 43% 49% .64
Statins and other lipid-lowering drugs
43% 33% .41
[image:3.594.52.532.43.262.2]fore, we had 39 symptomatic sides and 101 asymptomatic sides. The prevalence of the CMBs was 30% (21/70); in 16 patients, we found CMBs in both hemispheres, and in 5 pa-tients, CMBs were found in only 1 hemisphere; thus, we had 37 hemispheres with CMBs and 103 hemispheres without CMBs. On the symptomatic side, there was a 46% (18/39) preva-lence of CMBs, whereas on the asymptomatic side, there was a 19% (19/101) prevalence; a statistically significant difference between CMB presence was observed, with aPvalue of .0021 and an odds ratio of 3.7.
The radiologists showed very good interobserver agree-ment in the identification of CMBs, with avalue of 0.81.
Relationship of Cerebrovascular Symptoms and CMBs
We performed an analysis to evaluate the relationship between the number of CMBs (and their grade, from 1 to 4) and the presence of cerebrovascular symptoms. We observed a statis-tically significant correlation between the presence of symp-toms and the number of CMB (correlation coefficient ⫽ 0.319;Pvalue⫽.0001) and the CMBs grade (correlation co-efficient⫽0.314;Pvalue⫽.0001). We also analyzed the as-sociation between the different subtypes of cerebrovascular symptoms (stroke, TIA, and amaurosis) with the presence of CMBs, and found a strong association between stroke (P⫽ .0001; OR⫽10.71), but no association with TIA (P⫽.347; OR⫽1.62) and amaurosis (P⫽.895; OR⫽1.12).
Relationship of Plaque Type and CMBs
In the plaque type analysis of the 140 carotid arteries, we ex-cluded 14 because there was no evidence of plaque. In the remaining 126 carotid arteries, we found 37 fatty plaques (29.4%), 49 mixed plaques (38.9%), and 40 calcified plaques (31.8%). In 2 cases CMBs were found in the 14 excluded hemi-spheres, supplied by an regular ICA, and therefore the plaque type analysis was performed by considering 35 hemispheres with CMBs. All 39 symptomatic hemispheres had a plaque in the carotid artery and therefore were included in the analysis. A summary of the plaque type analysis, according to the presence of CMBs and symptoms, is given in Table 2. The Cochran-Mantel-Haenszel test showed that there was a statis-tically significant increase (P⫽.012; OR⫽3.465) in CMB prevalence in symptomatic patients versus that in asymptom-atic patients.
In analyzing the relationship between CMBs and the type of plaque, we performed a correlation analysis and found a statistically significant correlation with the fatty plaques (cor-relation coefficient⫽ 0.271; Pvalue⫽ .0019), whereas an inverse statistical trend was observed between CMBs and
cal-cified plaques (correlation coefficient⫽ ⫺0.152;Pvalue⫽ .0851). No statistically significant association was detected be-tween CMBs and mixed plaque type (correlation coefficient⫽ ⫺0.117;Pvalue⫽.188).
In analyzing whether CMBs are an expression of diffuse disease or the consequence of an unstable plaque, we per-formed a Studentt test for paired samples and observed a statistical trend (Pvalue of .0699).
ROC Curve Analysis
The ROC curve analysis for symptoms versus number of CMBs is shown in Fig 3A. The ROC area under the curve (Az) for the direct-mm method was 0.646 (95% CI 0.561– 0.724; SD⫽0.054;P⫽.0069). Using the ROC analysis, we calculated the sensitivity, specificity, positive likelihood ratio and nega-tive likelihood ratio values for the direct-mm method; a sum-mary of these values is provided in Table 3. By analyzing threshold values, we observed that the presence of 5 CMBs are associated with a specificity of 90.2% for the presence of cere-brovascular symptoms. We also performed the ROC curve analysis for stroke, TIA, and amaurosis (Fig 3B-D) and we obtained the following AUCs, respectively: 0.802 (P⫽.0001), 0.464 (P⫽.61), and 0.526 (P⫽.819), by confirming that there is an association between CMBs and stroke but not between CMBs and TIA or amaurosis
Logistic Regression Analysis
To exclude any confounding effect between CMBs and other potentially related variables, logistic regression analysis was performed with CMB as the dependent variable, plaque type as the independent variable, and other factors such as hyperten-sion, diabetes, tobacco use, coronary artery disease, and dys-lipidemia as cofactors (Table 4). This analysis demonstrated that the only statististically significant association was present between CMBs and fatty plaques. Next, the stepwise logistic regression analysis was performed; the results are provided in Table 5. In the stepwise logistic regression model, the depen-dent variable was the presence of cerebrovascular symptoms, and we included the following parameters: sex of the patient, coronary artery disease, diabetes, hypertension, dyslipidemia, tobacco use, type of plaque (fatty, mixed, calcified), and pres-ence of CMBs. The stepwise logistic regression model indi-cated that CMBs and fatty plaques were both independent variables associated with cerebrovascular symptoms (Pvalues, respectively, .0026 and .0018). Other variables did not demon-strate a significant statistical association with cerebrovascular symptoms.
Results Based on CMB Location
In 13 cases (9.3%), we had only lobar CMBs; in 14 cases (10%), we found only deep CMBs; whereas in 9 cases (8.2%), we found combined (both deep and lobar) CMBs. We observed CMBs in the cerebellum (right side) in only 1 case (0.7%).
Discussion
In the past, it has been suggested that CMBs may be a bio-marker for pathologic damage to small vessels from hyperten-sion or cerebral amyloid angiopathy,37,38but some important areas of clinical uncertainty regarding microbleeds remain, in particular, their potential role in predicting the risk of intra-Table 2: Plaque type analysis
Symptomatic Patient CMBs (n⫽39)
Asymptomatic Patient CMBs
(n⫽87)
Presence Absence Presence Absence
Fatty plaques (n⫽37)
13 9 7 8
Mixed plaques (n⫽49)
6 7 3 33
Calcified plaques (n⫽40)
[image:4.594.51.283.59.168.2]cranial hemorrhage (especially in patients treated with throm-bolytics or antithrombotics), their contribution to cognitive impairment, and their value for diagnosing small vessel diseases.4,39
In our population, the prevalence of the CMBs was 30% (21/70); this result is a little higher compared with the preva-lence of CMBs detected in the recently published Rotterdam scan study40(28%); however, in our research, the percentage of symptomatic patients is higher compared with the Rotter-dam study and this fact may justify the higher value. The prev-alence of CMBs is lower compared with Vernooij et al,30where it was 35.5%; however, this difference can be explained with the different technique used by these authors (3D T2*-weighted GRE).
We observed a statistically significant difference in CMB prevalence in the symptomatic versus asymptomatic side (Pvalue⫽.0021; OR⫽3.7). This result may suggest that the CMBs are associated with the presence of cerebrovascular events and are confirmed by the ROC curve analysis (AUC⫽ 0.646;Pvalue⫽0069) and by the logistic regression analysis (P⫽.0026). However, in the analysis of our results, it is im-portant to underline that in the symptomatic hemispheres, the prevalence of fatty plaques was markedly higher (56%) com-pared with the mixed (33%) and calcified plaques (10%). This fact may represent a bias and, therefore, this association should be confirmed in further longitudinal and prospective analyses. However, the logistic regression analysis showed that both CMBs and fatty plaques are independent variables asso-ciated with the presence of cerebrovascular symptoms.
[image:5.594.135.447.44.352.2]We also analyzed the relationship between the different type of cerebrovascular symptoms (stroke, TIA, amaurosis) and observed unexpected results: there was a strong associa-tion between the stroke and presence of CMBs (P⫽.0001; OR 10.71) but no association with TIA (P⫽.347; OR 1.62) and amaurosis (P⫽.895; OR⫽1.12). Moreover, the ROC curve analysis (Fig 3B) demonstrated that the number of CMBs has a statistically significant association with stroke (AUC ⫽ 0.802;P⫽.0001). This is an interesting finding—is the pres-ence of CMBs an indicator of the cerebrovascular symptom severity (stroke⬎TIA⬎amaurosis)? Or is it the severity of the cerebrovascular event that may determine the presence (or not) of CMB and its entity? These data are concordant with previous research by Ovbiagele et al,41where the authors dem-onstrated that CMBs are more frequently noted in hospital-Fig 3.ROC curves between presence of CMBs and (A) cerebrovascular symptoms, (B) stroke, (C) TIA, and (D) amaurosis.
Table 3: ROC curve analysis
Criteriona Sensitivity 95% CI Specificity 95% CI ⫹LR ⫺LR
ⱖ0 100.00 90.9–100.0 0.00 0.0–3.6 1.00
⬎0 46.15 30.1–62.8 81.37 72.4–88.4 2.48 0.66
⬎1 46.15 30.1–62.8 82.35 73.5–89.2 2.62 0.65
⬎2 33.33 19.1–50.2 84.31 75.8–90.8 2.12 0.79
⬎4 33.33 19.1–50.2 89.22 81.5–94.5 3.09 0.75
⬎5 25.64 13.1–42.1 90.20 82.7–95.2 2.62 0.82
⬎6 23.08 11.2–39.3 93.14 86.4–97.2 3.36 0.83
⬎7 20.51 9.3–36.5 93.14 86.4–97.2 2.99 0.85
⬎8 17.95 7.6–33.5 98.04 93.1–99.7 9.15 0.84
⬎9 15.38 5.9–30.5 98.04 93.1–99.7 7.85 0.86
⬎11 15.38 5.9–30.5 99.02 94.6–99.8 15.69 0.85
⬎15 12.82 4.3–27.4 100.00 96.4–100.0 0.87
⬎20 0.00 0.0–9.1 100.00 96.4–100.0 1.00
Note:—Cl indicates confidence interval; LR, likelihood ratio. a
[image:5.594.52.286.380.541.2]ized stroke. It is our opinion that the presence of CMBs may represent an indicator for cerebrovascular symptom severity (stroke⬎TIA⬎amaurosis); however, to correctly verify this hypothesis, a specific prospectively designed study should be performed.
By analyzing the relationship between CMBs and the type of the plaque, we found a statistically significant correlation with the fatty plaques (correlation coefficient ⫽ 0.271; P value⫽.0019), whereas an inverse statistical trend was ob-served between CMBs and calcified plaques (correlation coef-ficient⫽ ⫺0.152;Pvalue⫽.0851). No statistically significant association was detected between CMBs and mixed plaque type (correlation coefficient⫽ ⫺0.117;Pvalue⫽.188).
By comparing the hemispheres of the same patient, con-cerning the number of microbleeds, we also tried to explore the question of whether CMBs are an expression of a diffuse disease or the consequence of an unstable plaque. In the 16 patients with CMBs with a carotid fatty plaque, and with the contralateral carotid artery mixed or calcified, we observed that there was a statistical trend (P⫽.0699) toward the in-crease of CMBs in those hemispheres ipsilateral to the pres-ence of a carotid fatty plaque. However, for the purpose of this analysis, 16 patients represent a very small population and we think that this kind of hypothesis should be tested using bigger samples. Moreover, our results should be further tested and confirmed, as we explored abnormalities that are from differ-ent vascular territories: 1 in the microvascular bed and the other on a large vessel.
In our study, we observed that the distribution of CMBs is quite homogeneous and that 8.2% of patients had both deep and lobar CMBs. Our results are concordant with previous research by Staals et al,33where 8.9% of patients had only lobar CMBs, 13.8% had only deep CMBs, and 5.7% had combined (both deep and lobar) CMBs. In our population, we did not find any CMBs in the brain stem. In the article by Gregoire et al,42the CMBs were most prevalent in the lobar region (17%– 22%), followed by the deep (14%–15%) and infratentorial re-gions (6%–12%).
There are some limitations of our research. First, the
pa-tient population included in our data base had significant symptomatic cerebral vascular diseases (55.7%); the preva-lence of disease in this study was higher compared with the general population, and this fact may relate to differences in the pool of the plaque composition. Second, it is possible that, in some cases, there is a potential misclassification of CMBs. In fact, other structures in the brain may resemble microbleeds on MR images, such as calcifications in basal ganglia or the pineal gland. However, we believe that we did not misclassify other structures as CMBs, as calcifications in the brain usually have a typical location and shape, and when located in the basal ganglia, they are usually symmetric in distribution.
Conclusions
The results of this study suggest an increased number of CMBs in symptomatic patients and indicate an association between the presence of carotid artery fatty plaque, symptoms, and CMBs. Our results seems to indicate that the presence (and entity) of CMBs may represent an indicator of cerebrovascular symptom severity.
References
1. Werring DJ, Coward LJ, Losseff NA, et al.Cerebral microbleeds are common in ischemic stroke but rare in TIA.Neurology2005;65:1914 –18
2. Fazekas F, Kleinert R, Roob G, et al.Histopathologic analysis of foci of signal loss on gradient-echo T2*-weighted MR images in patients with spontaneous intracerebral hemorrhage: evidence of microangiopathy-related microb-leeds.AJNR Am J Neuroradiol1999;20:637– 42
3. Atlas SW, Mark AS, Grossman RI, et al.Intracranial hemorrhage: gradient-echo MR imaging at 1.5 T: comparison with spin-gradient-echo imaging and clinical applications.Radiology1988;168:803– 07
4. Werring DJ, Frazer DW, Coward LJ, et al.Cognitive dysfunction in patients with cerebral microbleeds on T2*-weighted gradient-echo MRI.Brain2004; 127:2265–75
5. Leblanc R, Haddad G, Robitaille Y.Cerebral hemorrhage from amyloid angi-opathy and coronary thrombolysis.Neurosurgery1992;31:586 –90 6. Wong KS, Chan YL, Liu JY, et al.Asymptomatic microbleeds as a risk factor for
aspirin-associated intracerebral hemorrhages.Neurology2003;60:511–13 7. Naka H, Nomura E, Wakabayashi S, et al.Frequency of asymptomatic
microb-leeds on T2*-weighted MR images of patients with recurrent stroke: associa-tion with combinaassocia-tion of stroke subtypes and leukoaraiosis.AJNR Am J Neu-roradiol2004;25:714 –19
8. Imaizumi T, Horita Y, Hashimoto Y, et al.Dotlike hemosiderin spots on
T2*-Table 4: Logistic regression model: CMB dependent variable
Variable Coefficient SE P Odds Ratio 95% CI
Age 0.0227 0.0207 0.2721 1.023 0.9823 to 1.0653
CAD 0.6966 0.4579 0.1282 2.007 0.8181 to 4.9239
Diabetes 0.8106 1.218 0.5057 0.4446 0.0409 to 4.8389
Hypertension 0.0461 0.5864 0.9374 1.0471 0.3318 to 3.3047
Dyslipidemia 0.096 0.4907 0.8449 1.1008 0.4207 to 2.8801
Gender 1.0567 0.7076 0.1353 2.877 0.7189 to 11.5139
Tobacco use 0.4274 0.5807 0.4618 1.5332 0.4913 to 4.7850
Calcified plaques 0.0316 0.5843 0.9568 1.0321 0.3284 to 3.2443
Mixed plaques 0.7566 0.678 0.2645 2.131 0.5642 to 8.0490
Fatty plaques 1.5647 0.4499 0.0005 4.7811 1.9796 to 11.5471
[image:6.594.52.534.58.173.2]Note:—CI indicates confidence interval; SE, standard error; CAD indicates coronary artery disease.
Table 5: Stepwise logistic regression model
Variable Coefficient SE P Odds Ratio 95% CI
CMBs 1.3977 0.464 0.0026 4.046 1.6296 to 10.0453
Fatty plaques 1.4005 0.4481 0.0018 4.0572 1.6859 to 9.7637
Constant ⫺1.8148
[image:6.594.50.536.204.255.2]weighted magnetic resonance imaging as a predictor of stroke recurrence: a prospective study.J Neurosurg2004;101:915–20
9. Bos D, Ikram MA, Elias-Smale SE, et al.Calcification in major vessel beds relates to vascular brain disease.Arterioscler Thromb Vasc Biol2011;31:2331–37 10. Naghavi M, Libby P, Falk E, et al.From vulnerable plaque to vulnerable patient: a call for new definitions and risk assessment strategies: Part II. Cir-culation2003;108:1772–78
11. Wintermark M, Jawadi SS, Rapp JH, et al.High-resolution CT imaging of ca-rotid artery atherosclerotic plaques.AJNR Am J Neuroradiol2008;29:875– 82 12. Saba L, Montisci R, Sanfilippo R, et al.Multidetector row CT of the brain and
carotid artery: a correlative analysis.Clin Radiol2009;64:767–78
13. Moody AR, Murphy RE, Morgan PS, et al.Characterization of complicated carotid plaque with magnetic resonance direct thrombus imaging in patients with cerebral ischemia.Circulation2003;107:3047–52
14. Saba L.CT imaging in the carotid artery.In: Suri JS, Kathuria C, Molinari F, eds.
Atherosclerosis Disease Management.New York: Springer-Verlag, 2010: 333–76 15. Rozie S, de Weert TT, de Monye´ C, et al.Atherosclerotic plaque volume and composition in symptomatic carotid arteries assessed with multidetector CT angiography; relationship with severity of stenosis and cardiovascular risk factors.Eur Radiol2009;19:2294 –301
16. Saba L, Sanfilippo R, Pascalis L, et al.Carotid artery abnormalities and leu-koaraiosis in elderly patients: evaluation with MDCT.AJR Am J Roentgenol
2009;192:W63–70
17. Saba L, Mallarini G.Fissured fibrous cap of vulnerable carotid plaques and symptomaticity: are they correlated? Preliminary results by using multi-de-tector-row CT angiography.Cerebrovasc Dis2009;27:322–27
18. Saba L, Mallarini G.Window settings for the study of calcified carotid plaques with multidetector CT angiography.AJNR Am J Neuroradiol2009;30:1445–50 19. Wintermark M, Arora S, Tong E, et al.Carotid plaque computed tomography
imaging in stroke and nonstroke patients.Ann Neurol2008;64:149 –57 20. de Weert TT, Ouhlous M, Meijering E, et al.In vivo characterization and
quan-tification of atherosclerotic carotid plaque components with multidetector computed tomography and histopathological correlation.Arterioscler Thromb Vasc Biol2006;26:2366 –72
21. de Weert TT, Ouhlous M, Zondervan PE, et al.In vitro characterization of atherosclerotic carotid plaque with multidetector computed tomography and histopathological correlation.Eur Radiol2005;15:1906 –14
22. Saba L, Pascalis L, Sanfilippo R, et al.Carotid artery wall thickness and leukoaraiosis: preliminary results using multidetector row CT angiography.
AJNR Am J Neuroradiol2011;32:955– 61
23. Saba L, Sanfilippo R, Anzidei M, et al.Stenosis Asymmetry Index (SAI) be-tween symptomatic and asymptomatic patients in the analysis of carotid ar-teries. A study using CT angiography.Eur J Radiol2012;81:77– 82
24. Saba L, Sanfilippo R, Montisci R, et al.Carotid artery wall thickness using CT: inter- and intraobserver agreement analysis.AJNR Am J Neuroradiol2012 March 1 [Epub ahead of print]
25. Fure B, Wyller TB, Thommessen B.TOAST criteria applied in acute ischemic stroke.Acta Neurol Scand2005;112:254 –58
26. Saba L, Mallarini G.Carotid plaque enhancement and symptom correlations: an evaluation by using multidetector row CT angiography.AJNR Am J Neu-roradiol2011;32:1919 –25
27. Roob G, Schmidt R, Kapeller P, et al.MRI evidence of past cerebral microb-leeds in a healthy elderly population.Neurology1999;52:991–94
28. Kinoshita T, Okudera T, Tamura H, et al.Assessment of lacunar hemorrhage associated with hypertensive stroke by echo-planar gradient-echo T2*-weighted MRI.Stroke2000;31:1646 –50
29. Alemany M, Stenborg A, Terent A, et al.Coexistence of microhemorrhages and acute spontaneous brain hemorrhage: correlation with signs of microangi-opathy and clinical data.Radiology2006;238:240 – 47
30. Vernooij MW, Ikram MA, Wielopolski PA, et al.Cerebral microbleeds: accel-erated 3D weighted GRE MR imaging versus conventional 2D T2*-weighted GRE MR imaging for detection.Radiology2008;248:272–77 31. Jeerakathil T, Wolf PA, Beiser A, et al.Cerebral microbleeds: prevalence and
associations with cardiovascular risk factors in the Framingham Study.Stroke
2004;35:1831–35
32. Hachinski V, Iadecola C, Petersen RC, et al.National Institute of Neurological Disorders and Stroke-Canadian Stroke Network Vascular Cognitive Impair-ment Harmonization Standards.Stroke2006;37:2220 – 41
33. Staals J, van Oostenbrugge RJ, Knottnerus IL, et al.Brain microbleeds relate to higher ambulatory blood pressure levels in first-ever lacunar stroke patients.
Stroke2009;40:3264 – 68
34. Lee SH, Bae HJ, Yoon BW, et al.Low concentration of serum total cholesterol is associated with multifocal signal loss lesions on gradient-echo magnetic resonance imaging: analysis of risk factors for multifocal signal loss lesions.
Stroke2002;33:2845– 49
35. Saba L, Mallarini G.MDCTA of carotid plaque degree of stenosis: evaluation of interobserver agreement.AJR Am J Roentgenol2008;190:W41– 46
36. Landis JR, Koch GG.The measurement of observer agreement for categorical data.Biometrics1977;33:159 –74
37. Vernooij MW, van der Lugt LA, Ikram MA, et al.Prevalence and risk factors of cerebral microbleeds: the Rotterdam Scan Study.Neurology2008;70:1208 –14 38. Pantoni L.Cerebral small vessel disease: from pathogenesis and clinical
char-acteristics to therapeutic challenges.Lancet Neurol2010;9:689 –701 39. Cordonnier C, Al-Shahi SR, Wardlaw J.Spontaneous brain microbleeds:
sys-tematic review, subgroup analyses and standards for study design and report-ing.Brain2007;130:1988 –2003
40. Poels MM, Ikram MA, van der Lugt A, et al.Incidence of cerebral microbleeds in the general population: the Rotterdam Scan Study.Stroke2011;42:656 – 61 41. Ovbiagele B, Saver JL, Sanossian N, et al.Predictors of cerebral microbleeds in
acute ischemic stroke and TIA patients.Cerebrovasc Dis2006;22:378 – 83 42. Gregoire SM, Chaudhary UJ, Brown MM, et al.The Microbleed Anatomical
Rating Scale (MARS): reliability of a tool to map brain microbleeds.Neurology