http://www.scirp.org/journal/gep ISSN Online: 2327-4344
ISSN Print: 2327-4336
DOI: 10.4236/gep.2017.513005 Dec. 29, 2017 70 Journal of Geoscience and Environment Protection
Modelling Freshwater Availability Using SWAT
Model at a Catchment-Scale in Ivory Coast
Kouao Armand Anoh
1*, Tanoh Jean Jacques Koua
1, Sampah Georges Eblin
1,
Kan Jean Kouamé
2, Jean Patrice Jourda
21Environment Department, Jean Lorougnon Guede University, Daloa, Ivory Coast
2Hydrogeology Department, Felix Houphouët-Boigny University of Abidjan, Abidjan, Ivory Coast
Abstract
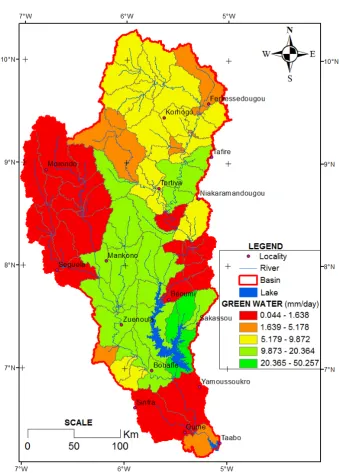
Sustainable management of Ivory Coast’s freshwater reserve at a catchment scale is an essential way in the policies of land use sustainable management. Thus, the implementation of physical conceptual semi-distributed SWAT model required a good knowledge of the watershed and a large number of physic-chemical data available that have been prior adapted to Ivory Coast’s climatic and soil condi-tions. The whole simulation span was divided into calibration set (1982-1986) and validation set (1987-1990). The SUFI-2 algorithm was used for parameters op-timization. The sensitivity analysis focused on 8 parameters related to runoff, soil, evaporation, main channel and groundwater. The performance criteria were based on the P-factor, R-factor and the two objective functions which are Nash-Sutcliffe coefficient and the coefficient of determination. Although Taabo river basin like African basins suffers from a significant lack of data, the objective functions showed the robustness of the model to climate variability. The calibration launched during a wet period gave objective functions higher than 0.7 while validation performed in less humid period gave performance criteria around 0.6. During the simulation period, Taabo river basin daily green water ranged from 0.044 to 50.257 mm/day with a total average of 3,090.9 mm per year. As for blue water, it is ranged from 0.032 to 0.552 mm/day with an annual total average of 29.19 mm.
Keywords
SWAT, SUFI2, Taabo River Basin, Blue Water; Green Water
1. Introduction
Highly in great demand by all and sometimes at very large scale, freshwater or How to cite this paper: Anoh, K.A., Koua,
T.J.J., Eblin, S.G., Kouamé, K.J. and Jourda, J.P. (2017) Modelling Freshwater Availabil-ity Using SWAT Model at a Catchment-Scale in Ivory Coast. Journal of Geoscience and Environment Protection, 5, 70-83. https://doi.org/10.4236/gep.2017.513005
Received: November 16, 2017 Accepted: December 26, 2017 Published: December 29, 2017
Copyright © 2017 by authors and Scientific Research Publishing Inc. This work is licensed under the Creative Commons Attribution-NonCommercial International License (CC BY-NC 4.0). http://creativecommons.org/licenses/by-nc/4.0/
DOI: 10.4236/gep.2017.513005 72 Journal of Geoscience and Environment Protection The SUFI-2 algorithm was chosen in this study because it proved its efficiency in the sensitivity/uncertainty analysis and calibration/validation of large watersheds demanding in terms of calculations. According to [16] and [22], it is capable of analyzing a large number of parameters and measured data from many gauging stations simultaneously. Thus, it is the most widely used algorithm in most hydrol-ogy studies because it requires a smallest number of model runs to obtain satis-factory results.
2. Materials and Methods
2.1. Study Area
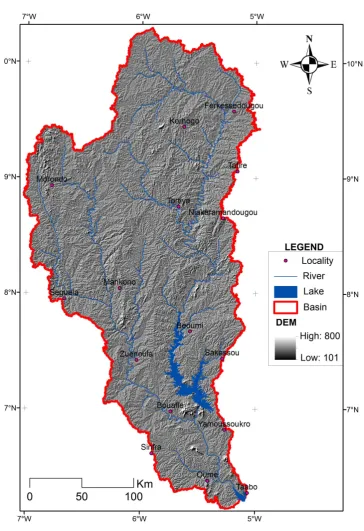
Knowledge of the water availability problematic in the watershed requires know-ledge of all phenomena and processes involved in its configuration. Thus, the Taabo watershed used as test zone in this paper is situated in Ivory Coast precisely be-tween longitudes 4˚59' and 7˚10' east and latitude 6˚07' and 10˚33' north. It cov-ers an area of 59,506.66 km2, in which 2975.33 Km2 (either 0.05%) is located in
Mali (neighboring country). Taabo river basin benefits an important river sys-tem of which two artificial lakes that are Kossou and Taabo (Figure 1).
Indeed, created in 1971, Kossou Lake with a length of 150 km and an area of 1855 km2, is the largest lake in the basin. Its volume is estimated at full at 28.8 ×
109 m3. As for Lake Taabo established in 1975, is located at 120 km downstream
of Kossou Lake. Its lake covers an area of 69 km2 and stocks a volume of 630 ×
106 m3 of water [23]. At the relief level, although having high altitude by location,
Taabo watershed relief is mostly flat. The contributions transiting in the river ba-sin come from tributaries of soil leaching, falling dead leaves and rejects of hu-mans, animals and insects feces. The forte presence of human combined with its activities at the catchment surface has diverse repercussions both on water health, and socio-economical activities [24] [25] [26]. Among the water health consequences, one can non-exhaustively enumerate, sedimentation, acidification, pollution by heavy metals and eutrophication.
2.2. SWAT Simulator Description
DOI: 10.4236/gep.2017.513005 73 Journal of Geoscience and Environment Protection
Figure 1. Study area.
DOI: 10.4236/gep.2017.513005 74 Journal of Geoscience and Environment Protection [31]; France (302 km2) by [7] and (385 km2) by [8]; Quebec (630 km2) by [32];
Switzerland (1700 km2) by [33]; New Zealand (2180 km2) by [34]; United States
(4550 km2) by [35]; Mali (100,120 km2) by [36] and [37]; Senegal watershed
(400,000 km2), Volta watershed (400,000 km2), Niger watershed (2.2 million km2)
by [11] and throughout Africa by [15].
2.3. SWAT Model Functioning
In its setting up, SWAT subdivides the hydrological modeling of the basin into two phases [17]. In the first phase, which is the land phase of the hydrologic cycle, the model manages the amount of water, sediment loads, nutrients and pesticide flow-ing into the main channel of each subbasin. The second phase concerns the wa-ter transport, i.e. the movement of water, sediment, nutrients and other pollutants through the river network to the basin outlet. Depending on the number of HRU (Hydrologic Responses Unit), which is the basic unit of calculation, SWAT is able to reproduce in a few minutes or a few hours, several years of farming practices and hydrological functioning. Its hydrological structure reproduces water balance in a simplified manner through several interconnected modules via specific al-gorithms [38].
To simulate the availability of Taabo catchment water resources, the ArcSWAT 2009 related to ArcGIS 10.0 software was used. The ability of SWAT model to reflect the reality of the land is largely dependent on the accuracy and reliability of the input variables values of the model that will be incorporated. For its oper-ation a database, which in most cases was freely obtained were used. Thus, Digi-tal elevation model (DEM) used in this study was obtained by the mosaic of Shut-tle Radar Topography Mission (SRTM) 35_10, 35_11 and 36_11 images at the res-olution of 90 m.
DOI: 10.4236/gep.2017.513005 75 Journal of Geoscience and Environment Protection and the two other years (1982-1986 and 1987-1990), respectively used for the model calibration and validation. Model calibration determines the best, or at least a reasonable parameter set while validation ensures that the calibration parameter set performs reasonably well under an independent data set [39].
2.4. SUFI-2 Algorithm
The SUFI-2 algorithm (Sequential Uncertainty Fitting) of SWAT-CUP software [20] is a program which enables sensitivity analysis, uncertainty analysis, cali-bration and validation of SWAT model. SWAT model should undergo sensitivi-ty analysis which consists of identifying most sensitive parameters to be tested in the model. The choice of these parameters was based in part on the literature (such as studies performed by [11] [15] [37] [40] [41] and on the other hand, the combination of Latin-hypercube and one-factor-at-a-time sampling strategy [42]. The uncertainty of input parameters in SUFI-2 is described as a uniform distri-bution, while model output uncertainty is quantified at the 95% prediction of un-certainty (95PPU) [43]. The 95PPU is calculated at the 2.5% and 97.5% levels of the cumulative distribution of an output variable obtained through Latin hyper-cube sampling, disallowing 5% of the very bad simulations [20]. The degree to which all uncertainties are accounted for is quantified by a measure referred to as the P-factor, which is the percentage of measured data bracketed by the 95% predic-tion uncertainty (95PPU) [11] [44]. The goodness of calibration/validation and uncertainty prediction is judged on the basis of closeness of the P-factor to 100% and also by small uncertainty band depicted by R-factor. This R-factor which quan-tifies the strength of a calibration/uncertainty analysis is the average thickness of the 95PPU band divided by the standard deviation of the measured data. Simi-larly, to these criteria, the algorithm offers several objective functions. Among these multiple objective functions, the Nash-Sutcliffe coefficient (NS) and the coeffi-cient of determination R2 were chosen because they provide a more accurate
as-sessment of the model effectiveness in terms of the water flow and the absolute deviations [45]. The NS coefficient can vary from -∞ (for a very poor fit) to 1 (which represents a strong link between the observed and simulated values). A NS below 0 indicates that the mean value of the variable should be the best pre-diction of the model result [15]. The R2 is ranged from 0 to 1 for a perfect model
[39]. A value greater than 0.5 reflects a good concordance between observed and simulated data [46].
3. Results and Discussion
3.1. Sensitivity Analysis
DOI: 10.4236/gep.2017.513005 76 Journal of Geoscience and Environment Protection
Table 1. Initial and final ranges of SWAT model parameters used in calibration.
Stream flow parameters Definition Initial range Final range
r_CN2.mgt SCS runoff curve number for moisture condition II −0.60 - 0.20 −0.37 - 0.11 r_SOL_AWC.sol Available water capacity of the soil layer −0.20 - 0.60 −0.33 - 0.29
v_ALPHA_BF.gw Base flow alpha factor 0.00 - 1.00 0.17 - 0.73
v_GWQMN.gw Threshold contribution of the shallow aquifer of channel flow 100.00 - 3000.00 944.77 - 2677.23 v_GW_DELAY.gw Groundwater delay time (days) 10.00 - 450.00 221.91 - 651.69
v_CH_K2.rte Effective hydraulic conductivity in the main channel 15.00 - 250.00 48.28 - 183.82
v_CH_N2.rte Manning roughness for main channel 0.00 - 0.30 0.14 - 0.44
v_ESCO.hru Soil evaporation compensation factor 0.00 - 1.00 0.02 - 0.68 With v_: parameter value is replaced by given value or absolute change; r: parameter value is multiplied by (1 + a given value) or relative change [20].
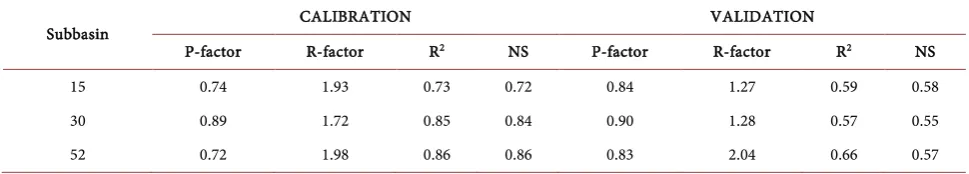
Table 2. Taabo SWAT model statistical analysis.
Subbasin CALIBRATION VALIDATION
P-factor R-factor R2 NS P-factor R-factor R2 NS
15 0.74 1.93 0.73 0.72 0.84 1.27 0.59 0.58
30 0.89 1.72 0.85 0.84 0.90 1.28 0.57 0.55
52 0.72 1.98 0.86 0.86 0.83 2.04 0.66 0.57
area, only 8 parameters relative to runoff (CN2), soil (SOL_AWC), groundwater (ALPHA_BF, GWQMN and GW_DELAY), main channel (CH_K2 and CH_N2) and evapotranspiration (ESCO) are judged to be sensitive to Taabo sensitivity analysis.
3.2. Calibration and Validation
The results of statistical analysis give good values for coefficient of determina-tion and Nash Sutcliff efficiency and performance criteria as well practically both for calibration and validation (Table 2).
Following stopping criteria of SUFI-2 model (P-factor and R-factor), the ob-servation data are very good because in general, more than 80% are framed by the 95PPU. Besides, all the simulated meet the performance criteria established
by [46] [39] [29] [47] and [48]. The Taabo SWAT model showed its robustness
[image:7.595.55.540.297.384.2]DOI: 10.4236/gep.2017.513005 77 Journal of Geoscience and Environment Protection
Figure 2. Measured and simulated daily outflow (left calibration period 1982-1986 and right validation period 1987-1990).
3.3. Assessment of Water Reserves
3.3.1. Green Water
DOI: 10.4236/gep.2017.513005 78 Journal of Geoscience and Environment Protection
Figure 3. Evolution of different components of green water in Taabo catchment from 1982
to 1986.
3.3.2. Blue Water
DOI: 10.4236/gep.2017.513005 79 Journal of Geoscience and Environment Protection
Figure 4. Evolution of different components of blue water in Taabo catchment from 1982
to 1986.
4. Conclusion
qual-DOI: 10.4236/gep.2017.513005 80 Journal of Geoscience and Environment Protection ity of observation data, the model did not well represent the validation period. In the Taabo river basin, the green water is higher than the blue water. This study explains why the surface waters of the river basin are much used for drinking water of population near to the stream.
Acknowledgements
The authors wish to thank the Swiss Confederation that enabled the completion of this study through the granting a scholarship.
References
[1] Aké, G. (2010) Impacts de la variabilité climatique et des pressions anthropiques sur les ressources hydriques de la région de Bonoua (Sud-Est de la Côte d’Ivoire). PhD Thesis, Felix Houphouët-Boigny University of Abidjan, Abidjan.
[2] Andréassian, V. (2002) Impact de l’évolution du couvert forestier sur le comporte-ment hydrologique des bassins versants. Paris, 6.
[3] Ardoin-Bardin, S. (2004) Variabilité hydroclimatique et impacts sur les ressources en eau de grands bassins hydrographiques en zone soudano-sahélienne. Université Montpellier II-Sciences et Techniques du Languedoc.
[4] Varado, N. (2004) Contribution au developpement d’une modelisation hydrologi-que distribuee. Application au bassin versant de la donga, au benin. Doctor Thesis, Institut national polytechnique de Grenoble, France.
[5] Lay, M.L. and Galle, S. (2005) Variabilités interannuelle et intra-saisonnière des pluies aux échelles hydrologiques. La moussonOuest-africaineenclimatsoudanien. [Seasonal Cycle and Interannual Variability of Rainfall at Hydrological Scales. The West African Monsoon in a Sudanese Climate.] Hydrological Sciences Journal, 50, 509-524.
[6] Lévesque, É. (2007) Evaluation de la performance hydrologique du modèle SWAT pour de petits bassins versants agricoles du Québec. Master Thesis, Université Lav-al, Quebec City.
[7] Renaud, J. (2004) Mise en place du modèle agri-environnemental SWAT sur le bas-sin versant du Mercube (Haute-Savoie): Vers une modélisation des transferts de phosphore. [Rapport de Master SIG.] Université Jean Monnet, Saint-Etienne. [8] Laurent, F., Ruelland, D. and Chapdelaine, M. (2007) Simulation de l’effet de
changements de pratiques agricoles sur la qualité des eaux avec le modèle SWAT.
Journal of Water Science, 20, 395-408. https://doi.org/10.7202/016913ar
[9] Rollo, N. (2007) Evaluation des risques de pollution diffuse al’echelle d’un sous bas-sin versant: Interet d’une approche par modelisation spatiale avec swat. L’exemple de la section amont du loc’h. Cnrs-Avignon, Université de Nantes, France, 8. [10] Neitsch, S.L., Arnold, J.G., Kiniry, J.R., Srinivasan, R. and Williams, J.R. (2002) Soil
and Water Assessment Tool User’s Manual Version 2000. Grassland Soil and Water Research Laboratory Agricultural Research Service, 202, 472.
[11] Schuol, J., Abbaspour, K.C., Srinivasan, R. and Yang, H. (2008) Estimation of Freshwater Availability in the West African Sub-Continent Using the SWAT Hy-drologic Model. Journal of Hydrology, 352, 30-49.
https://doi.org/10.1016/j.jhydrol.2007.12.025
DOI: 10.4236/gep.2017.513005 81 Journal of Geoscience and Environment Protection
[13] Neitsch, S.L., Arnold, J.G., Kiniry, J.R. and Williams, J.R. (2011) Soil and Water As-sessment Tool Theoretical Documentation Version 2009. Texas Water Resources Institute,College Station, 618.
[14] Arnold, J.G., Kiniry, J.R., Srinivasan, R., Williams, J.R., Haney, E.B. and Neitsch, S.L. (2013) SWAT 2012 Input/Output Documentation. Texas Water Resources In-stitute, College Station.
[15] Schuol, J., Abbaspour, K.C., Yang, H., Srinivasan, R. and Zehnder, A.J. (2008) Mod-eling Blue and Green Water Availability in Africa. Water Resources Research, 44, 1-18. https://doi.org/10.1029/2007WR006609
[16] Faramarzi, M., Abbaspour, K.C., Schulin, R. and Yang, H. (2009) Modelling Blue and Green Water Resources Availability in Iran. Hydrological Processes, 23, 486-501.
https://doi.org/10.1002/hyp.7160
[17] Neitsch, S., Arnold, J., Kiniry, J., Williams, J. and King, K. (2005) Soil and Water Assessment Tool Theoretical Documentation. Grassland. Soil and Water Research Laboratory, Agricultural Research Service, Blackland Research Center, Texas Agri-cultural Experiment Station, 476.
[18] Gerten, D., Hoff, H., Bondeau, A., Lucht, W., Smith, P. and Zaehle, S. (2005) Con-temporary “Green” Water Flows: Simulations with a Dynamic Global Vegetation and Water Balance Model. Physics and Chemistry of the Earth, Parts A/B/C, 30, 334-338. https://doi.org/10.1016/j.pce.2005.06.002
[19] Falkenmark, M. and Rockström, J. (2006) The New Blue and Green Water Para-digm: Breaking New Ground for Water Resources Planning and Management.
Journal of Water Resources, 2006, 132.
[20] Abbaspour, K.C. (2007) User Manual for SWAT-CUP, SWAT Calibration and Un-certainty Analysis Programs. Swiss Federal Institute of Aquatic Science and Tech-nology, Eawag, Duebendorf, Switzerland.
[21] Rouholahnejad, E., Abbaspour, K.C., Vejdani, M., Srinivasan, R., Schulin, R. and Lehmann, A. (2012) A Parallelization Framework for Calibration of Hydrological Models. Environmental Modelling & Software, 31, 28-36.
https://doi.org/10.1016/j.envsoft.2011.12.001
[22] Yang, J., Reichert, P., Abbaspour, K., Xia, J. and Yang, H. (2008) Comparing Un-certainty Analysis Techniques for a SWAT Application to the Chaohe Basin in China. Journal of Hydrology, 358, 1-23.
https://doi.org/10.1016/j.jhydrol.2008.05.012
[23] Kaiser, E. and Constructors, I.-U. (1980) Aménagement hydroélectrique de Taabo. Rapport final de l’aménagement, 263.
[24] Bunea, F., Ciocan, G.D., Oprina, G., Băran, G. and Băbuţanu, C.A. (2010) Hydro-power Impact on Water Quality. Environmental Engineering & Management Jour-nal, 9, 1459-1464.
[25] Török, Z., Ozunu, A. and Cordoş, E. (2011) Chemical Risk Analysis for Land-Use Planning. I. Storage and Handling of Flammable Materials. Environmental Engi-neering & Management Journal, 10, 81-88.
[26] Weidema, B.P. and Lindeijer, E. (2001) Physical Impacts of Land Use in Product Life Cycle Assessment. Department of Manufacturing Engineering and Manage-ment, Technical University of Denmark, 1-52.
[27] Arnold, J.G. and Fohrer, N. (2005) SWAT2000: Current Capabilities and Research Opportunities in Applied Watershed Modelling. Hydrological Processes, 19, 563-572.
DOI: 10.4236/gep.2017.513005 82 Journal of Geoscience and Environment Protection
[28] Lacroix, A., Laurent, F., Ruelland, D. and Sauboua, E. (2006) Nitrate Pollution Risk Assessment: From the Model to the Indicator. International Journal of Agricultural Resources, Governance and Ecology, 5, 206-223.
https://doi.org/10.1504/IJARGE.2006.009164
[29] Gassman, P.W., Reyes, M.R., Green, C.H. and Arnold, J.G. (2007) The Soil and Water Assessment Tool: Historical Development, Applications, and Future Re-search Directions. Transactions of the ASABE, 50, 1211-1250.
https://doi.org/10.13031/2013.23637
[30] Deslandes, J., Michaud, A. and Bonn, F. (2002) Développement et validation d’indicateurs agroenvironnementaux associés aux pertes diffuses de phosphore dans le bassin-versant de la rivière aux Brochets. Agrosol, 13, 111-123.
[31] Chaponniere, A. (2005) Fonctionnement Hydrologique d’un Bassin Versant Montag-neux Semi-Aride: Cas du bassin versant du Rehraya (Haut Atlas Marocain). PhD, In-stitut National Agronomique, Paris.
[32] Beaudin, I., Deslandes, J., Michaud, A.R., Bonn, F. and Madramootoo, C.A. (2006) Variabilité spatio-temporelle des exportations de sédiments et de phosphore dans le bassin versant de la Rivière aux Brochets au sud-ouest du Québec. Agro-Solution, 17, 1-38.
[33] Abbaspour, K.C., Yang, J., Maximov, I., Siber, R., Bogner, K., Mieleitner, J., et al. (2007) Modelling Hydrology and Water Quality in the Pre-Alpine/Alpine Thur Watershed using SWAT. Journal of Hydrology, 333, 413-430.
https://doi.org/10.1016/j.jhydrol.2006.09.014
[34] Cao, W., Bowden, W.B., Davie, T. and Fenemor, A. (2009) Modelling Impacts of Land Cover Change on Critical Water Resources in the Motueka River Catchment, New Zealand. Water Resources Management, 23, 137-151.
https://doi.org/10.1007/s11269-008-9268-2
[35] Tong, S.T. and Naramngam, S. (2007) Modeling the Impacts of Farming Practices on Water Quality in the Little Miami River Basin. Environmental Management, 39, 853-866.https://doi.org/10.1007/s00267-006-0307-6
[36] Thiébault, M. (2010) Modélisation hydrologique d’un scénario de changement cli-matique sur le bassin versant du Bani avec SWAT [Mémoire d’ingénieur]: ENGEES, France.
[37] Laurent, F. and Ruelland, D. (2010) Modélisation à base physique de la variabilité hydroclimatique à l’échelle d’un grand bassin versant tropical. In: Servat, E., et al., Eds., Global Change: Facing Risks and Threats to Water Resources, International Association of Hydrological Sciences, 474-484.
[38] Rollo, N. (2012) Modélisation des dynamiques de pollution diffuse dans le bassin versant de la rivière d’Auray: quantification, caractérisation et gestion des apports nutritifs terrigènes. Thèse de Doctorat, Université de Nantes.
[39] Tolson, B.A. and Shoemaker, C.A. (2004) Watershed Modeling of the Cannonsville Basin using SWAT2000: Model Development, Calibration and Validation for the Prediction of Flow, Sediment and Phosphorus Transport to the Cannonsville Re-servoir. Cornell Library Technical Reports and Papers, 159.
[40] Anoh, K.A. (2014) Apport d’un SIG et du modèle agro-hydrologique SWAT dans la gestion durable des ressources en eau du bassin versant du lac de Taabo (Centre de la Côte d’Ivoire). PhD, Félix Houphouët Boigny, Côte d’Ivoire.
DOI: 10.4236/gep.2017.513005 83 Journal of Geoscience and Environment Protection Management, 1-11.
[42] Van Griensven, A. and Meixner, T. (2006) Methods to Quantify and Identify the Sources of Uncertainty for River Basin Water Quality Models. Water Science and Technology, 53, 51-59.https://doi.org/10.2166/wst.2006.007
[43] Hosseini, M., Amin, M., Ghafouri, A. and Tabatabaei, M. (2011) Application of Soil and Water Assessment Tools Model for Runoff Estimation. American Journal of Applied Sciences,8, 486-494.https://doi.org/10.3844/ajassp.2011.486.494
[44] Singh, V., Bankar, N., Salunkhe, S.S., Bera, A.K. and Sharma, J. (2013) Hydrological Stream Flow Modelling on Tungabhadra Catchment: Parameterization and Uncer-tainty Analysis using SWAT CUP. Current Science, 104, 1187-1199.
[45] Bioteau, T., Bordenave, P., Laurent, F. and Ruelland, D. (2002) Evaluation des ris-ques de pollution agricole à l’échelle de bassins versants: Intérêts d’une approche par modélisation hydrologique avec SWAT. Ingénieries-EAT, 32, 3-13.
[46] Santhi, C., Arnold, J.G., Williams, J.R., Dugas, W.A., Srinivasan, R. and Hauck, L.M. (2001) Validation of the Swat Model on a Large Rwer Basin with Point and Non-point Sources. JAWRA Journal of the American Water Resources Association, 37, 1169-1188.https://doi.org/10.1111/j.1752-1688.2001.tb03630.x
[47] Obuobie, E. (2008) Estimation of Groundwater Recharge in the Context of Future Climate Change in the White Volta River Basin. Ecology Series, 153.
[48] Abbaspour, K. (2013) User Manual for SWAT-CUP: SWAT Calibration and Un-certainty Analysis Programs. Eawag: Swiss Federal Institute of Aquatic Science and Technology, Duebendorf, 103.