Executable Enterprise Architecture
Models: Enabling Business
Analytics using the Monte Carlo
Method
Roland Smook
School of Management and Governance
University of Twente
This dissertation is submitted for the degree of
Master’s of Industrial Engineering and Management
Roland Smook
Student Number: s1362275
e-mail: [email protected]
Degree: Master of Science in Industrial Engineering and Management Specialization: Information Technology and Management
Faculty: Management and Governance University of Twente
Enschede
The Netherlands
Examination Committee
1st Supervisor: Dr. Maria E. Iacob
e-mail: [email protected]
Department: Industrial Engineering and Business Information Systems Faculty: Management and Governance
University: University of Twente
2nd Supervisor: Ir. Henk Kroon
e-mail: [email protected] Department: Business Administration Faculty: Management and Governance University: University of Twente
External Supervisor: Dick Quartel
e-mail: [email protected] Department: R&D
To my parents, for all they have sacrificed without hesitation. For all their love and support
Acknowledgements
My supervisors, for all their guidance and insights. My aunt Sieglinde, for selflessly opening her home to me.
Abstract
Enterprise architectures (EA) are particularly useful at showing the various structural elements within an enterprises, and the complex net of connections between them. In support of them numerous frameworks exist which aid companies in designing, devel-oping and managing EAs as well as the host of activities and standards present in those EA frameworks. However, EAs also have one stark shortcoming, namely their static nature prevents them from being used to predict the resultant dynamic behaviour of particular EA design choices. A limited umber of executable EA metamodels and approaches do exist however. In other words, models depicting all of the original el-ements of an EA model, but which are enriched with all the necessary properties for them to be used for simulation purposes.
Specifically focusing on business analytics, the research goal therefore is to deter-mine and demonstrate how enterprise architectures can be used as the foundation for business analytics.
In light of this an artefact was developed which allows business analytics, which are based on the Monte Carlo method, to be executed, using EA models as their base. To achieve this the Design Science Research Methodology was followed. Chapter 2 and 3 provide a literature study, setting the context within the EA and BA realms, motivating and identifying the exact problem the artefact had to answer.
Chapter 4 then defines the objectives of the artefact, which are to provide a method and means (implemented prototype) by which to execute Monte Carlo simulations within the EA modelling application Architect. Particular emphasis is given to user-friendly design which can be used generically with a host of different BAs.
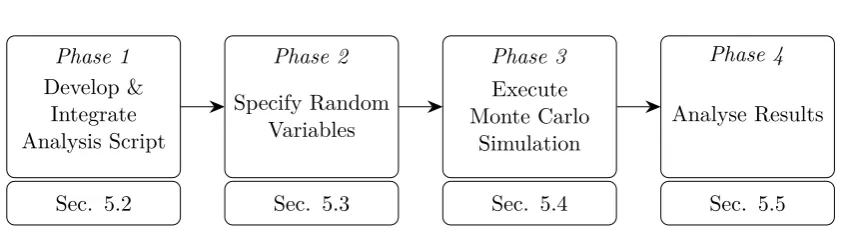
Chapter 5 details the developed artefact, explaining how it is used by first integrat-ing it with a users already existintegrat-ing analysis script, then specifyintegrat-ing all random variables on the model by means of EA profiles. The third step considers the actual execution of the Monte Carlo simulation, before finally using various descriptive statistics and visual analyses to evaluate the results.
second considers the availability of an ATM service.
The evaluation of the artefact by means of three interviews is discussed in chapter 7. It was found that although there could be use for such an artefact, the entry-requirements are rather high as the user would have to have both the necessary know-how on know-how to use it, know-how to script his own analyses, know the Monte Carlo method, and lastly have the necessary information at hand to specify the random variables.
Contents
Contents xi
List of Figures xv
List of Tables xvii
Nomenclature xix
1 Introduction 1
1.1 Context & Motivation . . . 1
1.2 Research Goal and Objectives . . . 2
1.3 Research Methodology . . . 3
1.4 Scope & Assumptions . . . 5
1.5 Document Overview . . . 6
2 Enterprise Architecture Analysis 9 2.1 Introduction . . . 9
2.2 Enterprise Architecture Fundamentals . . . 10
2.2.1 Purpose . . . 10
2.2.2 EA Today . . . 10
2.2.3 Beyond Static Models . . . 11
2.3 EA Analysis . . . 12
2.3.1 Classification Schemes . . . 12
2.3.2 Analytics Activities . . . 16
2.3.3 Relationships & Activity Types . . . 19
2.4 Executable Enterprise Architecture Models . . . 20
2.4.1 Definition . . . 20
2.5 Archimate . . . 22
2.6 Conclusion to EA Analysis . . . 22
3 Business Analytics 25 3.1 Introduction . . . 25
3.2 Fundamentals . . . 26
3.2.1 Analytics Competitors . . . 28
3.2.2 Synergy between EA and BA . . . 29
3.3 The Monte Carlo Method . . . 30
3.3.1 Stochastic Models . . . 30
3.3.2 Overview of Method . . . 30
3.3.3 Histogram & Descriptive Statistics . . . 31
3.3.4 Histogram . . . 32
3.4 Conclusion to Business Analytics . . . 33
4 Executable EA Models & the Monte Carlo Method 35 4.1 Introduction . . . 35
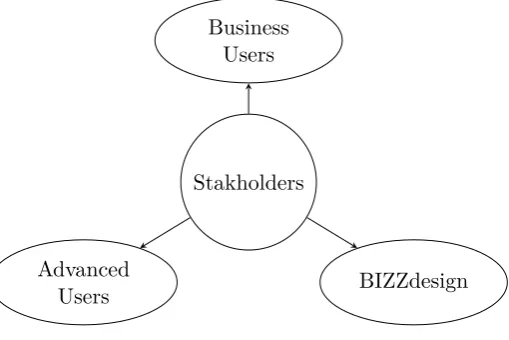
4.2 Stakeholders . . . 35
4.3 Stakeholder objectives . . . 36
4.3.1 BIZZdesign . . . 37
4.3.2 Advanced & Business Users . . . 38
4.4 Stakeholder Requirements . . . 38
4.5 Conclusion . . . 39
5 The Artefact 41 5.1 Introduction . . . 41
5.1.1 Satisfying Requirements . . . 41
5.1.2 Modelling . . . 42
5.1.3 Assumptions & Limitations . . . 42
5.2 Develop & Integrate Analysis Script . . . 43
5.2.1 Tagging Input Data . . . 43
5.2.2 Indicating a ’Stop Event’ . . . 44
5.2.3 Tagging Variables . . . 45
5.2.4 Advanced . . . 46
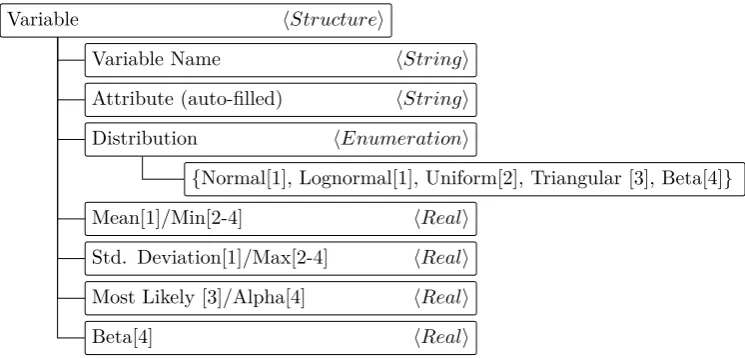
5.3 Specifying Random Variables . . . 47
Contents
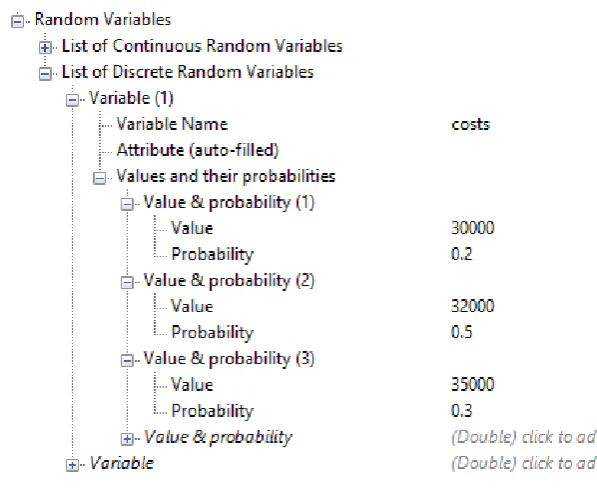
5.3.2 Discrete Random Variables . . . 49
5.4 Run Monte Carlo Simulation . . . 51
5.4.1 Overview . . . 51
5.4.2 Simulation Loop . . . 52
5.5 Analyse Results . . . 59
5.5.1 Histogram . . . 59
5.5.2 Other Graphs . . . 60
5.5.3 Export results . . . 60
5.6 Conclusion . . . 64
6 Artefact Demonstration 65 6.1 Introduction . . . 65
6.2 Illustrative Case 1: Multi-period Financial Performance . . . 66
6.2.1 Case description . . . 66
6.2.2 Implementation . . . 70
6.2.3 Results Analysis . . . 71
6.3 Illustrative Case 2: Service Availability . . . 74
6.3.1 Case description . . . 74
6.3.2 Implementation . . . 75
6.3.3 Results analysis . . . 77
6.4 Conclusion . . . 78
7 Evaluation 81 7.1 Introduction . . . 81
7.2 Method . . . 81
7.2.1 Evaluation Criteria . . . 81
7.2.2 Interviews . . . 83
7.3 Results . . . 84
7.3.1 Understandability & Effectiveness . . . 84
7.3.2 Ease of use, Simplicity, Elegance & Operationality . . . 84
7.3.3 Fidelity with Real World Phenomena & Generality . . . 85
7.4 Conclusion . . . 85
8 Conclusion 87 8.1 Introduction . . . 87
8.2.1 Research Question 1 . . . 87
8.2.2 Research Question 2 . . . 88
8.2.3 Research Question 3 . . . 89
8.2.4 Research Question 4 . . . 89
8.2.5 Research Objective . . . 89
8.3 Contributions . . . 90
8.3.1 Theoretical . . . 90
8.3.2 Practice . . . 90
8.4 Limitations . . . 90
8.5 Recommendations . . . 91
8.5.1 Theoretical . . . 91
8.5.2 Artefact . . . 92
References 95 Appendix A Code 99 A.1 Monte Carlo Script File . . . 99
A.2 Additions to User’s Script . . . 111
A.3 Histogram . . . 112
A.4 Retrieve variable’s simulation outcomes . . . 118
A.5 NPV Analysis . . . 120
A.6 Profile Definition (MonteCarlo.mpd) . . . 129
A.7 Translation file (MonteCarlo.mps) . . . 129
Appendix B Interview Questions 131 Appendix C Interview Minutes 133 C.1 Interview 1 . . . 133
C.2 Interview 2 . . . 134
List of Figures
1.1 Design Science Research Method by Peffers et al. (2007) . . . 4
1.2 Document Overview . . . 7
2.1 Analysis Dimensions (Jonkers et al., 2013) . . . 13
2.2 Analysis and synthesis of EA with modelling Wan and Carlsson (2012). 17 2.3 The interrelationship of analysis activities according to Wan and Carls-son (2012). . . 20
2.4 ArchiMate metamodel as in Iacob and Jonkers (2006) . . . 23
3.1 Nature of Decision Models according to Evans (2013) . . . 27
4.1 Artefact Stakeholders . . . 36
5.1 Executing the Analysis Method . . . 42
5.2 Specifying a Random Variable Example . . . 48
5.3 Random Variables Profile Attributes . . . 48
5.4 Example use of theRandom Variables profile . . . 49
5.5 Random Variables Profile . . . 50
5.6 Executing the Monte Carlo Simulation Action Diagram . . . 53
5.7 Executing the Monte Carlo Simulation Context Level Data Flow Diagram 53 5.8 Executing the Monte Carlo Simulation Level 0 Data Flow Diagram . . 54
5.9 Process 4: Run Simulation Data Flow Diagram . . . 57
5.10 Process 4.2: Generate, Assign & Save Stochastic Variables . . . 58
5.11 Generate Histogram Activity Diagram . . . 61
5.12 Generate Histogram Context Level Data Flow Diagram . . . 62
5.13 Generate Histogram Level 0 Data Flow Diagram . . . 63
6.1 Credit Card Service EA model . . . 68
6.3 Year 5 NPV Descriptive Statistics . . . 72
6.4 NPV Histogram for Year 5 . . . 72
6.5 NPV Probability Chart for Year 5 . . . 72
6.6 Mean NPV per year . . . 73
6.7 Yearly analysis . . . 73
6.8 Mean Yearly Profit/Loss Descriptive Statistics . . . 73
6.9 Mean Break-Even Analysis Statistics . . . 74
6.10 Change in values for Year 5 NPV . . . 74
6.11 ATM fault tree . . . 75
6.12 Cash withdrawal service EA (Buschle et al., 2013). . . 76
6.13 Redundancy relationship . . . 77
List of Tables
2.1 EA Analysis Classification Scheme according to Buckl et al. (2009a) . . 16
3.1 Common Applications of Business Analytics (Davenport, 2006) . . . 27
6.1 Model assumptions for Credit Card Industry Business Case (Paisit-tanand and Olson, 2006). . . 69 6.2 Stochastic Nature of Model Variables for the Credit Card Service
(Paisit-tanand and Olson, 2006). . . 70
Nomenclature
Roman Symbols
x Sample mean
Greek Symbols
ˆ
σ Sample standard deviation
Acronyms / Abbreviations
AD Activity Diagram
BA Business Analytics
DFD Data Flow Diagram
DSRM Design Science Research Methodology
EA Enterprise Architectures
IQR Interquartile Range
Chapter 1
Introduction
1.1
Context & Motivation
Every business needs to be properly managed in order to respond to shifting business environments and changing market demands in a manner that will ensure its own sus-tainability. However, even if the desired business behaviour is identified, the necessary changes required to achieve such behaviour can be difficult to identify. This difficulty can in part be ascribed to the complex behaviour resultant of the host of relationships that exist between the various component parts of a business. The inter-relationships cause complex behaviour to occur wherein it is difficult to distinguish between ef-fect and cause. The enterprise architecture (EA) field has progressively advanced to aid managers in the design, decomposition and communication of enterprise architec-tures, but little has been done as far as developing tools to predict and evaluate the hypothetical behaviour of proposed architectures (Glazner, 2009).
Predicting and evaluating enterprise behaviour can be done in a number of ways. In the case of Glazner (2009) for example, an extensive hybrid simulation model was developed . However, other less involving methods also exists, such as those of business analytics (BA) . With business analytics the objective is to develop a decision model which will result in some measure of performance or behaviour, given certain input variables (Evans, 2013). Although business analytics are not limited to predictive analytics, a very similar argument can be made for their development as extensions to the existing field of enterprise architectures.
or at least an analytics application the business user can work with. When an analytics expert is being used, a lot of to and fro is required between the business user and the analytics expert, until the expert has produced the results usable to the business user. The business user after all, is typically not interested in the hard statistical data for instance, but requires the results in a format which he can use to make decisions. The analytics expert again, needs to decipher the needs of the business user, develop the necessary models and operationalize them. This to and fro takes up time, and is complicated by the complex inter-relationships existing within enterprises domains, which the models need to account for and within which they need to be operationalised. Getting the necessary results can therefore devour a lot of resources, and take longer to accomplish than what the business user has time for when making a decision. (Kohavi et al., 2002)
As discussed though, enterprise architectures already serve to make complex struc-tures and relationships clear. An opportunity therefore exists for organisations who have already invested in an enterprise architecture, as they posses the ideal spring-board from which to develop and operationalize business analysis efforts.
This research project therefore wishes to answer whether, and to what effect, busi-ness analytics can be enriched by developing them as an extension to enterprise archi-tectures. If this question can be answered satisfactorily by means of a demonstrable artefact, the theoretical community and corporate practices will gain new insights into the possible ways through which to develop usable business analytics which take less time to formulate and see results from, as well as being easier to comprehend by business users.
1.2
Research Goal and Objectives
Given the previously described research opportunity, the following research goal is formalised:
Determine and demonstrate how enterprise architectures can be used as the foundation for business analytics.
1.3 Research Methodology
Science Research Methodology discussed in the next section.
1. Can enterprise architecture models be used as the foundation for Monte Carlo simulation based business analytics, and if so what problem would this aim to solve?
(a) What is understood under the term enterprise architecture analytics, and
what is its purpose? Are there any existing standard guidelines or methods specifically designed to develop simulation models of enterprise architec-tures models?
(b) What are business analytics? Is there a synergy between business analytics and enterprise architectures which would encourage and facilitate further investigation into this topic? How are Monte Carlo simulations used for business analytics?
2. Given these findings, what would be the requirements of a technical artefact, designed to enabled Monte Carlo simulations, based on using enterprise archi-tecture models?
3. How could an artefact be developed an implemented to meet these requirements within the enterprise architecture modelling tool, Architect?
4. Does artefact tool fulfil its original purpose, is it user-friendly, and useful within the business realm?
1.3
Research Methodology
A significant part of the project will be dedicated to designing and developing a tech-nical artefact. Each phase of the development of the artefact, from problem definition through to evaluation will be based on theoretical underpinnings. With this in mind the Design Science Research Methodology by Peffers et al. (2007) was identified as a
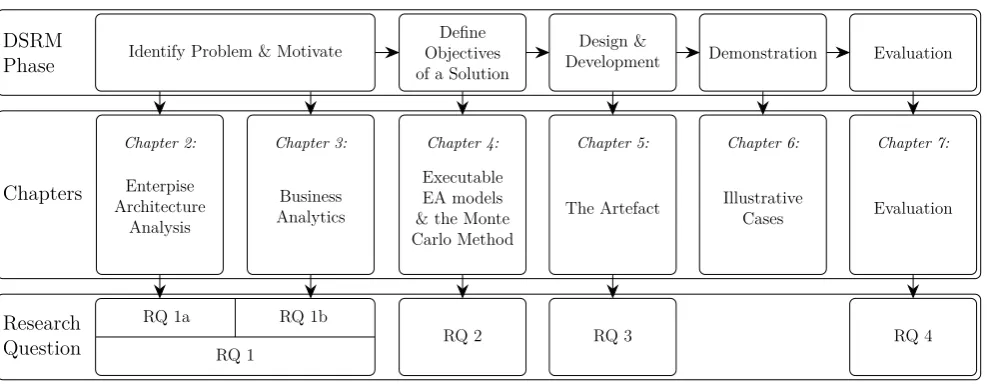
suitable research methodology to guide the execution of this project. An outline of the phases can be seen in Figure 1.1, the execution of the phases are described in more detail next.
Identify Problem and Motivate The first research question serves to provide
Identify Problem & Motivate Define Problem Show Im-portance Define Objectives of a Solution
What would a better artefact acomplish? Design & Development Artefact Demonstration Find suitable context Use artefact to
solve problem Evaluation Observe how effective, efficient Iterate back to design Communication Scholarly publications Professional Publications Process Iteration
Inference Theory Ho
w-to Kno wledge Metrics, Analysis-Kno wledge Disciplinary Kno wledge
Fig. 1.1 Design Science Research Method by Peffers et al. (2007)
From the findings, a specific problem is identified which the artefact should solve. The principles used to solve this problem are also identified in this phase.
Define Objectives of a Solution The general objectives of this research project
have already been identified. In conjunction to these, more specific objectives will be identified for the artefact, which should be fulfilled in order to solve the problem identified in the previous phase. These objectives are based on the needs of the stakeholders, for whom the artefact is developed. Based on these objectives, the required functionality of the artefact is identified. This phase then answers the second research question.
Design and Development The aim of the artefact is to meet the requirements set
out in the previous phase, by following the theoretical principles identified in the first phase. In so doing the third research question is answered.
Demonstration Two illustrative cases are used to demonstrate the artefact, which
are based on examples found in literature of cases in the real world. The objective here is to demonstrate that the artefact accomplishes its original objectives, and fulfils its requirements.
Evaluation The two illustrative cases are demonstrated to three individuals in order
to evaluate the artefact. The objective here is to assess whether the artefact accomplishes its original objectives and fulfils its requirements in an easy-to-understand manner. This then answers the fourth and final research question.
Communication The thesis and colloquium will serve as the means of documenting
1.4 Scope & Assumptions
Seeing as this is an iterative approach, the different phases were each considered a few times, based on results attained from later phases. Particularly the requirements set out for the artefact, and its development were done in an agile fashion, dependent on the feed-back attained from early prototypes.
1.4
Scope & Assumptions
Although more assumptions and limitations are identified during the remainder of the chapters, the following points are important to understand from the beginning.
Firstly, even though a common set of business analytics do exist, it is by no means a fixed set. It is a broad and undefined range, the exact choice and operationalization of any analytics by an enterprise will differ from one industry to another, and even one company to another within the same industry. These choices depend on the exact objectives and capabilities of the enterprise in question (Davenport, 2006).
Certain types of analytics, will also most likely be executed in purpose built appli-cations. Many business intelligence applications exist for instance, specifically to deal with descriptive analytics requiring the analysis of huge data sets. Other analytics though, such as those used for more prescriptive purposes, are far more likely to be solved in applications such as Microsoft Excel in which it is relatively easy to quickly develop new, one-off analysis models. Therefore the choice of analytics to be devel-oped for this artefact is by no means an obvious one, and only covers a small range of analytics.
Secondly, during the completion of this project a varied number of sources were used to demonstrate the importance of business analytics and enterprise architecture analysis. Examples for business analytics include:
• The ample number of purpose built business analytics applications available on the market today, such as those provided by SAS 1, rapidminer 2 and Knime 3. Then there are of course the solutions offered by big corporate players such as IBM’s host of solutions for business analytics 4. Of the numerous other players in this field, these are the four leaders therein according to Gartner’s 2014Magic Quadrant for Advanced Analytics Platforms report by Herschel et al. (2014).
1http://www.sas.com/ 2http://rapidminer.com/ 3https://www.knime.org/
• Predictions from corporations conducting research into business trends, regard-ing the growth, future importance and direction of the field. Examples include Gartner, IBM, KPMG and Accenture, to name but a few (Accenture, 2013; IBM, 2012; KPMG, 2013; Schulte et al., 2013).
• Academic research into the field, explaining its importance in establishing a competitive advantage (Davenport, 2006; Davenport and Harris, 2013; Sprongl, 2013).
The sources demonstrating the importance and potential of enterprise architecture analysis are mostly limited to academic research at this point in time, with those dealing with quantitative analysis (as in the case of business analytics) being even fewer. However, in answering the first research question the validity of this particular avenue of research is established. In the case of a positive evaluation of the artefact, it will serve as a further demonstration of the importance and potential of such work. It is nonetheless, also recognised that not all ideas seen as worthwhile pursuits in the eyes of academic research will necessarily be end up being adopted in business practice. In order to maximise the possibility of acceptance, the objectives identified during step 2 of the design science research methodology, and the subsequent evaluation in step 5 will emphasise points which are important to business users (the stakeholders). Having made that statement of intent, it is nevertheless not the primary objective of this research to ensure that the artefact (or that which it represents) is immediately accepted by business users. It is after all not the case that every good, or worthwhile research outcome is implemented into practice. This does not however, diminish its importance, or its merit.
1.5
Document Overview
Sub-research questionsaandb have a chapter dedicated to them each, serving to
iden-tify the primary pillars of theoretical knowledge, research directions and developments within this field.
1.5 Document Overview
Identify Problem & Motivate ObjectivesDefine of a Solution
Design &
Development Demonstration Evaluation
Enterpise Architecture Analysis Business Analytics Executable EA models & the Monte Carlo Method
The Artefact IllustrativeCases Evaluation Chapter 2: Chapter 3: Chapter 4: Chapter 5: Chapter 6: Chapter 7:
RQ 1a RQ 1b
RQ 1 RQ 2 RQ 3 RQ 4
DSRM Phase
Chapters
Research Question
Fig. 1.2 Document Overview
Chapter 3 moves onto RQ 1-b, investigating the importance of business analytics
to today’s enterprise environment, and what synergies exist between these two fields which could be used to form the bedrock for this project from a theoretical perspective, and more practically speaking for the artefact. In its conclusion the first research question is answered as a whole.
Based on the findings of the first research question, chapter 4 serves to answer research question two. The purpose here is to be very specific about the objectives for the artefact, as inferred from theory and stakeholder analysis.
Having identified the objectives and subsequent requirements for the artefact, chap-ter 5 explains the design and development of the artefact, thereby answering the third research question.
Chapter 6 explains the context of two illustrative cases and how the artefact was used to solve the business problems in them. These cases are used to demonstrate the functionality provided by the artefact, which is used to for its evaluation summarised in chapter 7, thereby satisfying the fourth and final research objective.
[image:27.595.60.554.103.295.2]Chapter 2
Enterprise Architecture Analysis
2.1
Introduction
In order to complete the first phase of the DSRM, namely to identify the problem and motivate its importance, a bit of background and contextual information is required first. This chapter specifically considers enterprise architectures (EAs), with the goal of answering research question RQ 1-a by means of a literature study. To do so,
an investigation into the research progress and directions taken by other researchers specifically considering the topic of interest to this project, also has to be made. To reiterate, the first sub-research question reads:
What is understood under the term enterprise architecture analytics, and
what is its purpose? Are there any existing standard guidelines or methods specifically designed to develop simulation models of enterprise architec-tures models?
2.2
Enterprise Architecture Fundamentals
2.2.1
Purpose
A number of modelling methods and languages exist to model specific parts of an or-ganisations’ operations and structure. Business processes can for instance be modelled with Business Process Modelling Notation (BPMN); information systems again have a range of methods depending on what is being represented. The Unified Modelling Lan-guage alone consists of 13 different diagram types, designed to meet the requirements of different user groups, be it the coding expert, or information system’s (IS) designer (Object Management Group, 2011, 2013). An enterprise’s information and technology services, processes and infrastructure can therefore be modelled independently (Iacob and Jonkers, 2006; The Open Group, 2011).
Making and analysing the impact of changes on any one such part of the enterprise is facilitated by these models, allowing the architects and developers of these parts to design and optimise their local operations. However, an enterprise’s performance can not be optimised at the global level merely by optimising the individual parts. Each part is related to, and dependent on the other. Therefore the design of any one part needs to take the requirements and functioning of the others into account if the organisation wants to be able to realise efficiency and effectiveness on a global level.
Therein lies the need for enterprise architectures. By capturing the complexity and relationships between the various parts of an enterprise, new organisational efficiencies can be attained by integrating processes into a coherent unit that is able to respond to change and deliver the business strategy. Enterprise architectures by no means attempt to replace the languages and methods used to describe the various parts in very fine detail. Instead it is designed to model these parts at an less detailed, abstracted level. The emphasis here, after all, is the global enterprise and the inter-relationships between its parts. (Jonkers et al., 2013; The Open Group, 2011)
2.2.2
EA Today
2.2 Enterprise Architecture Fundamentals
TOGAF (The Open Group Architecture Framework), DODAF (U.S. Department of Defense Architecture Framework Working Group), FEAF (U.S. Federal Enterprise Architecture Framework), TEAF (U.S. Treasury Enterprise Architecture Framework), and more bespoke examples developed for specific enterprises (United States Depart-ment of Defense, 2010; U.S. Office of ManageDepart-ment et al., 2007). (Many of these in turn have a number of variations designed for specific industries, or designed by specific groups.) These developments efforts were initiated from dissimilar starting positions, being driven by their own specific motivations and adopting different definitions of EA along the way.
Although no single, universally accepted definition of EA, or EA management subsists, for the purposes of this project the formal definition used by The Open Group Architecture Framework (TOGAF) is used (Buckl et al., 2008; Matthes, 2008). Namely, enterprise architecture is the methods, languages, frameworks and tools used to develop and represent the enterprise’s architecture (The Open Group, 2011).
As the definition indicates, business areas such process management and also higher level concepts such as strategy management can now also form part EA initiatives (Wan and Carlsson, 2012). In addition to the basic frameworks, EAs typically also propose some form or another EA life-cycle management processes. (Wan and Carls-son, 2012)
Though a corporation, or an organisation as a whole is sometimes the enterprise in question, the term in this context also refers to anything from a single business domain to a collection of organisations in a cross-enterprise initiative. In short, as defined by The Open Group (2011, pg. 5), "any collection of organisations with a common set of goals" can be defined as an enterprise. Irrespectively of whether the enterprise in
question constitutes the entire organisation, or a small subset thereof, it will involve multiple systems and functional groups.
2.2.3
Beyond Static Models
for a variety of applications, however this is still a maturing field of research wherein a number of avenues remain to be explored. (Buckl et al., 2009b; Jonkers et al., 2013)
The purpose and various means of EA analysis are discussed next.
2.3
EA Analysis
A number of vendors provide tools with which architectures can be modelled in accor-dance to the guidelines set out in one or other architecture framework. These however, are mostly completely static, and are therefore unable to capture enterprise behaviour (Glazner, 2009). These models have typically only been used to model the structure and relationships of any enterprise. These models, tend to support the implementation of new systems, and can not describe what bearings the architecture of the enterprise will have on the actual performance of the enterprise.
According to Wan and Carlsson (2012) EA analysis is of critical importance if an organisation is to successfully leverage an EA:
1. Analytics brings new insights of an organisation and its architecture to light. By gathering and analysing enterprise data, any real or potential deficiencies can be identified. The typical EA artefacts such as models do not always show these weaknesses and gaps.
2. EA initiatives typically occur at a large scale and are inherently complex and risky. To reduce the uncertainty associated with architectural design decisions, in-depth analysis can provide decision makers with the necessary information to make informed choices.
2.3.1
Classification Schemes
Jonkers et al. (2013) classifies such analyses into four categories according to two dimensions. The first distinguishes the type of inputs/results of the analysis, and the second the technique used for analysis. When considering the inputs and results of an analysis, a distinction is made between functional and quantitative analysis.
2.3 EA Analysis
Fig. 2.1 Analysis Dimensions (Jonkers et al., 2013)
Analytical Simulation
Functional Quantitative
the focus areas of most EA analysis in research. Whereas approaches to EA analyses are typically largely isolated from one-another, the classification scheme is presented as a stepping stone towards the development of a conceptual framework wherein the various analysis techniques can be integrated and eventually create a single approach to EA analysis. Whereas Jonkers et al. (2013) only refers to two classifiers, Buckl et al. (2009b) classifies EA analysis according to five different dimensions. An overview of the dimensions and their categories is provided in Figure 2.1, and described in further detail here:
Body of Analysis Where Jonkers et al. (2013) considers the input and results of
analyses under one dimension, Buckl et al. (2009b) distinguishes between the
body of the analysis, and the analysis concern. The body of analysis speaks to
the type of result the analysis yields, whilst analysis concern speaks to whether or not the analysis concerns itself with the delivery of an organisational func-tion. The body of analysis can either be of the structure, behaviour statistics
or dynamic behaviour. Due to the structural complexity of an enterprise
[image:33.595.192.424.148.295.2]Time Reference An EA can either model a current enterprise, or that of a planned
architecture. The advantage of ex-post analysis is that analyses rely on
mea-surements taken from an active organisation and with certainty of structural composition. Ex-ante analyses, on the other hand, need to rely on predictions
and account for the uncertainty of the final architecture.
When classifying EA analyses and the body of analysis is the structure of the EA, the question of time does not play a significant role as the method of anal-ysis does not change. Similarly, when behavioural analyses are concerned, most are applicable in both time dimensions, however research in this field primarily focuses on demonstrating ex-post analysis in research, without explicitly consid-ering the uncertainties introduced when considconsid-ering ex-ante analyses.
Analysis Technique Where Jonkers et al. (2013) distinguishes between simulation
and analytical approaches to analyses, Buckl et al. (2009b) distinguishes be-tween expert-based, rule-based and indicator-based analysis. Expert-based
anal-ysis are the least formal, most flexible, but also most time-consuming of methods. By making use of EA views and relying on their experience and expertise, ex-perts can provide anything ranging from concrete advice, to abstract suggestions and ideas. Rule-based analysis depends on formalised, pre-defined guidelines for
choice architectural configurations prescribing both desirable and undesirable conventions. An analyses therefore either detects the manifestation or absence of select architectural patterns and can additionally be automated. Indicator-based analysis is the most formalised of techniques, delivering the most explicit
and immediately interpretable of results. Indicators are extracted by quantita-tively assessing properties of the architecture, typically computed from values of observable architectural properties (for example: complexity). Such indi-cators provide insight on very specific architectural attributes, but have to be interpreted with care as, for instance, they are always based on circumstantial assumptions.
As the rule-based and indicator-based analysis are very distinct concepts, identi-fying them in practice is easily accomplished, and no approaches simultaneously incorporate both. However, due to expert-based analysis’ definition, it is not always easily delineated from other characteristics provided by an analysis’ de-scription.
im-2.3 EA Analysis
portant enough by Buckl et al. (2009b) to incorporate as a separate dimension into the classification scheme.
Analysis Concern As described in under body of analysis, Jonkers et al. (2013)
distinguishes between functional and quantitative analysis.Buckl et al. (2009b) follows a very similar trend, however distinguishes betweenfunctional and more
broadly defined non-functional analysis concern. Organisations exist, and are
architected, to execute certain enterprise functions, such as marketing or pro-duction. Functional analysis then, aims to assess the enterprise system in its execution of these functional requirements as articulated in its architecture. In comparison an enterprise system’s non-functional properties, such as throughput rate or processing time, are also of interest, especially if alternative architectures are being compared. Buckl et al. (2009b) argues that non-functional analysis do not-necessarily have to only be analysed quantitatively (for instance in the case of security matters), and that the term quantitative analysis is therefore
inap-propriate.
Non-functional, particularly economic concerns are the primary focus of EA analyses. This is likely due to the fact that functional facets of an EA are commonly difficult to define, which in turn makes highly structured analyses challenging. However some decidedly generic, mostly expert-based techniques can be applied to either of the concerns.
Self-Referentiality As previously discussed and outlined in figure ??, the field of
enterprise architecture not only considers the actual structure of the enterprise architecture, but a host of enabling and supporting methods, tools and theo-ries. With this in mind, an enterprise’s architecture does not merely contain the architecture landscapes, but also the blueprints and strategies guiding the design and management of those landscapes (including EA analysis efforts). As such EAs’ are self-referential, in that one part refers to, and is dependent on another within the same architecture. In light of this architecture analysis can incorporate the analysis of one or more higher levels of referentiality contained in an EA. Most analysis are straight-forward and therefore consider none of the
architectural components underlying EA management. In asingle-level analysis,
one level of self-referentiality would be considered, i.e the EA management activ-ities contained within the architecture. Beyond this a multi-level analysis would
of EA management activities) in its assessment. One of the possible benefits of including extended architectural components to analyse self-referentiality is to gain insight into the emergent behaviour of enterprise systems.
EA analysis have mostly not considered self-referentiality, one reason being that as described above, the function of EA management has been maturing itself still until rather recently. Before EA analyses can be developed to assess self-referentiality, an established function needs to exist, so as to know how to design and implement such an analysis. Related to the this subject of the development of the EA management field, are EA maturity models which have been receiving an increasing amount of attention in recent years.
Table 2.1 EA Analysis Classification Scheme according to Buckl et al. (2009a)
Classifier Dimensions
Body of Analysis structure, behaviour statistics, dynamic behaviour Time Reference ex-post, ex-ante
Analysis Technique expert-based, rule-based, indicator-based Analysis Concern functional, non-functional
Self-Referentiality none, single-level, multi-level
2.3.2
Analytics Activities
The understanding of the term enterprise architecture analysis differs in various
con-texts as it is associated with a variety of application areas. No single, clearly delineated definition has been formalised and most literature on the subject remain vague and ambiguous on the term. To demonstrate just how broad a range of understandings are associated with the term, Wan and Carlsson (2012) identifies, describes and relates a set of six analysis activities. By characterizing, classifying, and differentiate the activities, the field is explored.
2.3 EA Analysis
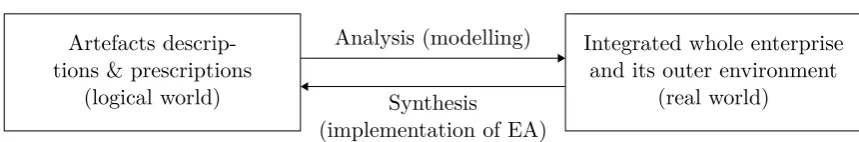
Artefacts descrip-tions & prescripdescrip-tions
(logical world)
Integrated whole enterprise and its outer environment
(real world) Analysis (modelling)
Synthesis
(implementation of EA)
Fig. 2.2 Analysis and synthesis of EA with modelling Wan and Carlsson (2012).
I. System Thinking One of the primary purposes of EAs is to identify how the
vari-ous components from different domains fit together and interoperate. Architects often know what the objective resultant behaviour is, and wish to determine how best to achieve this behaviour by considering the components involved in realis-ing this behaviour. When considerrealis-ing EA from a systems perspective then, two types analysis are of interest. Firstly the emergent behaviour of the system might be of interest. The complexity in systems leads to a complex set of interactions, the outcome of which may be difficult to predict. Or given the behaviour of a system, the cause for that behaviour may be of interest, which requires that the components involved in producing the behaviour, and the interactions between them are studies in detail.
II. Modelling Another form of analysis required during the enterprise architectures
development and evaluation process is that of assessing the enterprise system, as well as the external environment in which it is located in order to produce the necessary artefacts describing current as-is architectures, as well to-be design descriptions (see Figure 2.2). This process is not straight-forward though and requires a significant amount of work. The modellers need to make decisions in an attempt to reduce uncertainty. The design process attempts to clarify the state or to-be state of things, however details are often hard to come by, or no guidelines exists on how to best design solutions. Also, vast amounts of infor-mation which have no clear boundaries or inherent importance indicators need to be sifted through in order to determine which information is important to specific stakeholders, and how this information can be encapsulated and repre-sented in a simplified form. The real-world can often be reprerepre-sented in multiple ways, requiring the modellers to rely on their experience, creativity and expert knowledge.
[image:37.595.88.518.101.172.2]In order to reduce this risk as far as possible, two types of measurement activ-ities can take place. Firstly, tools and methods exist to analyse or predict EA properties and behaviour. These measurements from the real world, or based on models thereof, such as in the case of predictive measurements. These mea-surements for instance can serve to evaluate the EA. Secondly, the models used for these measurements, and the process used to develop them, can be also be assessed. This is necessary to ensure that the measurements, or predictions they yield are accurate representations of the properties of interest. Such analysis are for instance required for verification and validation purposes.
IV. Satisfying EA initiatives typically involve a number of stakeholders with
differ-ent requiremdiffer-ents. Although these requiremdiffer-ents can at times counter each other, the design process ultimately needs to lead to an EA with which all stakeholders are these satisfied. EA design is therefore in effect a multi-criteria problem and the design process yields alternatives which architects need to analyse to check whether, and to what extent they satisfy stakeholders’ various requirements. During this iterative design process three activities aid the architects in finding the most suitable of solutions. Firstly, during sensitivity analysis the affect of
changing inputs on the resultant system properties and outputs are analysed. This analysis is performed to account for uncertainty inherent in any future es-timates. Secondly, trade-off analysis is performed to compare how alternatives
meet different requirements. Lastly, revision and solutions formulation are
im-portant considerations when attempting to find a satisfactory EA design. In order to reach a compromise between stakeholders, EA designs are revised until consensus is eventually reached. Then, looking beyond the design stage of EA, the chosen architecture also determines the enterprise changes that need to be made. The resultant change management plans may in turn influence the design of the EA.
V. Requirements Analysis Here both the requirements of the EA, and that of the
2.3 EA Analysis
VI. Comparing Alternatives Due to the multi-criteria nature of EA design, a
num-ber of alternatives are likely to be found which satisfy the requirements of the stakeholders. A final selection then needs to be made between these. In order to make an informed business decisions, the decision maker needs to compare the advantages and disadvantages of each alternative according to a number of dimensions. The modelling, measuring and satisfying activities can be used to form a complete assessment to use as a starting point for comparison. How-ever, other methods, such as sensitivity analysis can be revisited to gain further insight.
2.3.3
Relationships & Activity Types
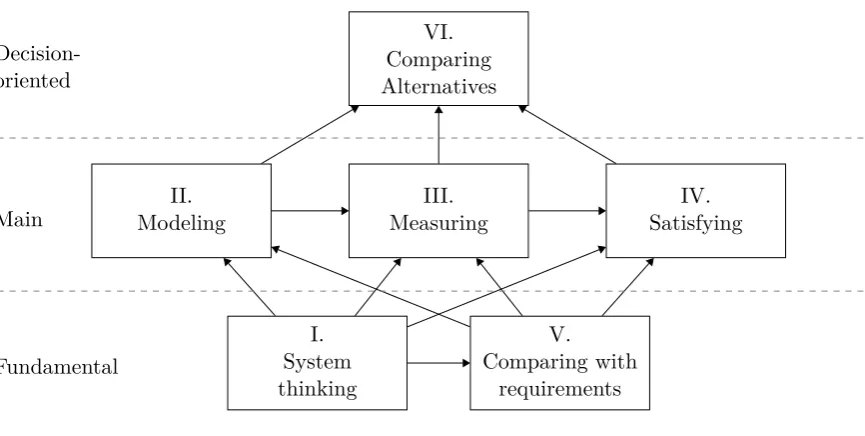
Based on the interrelationships between the six activities, they can be grouped into three levels. The first level is the fundamental level as the two activities therein, system thinkingandcomparing with requirements, form the elementary building blocks
of EA analysis. Following this, the main level, includes the modelling,measuring and satisfying activities which are principal, or common to EA analysis. The ultimate end
goal of any analysis is to provide useful insights which can be used in the decision making process. This is finally embodied in the comparing alternatives activity which
and is therefore in a level of its own, the decision-oriented level.
Simplistically seen, the directions of the arrows in Figure 2.3 indicate which activ-ities directly support others. This has two dimensions of significance. EA artefacts, such as models etc. are an integral part to any EA initiative, and so too artefacts are developed or used by each of the six activities. The artefacts produced by one activity are used as input by another, the arrows are therefore analogous to information flows. Information flows in turn are indicative of a temporal process. More specifically, the arrows indicate the temporal sequence of the activities which underlie a continuous EA management process supporting architecture evolution.
VI. Comparing Alternatives
III. Measuring II.
Modeling
IV. Satisfying
I. System thinking
V. Comparing with
requirements
Decision-oriented
Main
Fundamental
Fig. 2.3 The interrelationship of analysis activities according to Wan and Carlsson (2012).
including a broad range of concepts from EA practice, so as to encourage and support a theoretically vigorous development process.
2.4
Executable Enterprise Architecture Models
2.4.1
Definition
If we are interested in predicting (ex-post) the dynamic behaviour according to select indicators, various simulation techniques might be used to do so, which is where the concept of executable EA models can be introduced. To start, Bagnulo and Harvey
(2008) concept of executable architectures (as cited in Ludwig et al. (2011)) is intro-duced (not specific to enterprise architectures). They identify them as “the dynamic model of the behaviour of a system where the architecture elements are uniquely iden-tified, consistently used and structured in a way to enable their simulation”. In other
words, executable architectures model dynamic systems, such that they can be sim-ulated, but the elements of the original architectural model are uniquely identified. They therefore provide the link between architecture models to executable simulations. When speaking of executable enterprise architecture models then, the architecture
[image:40.595.80.513.103.321.2]2.4 Executable Enterprise Architecture Models
In other words, EA models which have been enriched with dynamic elements, which can be simulated in order to infer run-time characteristics of the enterprise (Banks et al. (2009) as cited in Manzur et al. (2012)).
2.4.2
EA Simulation
The development of such executable EA models has peaked the interest of a few researchers, some of these efforts are described here. Manzur et al. (2012) developed two metamodels, as part of a model-based platform in which EAs can be modelled (though only those elements of interest to the simulation) and subsequently simulated. The platform allows a variety of dynamic elements to be specified for the different structural elements of the EA. Following this, different scenarios can be defined, then executed in order to observe the run-time behaviour and calculate indicators.
Another foray into EA simulation metamodels is made by Ludwig et al. (2011). Their particular focus is to enable rapid prototyping, executing and analysing EA models in a loop. Both Manzur et al. (2012) and Ludwig et al. (2011) developed limited prototypes to show their metamodels in practice.
Buckl et al. (2008) does not go so far as to develop a prototype, but does provide an approach to develop EA simulations rooted in theoretical methods and principles such as application management, simulation techniques, metrics, etc.
Similar work has been done for UML type models, some of which can be adapted for the use with EA models. One such example is that of Buschle et al. (2013), who develop a tool to support the Predictive, Probabilistic Architecture Modelling Framework (Johnson et al., 2013) originally developed for UML models. It is used for probabilistic assessment and to predict system properties, or in this case, EA properties.
2.5
Archimate
As previously described, a number of EA frameworks exist. However, the architecture modelling language standard developed by The Open Group1 is used for the purposes of this project and will briefly be described here.
ArchiMate provides the necessary concepts and techniques to model the structures and dependencies within the various business domains at a high-level of abstraction, as well as the relations between these domains. ArchiMate uses various visual iden-tifiers, such as shapes and colours, to visually distinguish architectural concepts and so communicate to an architecture to both architecture experts, as well as business users. These models further lend themselves to analysis, particularly if a modelling tool such as BIZZdesign’s Archimate is used for the modelling.
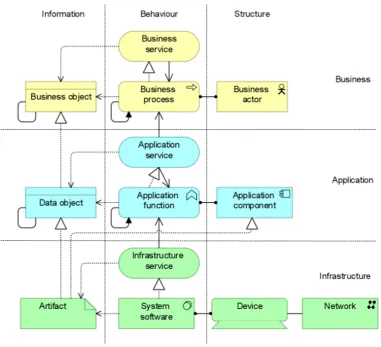
In figure 2.4 an informal metamodel of the ArchiMate language can be found, identifying the primary elements and the relations that may exist between them. The elements can be found in three different layers. The business layer depict concepts such as the organisational structure and business processes. Following this the application layer, which depict concepts such as application components and services. Finally, the technical infrastructure layer which are used to model items such as the hard-ware artefacts and networks. For each of these layers, ArchiMate specifically depicts structural, behavioural and informational aspects. (Iacob and Jonkers, 2006)
The architectural elements and relations of an EA can be augmented with quan-titative data by adding custom properties, called attributes in ArchiMate (Iacob and
Jonkers, 2006). The attributes can either be used as input variables for analyses, or be the output of the analyses themselves. The detailed description and specifications of the language can be found in The Open Group (2013).
2.6
Conclusion to EA Analysis
In the first step towards completing phase one of the DSRM (identifying the problem), this chapter considered the question:
What is understood under the termenterprise architecture analytics, and
what is its purpose? Are there any existing standard guidelines or methods specifically designed to develop simulation models of enterprise architec-tures models?
2.6 Conclusion to EA Analysis
Fig. 2.4 ArchiMate metamodel as in Iacob and Jonkers (2006)
The basic premise, and purpose of EAs were considered first, before moving on to EA analytics in section 2.3, and finally executable EA models in section 2.4. The classification scheme presented by Buckl et al. (2009a), and the analysis activity types described by Wan and Carlsson (2012) provide a sufficient answer to the first part of the question.
Although the metamodels and the other sources discussed in section 2.4.2 might be useful, and one detailed approach to develop EA model based simulations is discussed by Buckl et al. (2008), none of the methods can be said to be standard, i.e. widely used and accepted. Most of the work in this field is directed at creating metamodels, or otherwise distinct models which can be used for simulation purposes. However none of these are far developed yet, and as such neither are their supporting methods.
[image:43.595.108.490.116.463.2]Chapter 3
Business Analytics
"In God we trust, all others bring data."
- William Edwards Deming
3.1
Introduction
The purpose of this chapter is first and foremost to answer research question 1-b,
reading:
What are business analytics? Is there a synergy between business analytics and enterprise architectures which would encourage and facilitate further investigation into this topic? How are Monte Carlo simulations used for business analytics?
After this, conclusions can be drawn to answer research question1:
Can enterprise architecture models be used as the foundation for Monte Carlo simulation based business analytics, and if so what problem would this aim to solve?
This will then also complete phase 1 of the DSRM, and as such will identify the primary problem the artefact is developed to solve.
3.2
Fundamentals
Firms are always looking for new ways in which to gain a competitive advantage, how-ever as any core difference between products and the technologies behind them be-coming increasingly negligible in many markets, new avenues are being sought through which to gain real competitive advantage. One remaining differentiator is the business processes delivering those products and determining all internal workings of a firm. This is where business analytics are being used by numerous companies in various capacities to increase the value of those business processes. However it is only used by a few to its full potential, which is to become a cornerstone in a business’s strategic reach for competitive advantage. (Davenport, 2006)
Today firms can access a host of data sources to find information regarding what customers are buying, what internal employee turnover rates and compensation costs are and when to their inventory levels are low. However, firms having with a realised the full potential of business analytics can also know how much their customers are willing to pay and how many times they will re-purchase items in a lifetime; what each individual employee contributes to the bottom line and how salaries relate to perfor-mance levels; how to keep inventory levels low with ideal re-orders given predicted changes in demand levels and supply chains limitations.
These are but some typical examples of the wealth of information analytics can make available to organizations, enabling them to hone their business processes, mak-ing informed decisions based on real, data-driven evidence. Further examples of com-mon BAs can be found in table 3.1.
Although various formal definitions and classification of analytics exist, Evans (2013) describes Business Analytics as:
“The use of data, Information Technology, statistical analysis, quan-titative methods, and mathematical or computer-based models to help managers gain improved insight about their business operations and make better, fact-based decisions.”
3.2 Fundamentals
Table 3.1 Common Applications of Business Analytics (Davenport, 2006)
Function Description
Supply Chain Simulate and optimize supply chain streams; reduce inventory levels and stock-out occurrences
Customer selection,
loyalty and service Differentiate customers with greatest profit prospects; In-crease the product offering’s desirability to customers. Main-tain customer loyalty.
Pricing Ascertain the price point that will maximize sale numbers, or profit.
Human Capital Identify potential employees most suited to the specific as-signments, at particular salary levels.
Product and service
quality Promptly detect quality issues and reduce error occurrences. Financial
performance Gain clear insight into financial performance drivers and theinfluence of non-financial factors Research and
development Improve product quality, value, and if applicable, safety.
Input
Data, Uncontrollable Variables, and Decision Variables
Decision Model PerformanceMeasures of or Behaviour
Output
[image:47.595.86.537.177.461.2]3.2.1
Analytics Competitors
Davenport (2006) identified a number of corporations which have been using analytics to as a strategic mechanism to gain dominant market positions. A number of common attributes exist among these corporations, which have enabled them to become, what Davenport has labelled, analytics competitors:
Widespread use of modelling and optimization As already mentioned, a wide
range of analytics exist, such as average order size per purchase, to the far more complex predictive analysis. Corporations wishing to contend at the same level as analytics competitors need to explore the full potential range analytics have on offer. By exploiting data generated internally, and far more effectively exploiting data available externally than their less analytically focused competitors, they can gain far greater business insights. They can explore the which customers give them the most business, which ones are most likely to do so in future, and which ones are likely to turn to competitors instead. By evaluating their supply chains they can not only work to optimize it, but pre-emptively identify potential constrains, simulate alternatives and find effective, efficient solutions. They can price their products in real time to gain the greatest potential revenues from customers. Complex financial models relate operational costs to their financial position. Instead of relying on intuition, leaders in the field use sophisticated business experiments to analyse the impact of strategies, using the results to improve their analytics for similar future initiatives.
An enterprise approach Using analytics throughout an organisation means that
3.2 Fundamentals
models used for, and the data required for analytics. Data quality also often suf-fers as departments often end up working with individual spreadsheets, which often contain incorrect data. To remedy this and ensure al efforts are geared towards fulfilling strategic goals, analytics initiatives need to centrally managed across all business units, using common technology , methods and tools. This ensures that data and resources can be well managed and shared across business functions as these conform to consistent formats, definitions and standards.
Senior executive advocates Making analytics a widely used, and core part of an
enterprise necessitates wide ranging changes in an organisation’s culture, pro-cesses, behaviour and skill set. Although such efforts can start in individual business or functional units, the effect of such efforts remain contained as the leaders of these units do not necessarily possess the necessary authority, or even perspective, to realise meaningful results. Like any other major reform effort it instead requires the support, and leadership from top-level executives. These senior advocates do not necessarily have to be statistical experts themselves, but they need to value the power of analytics, whilst also understanding its un-derlying principles and limitations. The company needs to be willing to invest in the required resources to develop its own capacity, and when needed retain necessary the experts capable of relating complex quantitative methods to the business’s operations and the needs.
3.2.2
Synergy between EA and BA
Instead of considering the enterprise architecture first, and how it can be used as the foundation for the prediction of enterprise behaviour, here business analytics are considered in terms of the impact they can have on an enterprise, and what is required of the enterprise in order to achieve such analytical capabilities. A number of the requirements identified by Davenport (2006), can be related to what EAs already provide.
A synergy can therefore be identified, between that of business analytics used to gain serious competitive advantage, and the realm of enterprises architectures:
• The first and greatest of synergies can be found in the need for an enterprise approach for business analytics. Even though enterprise in this instance is
EAs cross-functional approach. Architectures intend to capture all connections that exist between the various building blocks, independent of the domain they belong to. BA can therefore possibly gain advantage by relying on the practices, or being based on the artefacts produced by EA’s when their own models are being developed.
• The previous point is also closely related to next. Widespread use of modelling and optimisation can be achieved far more easily if an EA is used to support the effort. As EAs span boundaries within enterprises, it is far easier to identify where business analytics should be used throughout an organisation (as opposed to ones view being limited by the dividers between business units) and then making the necessary arrangements to facilitate the necessary modelling and optimisation efforts.
3.3
The Monte Carlo Method
3.3.1
Stochastic Models
As seen in figure 3.1, business analytics requires some input variables in order to calculate an output measure. If considering past events, this is easy to accomplish if you have the necessary data on hand. However, once you start considering the future for instance, things start to look different.
Due to randomness, uncertainty and risk is introduced into the model. This ran-domness can be specifying input variables as appropriate probability distributions . Some famous continuous distributions include the Uniform, Normal, Triangular and Exponential distribution (Allen, 2011). However, many more exist of course. Once a model contains a random variable, it is a stochastic, or probabilistic model in itself. (Evans, 2013)
3.3.2
Overview of Method
3.3 The Monte Carlo Method
Once a sufficient number of runs have been completed, histograms and other de-scriptive statistics can be used to describe the output of the model, in order to garner information about its distribution. This information, having taken the uncertainties and risks of the inputs into account, is then used to make a decision as with other BAs.
3.3.3
Histogram & Descriptive Statistics
The descriptive statistics typically useful for the analysis of the results of a Monte Carlo simulation are as follows (Evans, 2013):
Sample mean
the mean if a sample of n observations, x1, x2, . . . , xn referred to as x, is
calcu-lated as:
x(n) = 1 n
n
X
j=1
xj (3.1)
Sample standard deviation
ˆ σ = v u u u t n P
j=1(
xj −xn)2
n−1 (3.2)
Seeing
Kurtosis
g2 = m4
m22 −3 =
1
n n
P
i=1(
x1−x)4
1
n n
P
i=1(
xi−x)2
2 −3 (3.3)
m4 is the fourth sample moment about the mean and m2 the second sample
moment about the mean (or sample variance)
Estimator of Population Skewness
g1 = m3
ˆ σ 3 = 1 n n P
i=1(
xi−x)3
1
n−1
n
P
i=1(
xi−x)2
3/2 (3.4)
Median
The median is either the middle number in an ordered list of sample values, if there are an odd number of n values. Or the average of the two middle values
in the list if there are an even number ofn values.
Interquartile range
To calculate the Interquartile range (IQR), the first Q1 and third quartile Q3
need to be calculated. If there are an odd number of samples, the central value, or median, is excluded from the upper and lower half of the sorted list of values. As in the case of the median, if these halves contain an even number of samples, the average of middle denote the first quartile, and similarly, the middle two value of the upper half of the list denote the third quartile. If, however, there are an odd number of values in each of the two halves, the middle value in each the lower and higher list are taken as the first and third quartile respectively. The IQR is the calculated as:
IQR=Q3−Q1 (3.5)
3.3.4
Histogram
In order to analyse the results of a Monte Carlo simulation visually, a histogram can be created. Histograms are useful to visually inspect the spread of the sample data over its range; to visually inspect some of the quantitative descriptive statistics described above. The number of bins to use for the histogram is up to the individual conducting the analysis, however a number of formulas exist to help in this his choice (Scott, 1992):
Square-root choice
k =√n (3.6)
Sturge’s formula
k =⌈log2n+ 1⌉ (3.7)
3.4 Conclusion to Business Analytics
k= log2(n) + log2 1 + |g1 | σg1
!
(3.8)
where
σg1 =
v u u
t 6(
n−2)
(n+ 1)(n+ 3)
Scott’s reference rule
h= 3.5ˆσ
n1/3 (3.9)
Freedman-Diacois’ choice
h= 2IQR(x)
n1/3 (3.10)
here IQR is the interquartile range, which is less sensitive to outliers in sample.
After the user has selected the number of binsh, the bin widthk can be calculated
as
k =
max x−min x
h
after which the number of samples fitting into each bin can be determined.
3.4
Conclusion to Business Analytics
Coming back to the research questions, RQ 1-b asks:
What are business analytics? Is there a synergy between business analytics and enterprise architectures which would encourage and facilitate further investigation into this topic? How are Monte Carlo simulations used for business analytics?
By considering some of the basic principles of BAs, and some common BAs, the first part of that research question could be answered. Moving on, section 3.2.2 consid-ers the synergies that exist between EAs and BAs, finding that there could potentially be numerous benefits if these synergies were to be exploited. Finally the Monte Carlo method (or simulations) are briefly considered, explaining the concept of variability, and how the Monte Carlo method can be used in conjunction with descriptive statis-tics.
Can enterprise architecture models be used as the foundation for Monte Carlo simulation based business analytics, and if so what problem would this aim to solve?
In chapter 2 it was seen that EAs can be extended, or used as the foundation for various types of simulation studies. This is a useful pursuit as it is important to predict and analyse resultant dynamic behaviour of a static EA model. The Monte Carlo method is also a method quite commonly used for various types of business analytics, allowing uncertainty and risk to be incorporated into a model through appropriate stochastic variables. The use the Monte Carlo method as a simulation method, being based on EA models, therefore seems to hold great promise.
In answer to the last part of the RQ-1, the following problem statement can then
be formalised:
How to develop an executable enterprise architecture model which can enable a diverse range of business analytics, which are founded on the Monte Carlo method, and can be both executed and evaluated?
Chapter 4
Executable EA Models & the
Monte Carlo Method
4.1
Introduction
In the previous chapter, the problem, and subsequent aim of the to-be artefact was identified. In short, the artefact should enable a diverse range of business analytics, which are founded on the Monte Carlo method, to be based upon EA models and subsequently executed and evaluated.
Following this, in the second phase of the DSRM, objectives are identified for the solution to the identified problem. This is the subject matter of this chapter, for which the second research question was identified:
Given these findings, what would be the requirements of a technical arte-fact designed to enabled Monte Carlo simulations, based on using enter-prise architecture models?
To answer this question, the different stakeholders are identified first, before con-sidering their respective objectives, and lastly the requirements that need to be fulfilled by the artefact in order to meet those objectives.