ORIGINAL RESEARCH
INTERVENTIONAL
Transverse Sinus Stenting for Pseudotumor Cerebri:
A Cost Comparison with CSF Shunting
R.M. Ahmed, F. Zmudzki, G.D. Parker, B.K. Owler, and G.M. Halmagyi
ABSTRACT
BACKGROUND AND PURPOSE: Transverse sinus venous stent placement has been shown to lower intracranial pressure in patients with venogenic pseudotumor cerebri and to reverse, or at least stabilize, its symptoms and signs. There have been no studies comparing the cost of venous stenting with the time-honored treatment for pseudotumor cerebri–CSF shunting. The purpose of this study was to compare the cost of trasverse sinus stenting versus CSF shunting for the treatment of pseudotumor cerebri.
MATERIALS AND METHODS: This work was a retrospective cost analysis of individual resource use in 86 adults who were stented for pseudotumor cerebri during a 12-year period compared with resource use in 110 children who were shunted for hydrocephalus during a 3-year period.
RESULTS:There was no significant difference between the cost of inserting an initial venous stent ($13,863⫾4890) versus inserting an initial CSF shunt ($15,797⫾5442) (P⫽.6337) or between inserting an additional venous stent ($9421⫾69) versus revising a CSF shunt ($10,470⫾1245) (P⫽.4996). There were far fewer additional venous stent insertions per patient than there were subsequent CSF shunt revisions; 87% of stents placed required just 1 stent procedure, whereas only 45% of shunts required 1 shunt procedure. The main cause of the cost difference was the need for repeated revisions of the shunts, especially when they became infected—24 instances of a total 143 shunt procedures (16.8%) at an average cost of $84,729, approximately 5 times the cost of an initial shunt insertion.
CONCLUSIONS: Venous stenting costs significantly less per 100 procedures than does CSF shunting, due largely to the high cost of treating shunt infections and the need for repeated shunt revisions.
ABBREVIATIONS:PTC⫽pseudotumor cerebri; TSS⫽transverse sinus stenting
T
ransverse sinus venous stent placement is an effective treat-ment for pseudotumor cerebri (PTC)1-3; however, its cost hasnot been assessed or compared with the cost of the traditional alternative—CSF shunting. The annual cost of treating PTC in the United States exceeds US $444 million, and the annual cost of all CSF shunts—not just for PTC— exceeds $1 billion.4,5We wanted
to estimate the cost of transverse sinus venous stenting and com-pare it with the cost of CSF shunting. Because pediatric hydro-cephalus typically requires CSF shunt insertion, this pediatric group was the most suitable one available for cost comparison.
Since the advent of venous sinus stenting for PTC, no patient has undergone CSF shunting at our institution for PTC. We reviewed the cost per patient for stent-versus-shunt insertion and reviewed the cost in terms of failed procedures, infection, and the need for revision, representing the full cost of these procedures.
MATERIALS AND METHODS
We reviewed the costs of treatment of 86 adult patients who had transverse sinus stenting (TSS) for PTC at Royal Prince Alfred Hospital between 2001 and 2012 and of 110 pediatric patients who had CSF shunting for hydrocephalus at Westmead Chil-dren’s Hospital between 2007 and 2009. Each procedure was clas-sified as “new” (first time) or as “subsequent,” and details of com-plications were identified.
For each patient, a total annual cost was estimated on the basis of the individual patient’s resource use for that year. The cost comparison was undertaken from the perspective of the Sydney hospitals that provided the treatment, focusing on detailed, direct medical costs. Ethics approval was not required by Royal Prince
Received June 7, 2013; accepted after revision September 23.
From the Departments of Neurology (R.A., G.M.H.) and Radiology (G.P.), Royal Prince Alfred Hospital, Sydney Australia; E´poque Consulting (F.Z.), Sydney, Austra-lia; TY Nelson Department of Neurology and Neurosurgery (B.O.), Children’s Hos-pital at Westmead, Sydney, Australia; and Discipline of Pediatrics and Child Health, and Surgery (B.O.), University of Sydney, Sydney, Australia.
Please address correspondence to Michael Halmagyi, MD, Department of Neurol-ogy, Royal Prince Alfred Hospital, Missenden Rd, Camperdown NSW, Australia 2050; e-mail: [email protected]
Alfred Hospital because TSS is offered as a treatment. Ethics ap-proval was separately provided by the Children’s Hospital West-mead Human Research Ethics Committee. All costs have been adjusted to 2012 levels in Australian dollars (AUD). The Austra-lian dollar at the time of writing was roughly equivalent to 0.94 US dollars.
Transverse Sinus Venous Stenting
The 86 patients with PTC underwent 99 procedures during the 12-year period, with follow-up from 6 months to 10 years, with a mean of 4 years. All details of resource usage were collated for each stage of diagnosis and treatment. For preadmission, the main costs comprised the following: 1) consultations with a neurolo-gist, ophthalmoloneurolo-gist, radioloneurolo-gist, and anesthetist; 2) MR imag-ing; 3) lumbar puncture; 4) diagnostic direct retrograde cerebral venography and manometry; and 5) dual antiplatelet medication for 1 week before stenting and platelet function studies. The main hospital treatment costs comprised the following: 1) therapeutic diagnostic direct retrograde cerebral venography; 2) general an-esthesia; 3) the stent; 4) medication during the procedure, pri-marily heparin; and 5) postprocedure accommodation, usually 1 night in a high-dependency unit. One-third of patients stayed an additional night in a general hospital bed for further observation. This information provided measurement of all resource use, length of stay, and revision rates. Valuation of resources was then incorporated by using published service schedules and unit costs, principally from the Australian Medical Benefits Scheme and publishedDiagnostic Related Groups; and specific costs, when nec-essary, were provided by the Royal Prince Alfred Radiology De-partment. The approach and costing sources used in this study are consistent with Australian government guidelines for preparing health economic analyses.6
CSF Shunting
The 110 patients had 143 procedures during the 3 years, for shunt insertion, shunt revision, and shunt infection, with no subsequent follow-up beyond the study period. Actual hospital costs were provided by the Children’s Hospital Westmead by using the Power Performance system. This is a clinical inpatient costing system linking resource cost inputs and allocation to each
indi-vidual patient on the basis of actual use. Allocation algorithms are applied to relevant source feeds from each system, including im-aging, pathology, pharmacy, operating theater, and physiother-apy. Resource use is captured by the time used, so costs reflect the duration of surgical procedures, the number of nurses, the dura-tion of anesthesia, and so forth.
Following extraction of the detailed costing data from the Power Performance Manager, review of records was undertaken to classify each episode. This was to exclude non-hydrocephalus primary diagnoses and to categorize patients as having a new shunt or a shunt revision. Patients with CSF shunts were addition-ally classified if they developed infection, to assess separately the cost of treatment. Patients with hydrocephalus secondary to trauma, malignancy, or other complex conditions (except myelo-meningocele) were excluded. Figures from the Power Perfor-mance Manager were adjusted to the 2012 AUD by using the total health price index published by the Australian Institute of Health and Welfare 2012.7
Statistics
The mean costs of each group were analyzed by using the Student
ttest, and a2test was used for demographic independence with
aPvalue⬍.05 considered statistically significant. Several 1-way sensitivity analyses were performed to establish whether the com-parative results were sensitive to cost, infection, or revision rate variables. These included using costs, infection, and revision rates and the total number of revisions per patient from studies of equivalent adult shunt cohorts to validate comparable age-matched scenarios. Statistical analysis was undertaken by using STATA statistical software (Special Edition, Version 12.1 2011; StataCorp, College Station, Texas).
RESULTS
Patient Groups
The baseline demographic characteristics for transverse sinus stent and CSF shunt patients are presented in Table 1.
A2test of independence confirmed the difference between
the 2 demographic groups(P⬍.001).
Number of Procedures
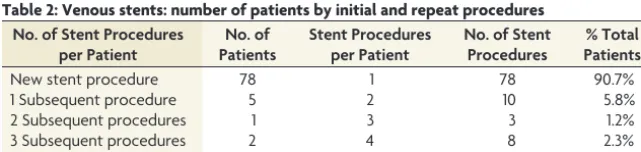
Most stented patients had just 1 stent at 1 procedure (Table 2); in contrast, many patients with CSF shunts needed further proce-dure revisions and treatment of infections (Table 3). The stented patient group, during the 12-year period, underwent 99 stent pro-cedures, 78 of 86 patients receiving a single procedure (90.7%) and the remaining 8 having additional stents: 5 patients, just 1 more; 1 patient, 2 more; and 2 patients, 3 more.
In contrast, the CSF shunt group had 143 procedures, only 40 of which (28%) were first-shunt insertions (Table 3).
Average Cost
There was no significant difference be-tween the average cost of an initial venous stenting ($13,863⫾4890) and an initial CSF shunting ($15,797 ⫾ 5442) (P ⫽
[image:2.594.54.286.551.630.2].6337); any difference is attributable to a few serious high-cost complications that
Table 1: Baseline demographics of patients with transverse sinus stents and CSF shunts
Age and Sex
No. of Patients (%)
PValue Transverse Sinus
Stent (n= 86)
CSF Shunt (n= 110)
Mean age (yr) 36.9⫾13.6 6.6⫾6.0 ⬍.001
Sex
Male 10 (11.6) 78 (70.9) ⬍.001
Female 76 (88.4) 32 (29.1)
Table 2: Venous stents: number of patients by initial and repeat procedures No. of Stent Procedures
per Patient
No. of Patients
Stent Procedures per Patient
No. of Stent Procedures
% Total Patients
New stent procedure 78 1 78 90.7%
1 Subsequent procedure 5 2 10 5.8%
2 Subsequent procedures 1 3 3 1.2%
3 Subsequent procedures 2 4 8 2.3%
[image:2.594.53.374.656.732.2]occurred during the initial shunting. The influence of these com-plication outliers on the mean is reflected in the even closer me-dian for each initial procedure at $9374 for venous stenting and $9535 for CSF shunting. The CSF shunting average costs for first procedures and revisions excluded infection, which was classified separately to evaluate its cost implications. This infection compo-nent was combined with other classification group average figures in the cost per 100 cases presented below.
Similarly, there was no significant difference between the av-erage cost of a subsequent venous stenting ($9421⫾69) and of a CSF shunt revision ($10,470⫾1245) (P⫽.4996), and there was no difference in the median cost, $9374 for venous stenting versus $9029 for CSF shunting.
With resource usage for venous stenting similar to that for CSF shunting, the average cost of each first and subsequent procedure was not significantly different. The lower average cost of subse-quent compared with new procedures is largely due to high-cost complications occurring in only new stent procedures, as well as high-cost shunt complications being separately categorized as in-fection cases, so there were no high-cost outliers increasing the average revision cost. The average costs for CSF shunting reported here are in line with previous data.8,9
Additional Stents versus Revised Shunts
The main cause of the cost difference between stenting and shunt-ing is the need for subsequent procedures: 79/143 (55.2%) for shunting but only 13/99 (13.1%) for stenting. While the average cost per procedure is similar, the proportional cost in terms of the total number of subsequent procedures is higher for shunting.
Infection
An important difference between shunts and stents is that stents do not get infected. Infection necessitated 24 shunt revisions (16.8%), often incurring the additional cost of removing and eventually replacing the shunt and all the associated costs of med-ical treatment to eradicate the infection. This is reflected in the higher average cost of treating an infected shunt ($84,729⫾ 59,939) rather than inserting a new shunt ($15,797⫾17,015) or
just revising a shunt ($10,470⫾5557), as well as in the longer average length of stay of 44 days, compared with 9 days for an initial shunt and 6 days for a revised shunt. Therefore, shunt in-fections are a major cost component; although they represent only 16.8% of cases, they account for 58.2% of the total cost, $2 million for the 3-year shunt group. Similar rates of shunt infection from 7.2%–15% and comparable 5-fold average cost increases in hospital charges have already been reported.9,10Previous research
has also shown that patients with adult PTC shunts similarly ex-perience complications in this range with a 9% shunt infection rate.11
Cost per 100 Procedures
To allow for the different study and follow-up periods of the shunted and stented patients and for the presence of infection, the average costs per procedure, both new and subsequent, are calcu-lated in terms of cost per 100 procedures (Table 4). These results reflect the high revision rate for CSF shunts, multiplied by the average procedure cost in each group, as well as the cost of man-aging infected CSF shunts.
In these terms, the cost per 100 cases is significantly higher for CSF shunting, almost double that for venous stenting (Fig 1). The reason for this is the higher proportion of CSF shunt revisions and the higher cost of shunt complications, not the average cost per procedure.
The cost per 100 cases, however, underestimates the true com-parable long-term cost of ongoing revisions. Because the stented group continued for 12 years, it is reasonable to view the absolute number of additional stentings as representative;⬎90% of pa-tients had just a single stenting, with a maximum 3 additional stentings in only 2 patients. The shunting study period by com-parison, covering only 3 years, was sufficient to provide an esti-mate of the average cost per revision but cannot provide an ade-quate follow-up period to verify the total number of shunt revisions needed by each patient.
[image:3.594.54.538.56.182.2]Thus, a literature review was undertaken to verify revision rates and, in particular, the total number of revisions per patient;
Table 3: Cost summary by procedure: stent versus shunt No. of Procedures
% of Total Procedures
Total Cost ($AUD)
% of Total Cost
Average Cost
($AUD) SD
Total LOS (Days)
Average LOS (Days) Transverse sinus stent
First transverse sinus stent 86 86.9% $1,192,219 90.7% $13,863 22,809 324 3.8
Subsequent transverse sinus stents 13 13.1% $122,468 9.3% $9421 114 15 1.2
Transverse sinus stent infection 0 0.0% – 0.0% – –
Grand total 99 100.0% $1,314,687 100.0% $13,280 21,296 339 3.4
CSF shunt
First CSF shunt 40 28.0% $631,888 18.1% $15,797 17,015 340 8.5
CSF shunt revision 79 55.2% $827,145 23.7% $10,470 5557 437 5.5
CSF shunt infection 24 16.8% $2,033,485 58.2% $84,729 141,948 1060 44.2
Grand total 143 100.0% $3,492,518 100.0% $24,423 64,062 1837 12.8
Note:—$AUD indicates Australian dollars; LOS, length of hospital stay.
Table 4: Transverse sinus stenting versus CSF shunting: average cost comparison per 100 cases
Procedure
Infection Rate
Average Cost per Infection
Average Cost of Infection
Average Cost of New (Non-Infected) Cases
Average Cost per Revision
Revision Rate
Average Cost of Revisions
Total Cost per 100 Procedures
Transverse sinus stent 0.0% 0 – $1,204,261 $9421 13.1% $123,705 $1,327,967
CSF shunta 16.8% $84,729 $1,422,017 $441,880 $10,470 55.2% $578,423 $2,442,320
Note:— – indicates no infection in TSS patients. a
[image:3.594.52.531.211.252.2]this indicated revision rates resulting from complications such as blockage and infection between 25% and 55%.12,13The pattern of
ongoing shunt complications has also been reported in adult PTC shunt groups, with similarly high revision rates of 51%– 63%.14,15
Furthermore, some “shunt-intolerant” patients can require
ⱖ10 ventriculoperitoneal shunt revisions and⬎30 lumboperito-neal shunt revisions.16As for the infection and revision rates,
previous research has also reported cases ofⱖ10 revisions per patient in adult PTC shunt groups.14 In contrast, the highest
number of stent procedures recorded for 1 patient was 4.1
Total Cost per Patient
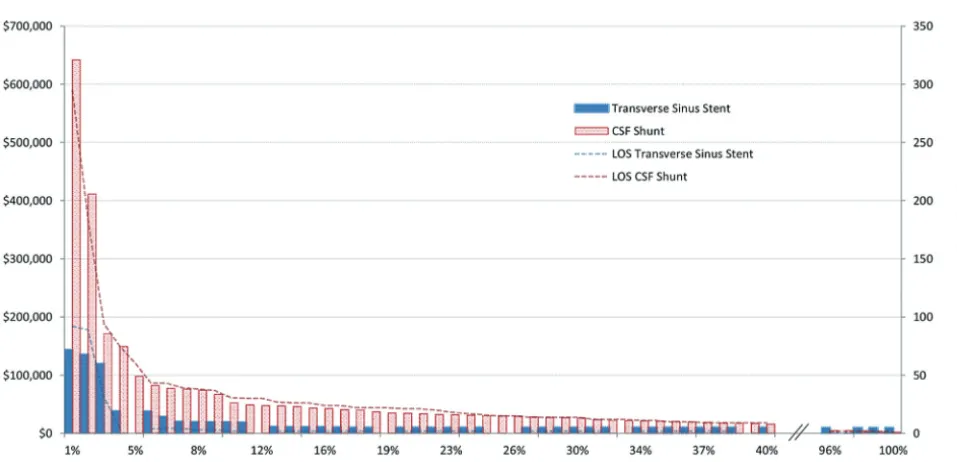
These results provide the average cost per procedure and sepa-rately indicate the revision and infection rates, which in turn de-termine the total cost per patient for each group. There are many more high-cost shunt patients than stent patients (Fig 2). The relative difference is in higher cost shunt patients overall and, in particular, the scale of costs required to manage the top 2% of patients with severe complications. Stent and shunt patients in the
lower 40% by cost have similar, single procedures with no infec-tion. Above 40%, the shunt patient costs increase consistently to the highest cost, 4%, around $100,000, 3-fold the comparable highest cost of stent patients. While both groups include extreme outliers in the highest cost 2% of patients, the scale of the shunted patients continues to be at least 3-fold higher than the stented patients, again reflecting the higher rates of infection and ongoing shunt revisions. Length-of-stay figures are also presented for each percentile group.
Complications
Complications after stenting included headache, transient hear-ing loss, and allergic reactions to aspirin or clopidogrel and, in one case, an anaphylactic reaction to the anesthetic. Apart from these cases, there were 3 patients from the total of 86 in the transverse sinus stent group (3.5%) who had major neurologic complica-tions during stenting, largely vein perforation causing subdural, subarachnoid, or intracerebral bleeding. All 3 patients made a full recovery; 2 needed an urgent craniotomy for evacuation of a hematoma.
From a resource use and cost perspective, the 3 severe-complication cases required extended inpatient stays and ongo-ing rehabilitation. From a cost perspective, these patients are ex-treme outliers with a total individual cost of $119,468, $135,440, and $143,272. In comparison, severe complications for the 3 high-est cost shunt patients resulted in individual patient costs of $170,850, $411,619, and $641,824.
Total Revisions per Patient
To explore the potential cost implications of subsequent proce-dures, especially shunt revisions, a series of scenarios were devel-oped on the basis of average costs from the 2 datasets supported by evidence from previous studies.9,10These provided
cross-vali-dated estimates of the average cost of initial stenting or shunting, as well as of subsequent procedures, infection risk, and associated
FIG 1. Stent versus shunt. Cost comparison per 100 procedures. Graph shows the average cost per 100 procedures of transverse sinus stenting versus CSF shunting. The total cost is shown, plus an individ-ual breakdown of costs based on revision and infection rates of each group.
[image:4.594.54.287.282.408.2] [image:4.594.54.533.473.704.2]average infection cost. These scenarios are consistent with studies of adult patients with PTC shunts, as referenced in previous sec-tions, which have shown infection and revision rates and the total number of shunt revisions per patient to be similar to those of our pediatric study group.
These findings then support a series of scenarios based on the total number of additional procedures per patient as presented in Fig 3. The maximum number of subsequent stentings in the 12-year group was 3, and additional stenting beyond 5 have not been reported, so 5 is considered the maximum upper limit. In this context, the first scenario illustrates the relative comparison of 5 subsequent stentings and 5 subsequent shunt revisions, with the slightly higher total cost of shunting due to the additional cost of managing infections.
Additional scenarios were prepared to investigate a reduced infection rate for CSF shunting with use of antibiotic-impreg-nated shunts, which included infection rates below those reported in previous adult study groups.17
In the scenarios of 8 and then 10 revisions, shown only for shunts, the trend is further established. While 10 revisions are presented as an extreme scenario, there have been reports of adult patients with PTC needing even more, which extends the increas-ing cost trend for patients with higher revision shunts.14,18
Previous modeling suggests that the cost of shunting in pedi-atric hydrocephalus is more sensitive to the revision rate, partic-ularly in the first year after shunting, than to the decreased infection rate or length of hospital stay.19Also long-term
investi-gations of shunted children have confirmed that 81% need at least 1 revision and often several, requiring repeated procedures and hospitalizations.13
The shunt infection column bars in Fig 3 report the shunt infection rate of the study group (16.8%), which is shown against 2 reduced-infection-rate sensitivity scenarios of 10% and 5%. These scenarios indicate that even with an infection rate of only 5%, a patient receiving 10 shunt revisions is estimated to cost $196,771, almost a 4-fold increase in the highest cost of inserting
5 additional stents. Despite reported examples of reduced shunt infection rates, rates of 10% still occur even with antibiotic-im-pregnated shunts.20As described previously, adult patient groups
with PTC shunts have been reported as having a similar 9% infec-tion rate. Here, the estimated cost of $239,136 is close to 5-fold the highest cost for a stented patient. In all scenarios with⬎5 subse-quent procedures, an increasing upward cost trend resulted for shunts, in line with the number of procedures, shown as the dot-ted triangle in Fig 3.
In summary, the average cost per 100 patients, the total cost per patient, and the skewed upside risk of additional costs through ongoing shunt revisions and infections show stenting costing less than shunting, while nonetheless providing patients with PTC with effective long-term treatment.
DISCUSSION
In the first part of this study, we calculated the average cost of venous stenting and CSF shunting and found no significant dif-ference between the 2, either as initial or subsequent procedures. This finding reflects similar resource use, operating theater time, and medical-surgical team composition for each procedure and provides the underlying base-cost component to the calculation of total cost per patient. The main cause for the cost difference between stenting and shunting is, therefore, not the difference in average cost for each routine procedure but problems and com-plications with CSF shunting, leading to a high revision rate, up to 30% for ventriculoperitoneal shunts and 60% for lumboperito-neal shunts and an infection rate of 5%–15%. These cost drivers are consistent with similar shunt revision and infection rates pre-viously reported in adult PTC study groups.21
It follows that ongoing additional stents and shunt revisions are simple multiples of the average cost; the key difference be-tween stenting and shunting is that shunts not only need frequent revisions, they also can become infected and this outcome results in higher total costs. The analysis scenarios in this study have taken the conservative case of 10 revisions for shunts, though even
[image:5.594.54.532.46.243.2]more can occur in both pediatric and adult PTC cases.19There
remains, therefore, an unbounded upside risk for a few shunt-intolerant patients, which will potentially add substantially to to-tal cost per patient.
Venous stenting, by comparison, has been shown to require significantly fewer repeat procedures, with⬎90% of patients suc-cessfully receiving just a single stent. Also, the need for additional venous stenting, while low, has been further lowered with time, due to a better understanding of the mechanism by which stents lower intracranial pressure and the availability of longer stents. We have proposed1that stenting prevents compression of the
transverse sinuses by intracranial hypertension itself, breaking a positive feedback cycle. A stent creates a rigid, noncollapsible transverse sinus, one no longer vulnerable to compression from intracranial hypertension so that CSF absorption is improved, lowering intracranial pressure. With time, longer stents have been inserted so that fewer extrinsic stenoses develop at the distal end of the stent, reducing the need for second or third stenting proce-dures. In some cases, the entire transverse sinus has been stented.1
Given this significant difference in the repeat rates of the 2 procedures, the cost per 100 cases does not represent the total longer term cost per patient of ongoing revisions. Because the venous stent group was followed up to 12 years, it is reasonable to view the absolute number of repeat procedures as representative. During the 12 years of data,⬎90% of patients received only a single stent, with a maximum of 3 revisions in 2 cases. The shunt study period by comparison, covering 3 years, is sufficient to pro-vide an estimate of average cost per revision but cannot propro-vide an adequate follow-up period to verify the lifetime total number of shunt revisions per patient.
Revision rates resulting from shunt complications, such as blockage and infection, range from 25% to 50% or more, suggest-ing that the long-term costs of CSF shuntsuggest-ing could be even higher than we found here.13
In addition to high-cost cases of ongoing revisions, infection is also an important factor in the overall higher total cost per shunt patient. A few infected shunts result in a disproportionately high shunting cost increase, typically 4- to 5-fold higher than a nonin-fected case. In our shunt group, the 16.8% of infections accounted for 58.2% of total cost, over $2 million.
The rate and costs of infection are being reduced with the wider use of antimicrobial impregnated sutures, shunts, and cath-eters to below 5% in some cases, though this level of reduction would depend on using impregnated devices in all shunt proce-dures, and there is some reluctance to use them because of their increased cost.22,23
Given the variation in shunt infection rates and potentially reduced rates resulting from the more widespread use of antibi-otic-impregnated shunt components, our scenario analyses in-cluded reduced infection rates of 10% and 5%, to investigate the impact on total cost. The scenarios demonstrate that reduced rates of infection, while reducing the magnitude of the cost differ-ence, nonetheless confirm the substantially lower cost of venous stenting in all cases. Because the infection component has been isolated and analyzed separately, even if infection cases were re-duced to zero, venous stenting would still cost substantially less than CSF shunting.
The benefit of venous stenting in PTC is now clear,1-3and a
lower complication rate (9.3% of patients in our own study) com-pared with shunting has been reported in all studies. We have now shown that the cost of stenting is also significantly less than that of shunting. Finding a therapeutically effective and cost-effective treatment for PTC is of growing importance, given the increasing cost of PTC and the growing rates of obesity.4
Study Limitations
Our study has 1 noteworthy limitation: Our CSF shunting group was composed of pediatric patients with hydrocephalus, and it is often suggested that the complications of shunting are more com-mon in pediatric than in adult patients. The ideal comparison group would have been adult shunted patients with PTC. Unfor-tunately these data were not available because new adult patients at our institution, and in fact in our state, who have PTC with venous stenosis have been so rarely shunted since stenting became available. Therefore, we decided to choose as a comparison group to our stented patients a group of pediatric patients from a pro-spective registry of cases kept at the Westmead Children’s Hospi-tal. To balance this limitation, we reviewed the literature on com-plications of shunting for adult PTC and verified that the key cost drivers of infection and revision rates and the total number of revisions per patient have been reported at levels similar to those in our pediatric hydrocephalus study group.
In this context, we are confident that our work is valid and adds significantly to the debate on the role of stenting versus shunting in the treatment of venogenic PTC.
The study is also limited by its retrospective nature, and ideally a prospective study comparing the cost of stenting versus shunt-ing is needed in a group of adult patients with PTC.
CONCLUSIONS
In treating PTC, transverse sinus stenting costs less than CSF shunting in the long term, not because of the average cost of the procedure itself but as a result of a relatively lower revision rate, fewer total revisions per patient, and no infections to date.
REFERENCES
1. Ahmed RM, Wilkinson M, Parker GD, et al.Transverse sinus stent-ing for idiopathic intracranial hypertension: a review of 52 patients and of model predictions.AJNR Am J Neuroradiol2011;32:1408 –14 2. Kumpe DA, Bennett JL, Seinfeld J, et al.Dural sinus stent placement for idiopathic intracranial hypertension. J Neurosurg 2012;116: 538 – 48
3. Radvany MG, Solomon D, Nijjar S, et al.Visual and neurological outcomes following endovascular stenting for pseudotumor cere-bri associated with transverse sinus stenosis.J Neuroophthalmol
2013;33:117–22
4. Friesner D, Rosenman R, Lobb BM, et al.Idiopathic intracranial hypertension in the USA: the role of obesity in establishing preva-lence and healthcare costs.Obes Rev2011;12:e372– 80
5. Simon TD, Riva-Cambrin J, Srivastava R, et al.Hospital care for children with hydrocephalus in the United States: utilization, charges, comorbidities, and deaths.J Neurosurg Pediatr 2008;1: 131–37
Australian Government, Department of Health and Aging, Canberra, Australia, December 2009
7. Australian Institute of Health and Welfare 2012.Health Expenditure Australia 2010 –11: Health and Welfare Expenditure Series No. 47.Cat. No. HWE 56. Canberra, Australia: Australian Institute of Health and Welfare, 2012
8. Pham AC, Fan C, Owler BK.Treating pediatric hydrocephalus in Australia: a 3-year hospital-based cost analysis and comparison with other studies.JNeurosurg Pediatr2013;11:398 – 401
9. Stone J, Gruber TJ, Rozzelle CJ.Healthcare savings associated with reduced infection rates using antimicrobial suture wound closure for cerebrospinal fluid shunt procedures.Pediatr Neurosurg2010; 46:19 –24
10. Patwardhan RV, Nanda A. Implanted ventricular shunts in the United States: the billion-dollar-a-year cost of hydrocephalus treat-ment.Neurosurgery2005;56:139 – 44, discussion 144 – 45
11. El-Saadany WF, Farhoud A, Zidan I.Lumboperitoneal shunt for idiopathic intracranial hypertension: patients’ selection and out-come.Neurosurg Rev2012;35:239 – 43, discussion 243– 44
12. Del Bigio MR. Epidemiology and direct economic impact of hydrocephalus: a community based study. Can J Neurol Sci
1998;25:123–26
13. Appelgren T, Zetterstrand S, Elfversson J, et al.Long-term outcome after treatment of hydrocephalus in children.Pediatr Neurosurg
2010;46:221–26
14. Sinclair AJ, Kuruvath S, Sen D, et al.Is cerebrospinal fluid shunting in idiopathic intracranial hypertension worthwhile? A 10-year re-view.Cephalalgia2011;31:1627–33
15. Tarnaris A, Toma AK, Watkins LD, et al.Is there a difference in
outcomes of patients with idiopathic intracranial hypertension with the choice of cerebrospinal fluid diversion site: a single centre experience.Clin Neurol Neurosurg2011;113:477–79
16. Wang VY, Barbaro NM, Lawton MT, et al.:Complications of lum-boperitoneal shunts. Neurosurgery 2007;60:1045– 48, discussion 1049
17. Attenello FJ, Garces-Ambrossi GL, Zaidi HA, et al.Hospital costs associated with shunt infections in patients receiving antibiotic-impregnated shunt catheters versus standard shunt catheters. Neu-rosurgery2010;66:284 – 89, discussion 289
18. Burgett RA, Purvin VA, Kawasaki A.Lumboperitoneal shunting for pseudotumor cerebri.Neurology1997;49:734 –39
19. Cochrane D, Kestle J, Steinbok P, et al.Model for the cost analysis of shunted hydrocephalic children.Pediatr Neurosurg1995;23:14 –19 20. Farber SH, Parker SL, Adogwa O, et al.Cost analysis of
antibiotic-impregnated catheters in the treatment of hydrocephalus in adult patients.World Neurosurg2010;74:528 –31
21. Abubaker K, Ali Z, Raza K, et al.Idiopathic intracranial hypertension: lumboperitoneal shunts versus ventriculoperitoneal shunts: case series and literature review.Br J Neurosurg2011;25:94 –99 22. Rozzelle CJ, Leonardo J, Li V.Antimicrobial suture wound closure
for cerebrospinal fluid shunt surgery: a prospective, double-blinded, randomized controlled trial.J Neurosurg Pediatr2008;2: 111–17
23. Sciubba DM, Lin LM, Woodworth GF, et al.Factors contributing to the medical costs of cerebrospinal fluid shunt infection treatment in pediatric patients with standard shunt components compared with those in patients with antibiotic impregnated components.