http://www.scirp.org/journal/ojacct ISSN Online: 2169-3412
ISSN Print: 2169-3404
DOI: 10.4236/ojacct.2018.72008 Mar. 1, 2018 107 Open Journal of Accounting
Chairman’s Cultural Background
Characteristics and Audit Fees: Based on
Chinese Listed Companies
Xuanqi Hu
Accounting Department, Management School, Jinan University, Guangzhou, China
Abstract
Based on the panel data of Chinese listed companies spanning the period 1999-2015, this paper investigates the effects of Chairman’s cultural back-ground characteristics on audit fees. The results show that Chairman’s cultur-al background characteristics significantly affect the company’s audit fees, the Chairman with the nomadic culture background compared with who with cultivation culture background tends to pay lower audit fees, and the rela-tionship above is enhanced when the company’s Chairman and CEO is the same person. Furthermore, this paper finds that the bigger the board size, or the longer the Chairman’s tenure, the lower the audit fees the company whose Chairman has the nomadic culture background will pay.
Keywords
Cultural Background Characteristics, Audit Fees, Chairman and CEO Duality, Board size, Tenure
1. Introduction
The audit fees depend on the outcome of the final negotiation between the audit service provider and the company, which is subject to the bargaining power of both parties. The senior echelon theory believes that the executive characteristics influence the company’s choice of strategy, which further affect the company’s other behaviors (Hambrick and Mason, 1984) [1], and a large number of empir-ical researches such as Malmendier and Tate (2005) [2] have proved the conclu-sion. Therefore, the Chairman, leader of the company’s senior executives, as one side of the negotiators, his or her background characteristics are also likely to af-fect company’s financial decisions, such as auditing fees. Previous researches How to cite this paper: Hu, X.Q. (2018)
Chairman’s Cultural Background Charac-teristics and Audit Fees: Based on Chinese Listed Companies. Open Journal of Ac-counting, 7, 107-124.
https://doi.org/10.4236/ojacct.2018.72008
Received: January 15, 2018 Accepted: February 26, 2018 Published: March 1, 2018
Copyright © 2018 by author and Scientific Research Publishing Inc. This work is licensed under the Creative Commons Attribution-NonCommercial International License (CC BY NC 4.0). http://creativecommons.org/licenses/by-nc/4.0/
DOI: 10.4236/ojacct.2018.72008 108 Open Journal of Accounting studying the relationship between CEO background characteristics and audit fees, however, nearly work from company executives’ features such as age, gender, tenure and the heterogeneity of these (Chen jiaojiao and Zhou Fangzhu, 2016) [3], there are few literatures research how Chairman’s cultural background characteristics affect audit fees. Although there exist literatures discuss the in-fluence of culture on the company’s financial decision-making, corporate go-vernance etc., these multinational studies are hard to control factors such as na-tional accounting standard, taxation system and bankruptcy legislation and law enforcement, the conclusions are also not stable.
After Simunic (1980) [4], the researchers have studied the influence of ac-counting firms, companies and business characteristics, the characteristics of specific objective environment and audit contract on audit fees, but the related researches are established on the assumption of the rational hypothesis of people, especially CEO and Chairman. While, psychology studies suggested that people were not completely rational. Researches have shown that senior execu-tives or the Chairman of different ages, genders and tenures may have significant differences in risk appetite and risk-taking (Bertrand and Schoar, 2003) [5], thus affecting corporate behavior. Culture, like age or tenure, can also affects the risk appetite and risk-taking of the Chairman and affect corporate behaviors further. Culture, on the one side, is gradually implanted into people’s thinking in the early socialization process, stimulates and adjusts people’s actions and choices to make them conform to certain social values, on the other hand, forms the sub-jective psychological structure of people to explain the problem by influencing the way people deal with information (North, 1990) [6], which means that the individual’s perception of the same information varies from the type of culture in which the people live. A large number of empirical studies have shown that culture significantly affects company decision making, such as Sekely and Col-lins (1988) [7]. Aggarwal and Goodell (2009) also pointed out that the effective-ness of contract fulfillment and transaction cost would not only be influenced by formal constraint mechanism, but also be influenced by national culture [8]. North (1990) found that the influence of the informal constraint mechanism on corporate behaviors may be far beyond the formal constraint mechanism [6], in fact, people in different countries are very different in their living habits, cus-toms, mental state and thinking structure. Since culture can affect executive and Chairman’s decisions and influence corporate behavior further, how does the company’s Chairman’s cultural background characteristics affect the company’s audit fees?
DOI: 10.4236/ojacct.2018.72008 109 Open Journal of Accounting size, the longer the Chairman’s tenure, the lower the audit fees paid by the com-pany whose Chairman has the nomadic culture back-ground.
The main innovation of this paper is providing a new perspective to explain how audit fees are formed. The existing researches only suggest that the follow-ing aspects may affect audit fees. 1) The characteristics of company, includfollow-ing the size, debt ratio, return on assets, inventory to total assets ratio, loss, listing years, Ownership. 2) The characteristics of auditor’s office, including auditor reputation, audit tenure, audit opinion. 3) Personal characteristics of Chairman and CEO, including Chairman and CEO’s age, tenure, etc. Yet, there don’t exit discussions about how culture affect audit fees through the Chairman, this pa-per’s results show that culture do affect the behavior of company as well as audit fees, and the mechanism is that culture can affect the risk preference of the Chairman and affect the audit fees further. In addition, this paper is one of the earliest literatures in China to study the relationship between culture and com-pany behaviors, which, of course, can expand the literatures in the field of cul-ture and finance.
2. Theoretical Analysis and Research Hypothesis
One of the ways in which culture affects corporate decision-making is to influ-ence Chairman’s behavior and cognition and then to influinflu-ence corporate deci-sion-making. Studies have showed that individual decisions under different cul-tures have systematic differences (Ji et al., 2001) [9]. For example, Ferris et al. (2013) [10] and Kanagaretnam et al. (2014) [11] believe that because executives under different cultures have different risk preference and risk taking, they will choose different acquisition strategies and accounting conservatism. Similarly, culture and mergers and acquisitions, cash holdings, capital structure and enter-prise innovation are also closely related. Therefore, culture affects the risk atti-tude and risk taking of company executives and Chairman, and then affects the company’s audit fees. He weifeng and Liu Wei (2015) [12] believes that the en-terprise managers have heterogeneity, the ability to build control environment and risk control varies from person to person, so the heterogeneity of managers will have an impact on audit fees. Chen Jiaojiao and Zhou Fangzhu (2016) [3]
also find that managers’ personal background characteristics have a significant impact on audit fees.
DOI: 10.4236/ojacct.2018.72008 110 Open Journal of Accounting grazing and hunting, even go to wars owning to plundering materials and prop-erties, power struggles between the tribes, etc. The cruelty of the natural envi-ronment, the unique way of life, and the continuous wars make the life of the nomadic people full of risk, as a result, the nomadic nations are more able to take risks and more of risk awareness. While, people in farming areas have cul-tivated land, unless there are large natural disasters and social unrest, they are generally able to be self-sufficient and live in peace and happiness. Therefore, people living in nomadic areas tend to take more risk than people in farming areas (Næss, 2003) [13], which led to the people in nomadic areas be more will-ing to take risks, but also more risk awareness (Zhang Yuan, 2014) [14]. So, Chairman with nomadic culture background tend to make higher risk decisions, or underestimate the potential risks of internal control deficiencies, and thus paying lower audit fees. Based on the above analysis, the hypothesis 1 is pro-posed.
Hypothesis 1: Chairman with nomadic cultural background will pay lower audit fees than Chairman with farming culture background.
DOI: 10.4236/ojacct.2018.72008 111 Open Journal of Accounting CEO duality reduced the demand for high-quality audit services, and further reduced audit fees. Based on the above analysis, the hypothesis 2 is proposed.
The hypothesis 2: Chairman and CEO duality will strengthen the negative relationship between the Chairman’s nomadic culture background and the audit fees.
The effectiveness of the board directly determines the extent of the board’s function, and the size of the board is one of the important factors that affect the effectiveness of the board. Jensen (1993) [20] put forward that maintaining a smaller board size is conducive to the function of the board and further improv-ing corporate performance, and the greater the size of the board, the more its power may be manipulated. The Company Law of China stipulates that the chairman has the right to convene and preside the shareholders’ meeting and board meeting, and in practice, the board of directors entrusts a lot of authority to the board of directors, therefore, in many enterprises, especially the state-owned enterprises, the Chairman is often the center of power. Oversized board of directors will cause board dysfunction and ultimately lead to the Chairman’s manipulation of the board. The main reasons can be summed up as follows. First, when the board size is too large, the disagreement between direc-tors is not easy to be unified, and the decision-making power of a single director is weakened, then the Chairman’s personal suggestion has greater influence on the decisions of the board of directors (Albuquerque et al., 2007; Morse et al., 2011) [21][22]. Second, large scale of board may cause the “free ride” behavior. When the board of directors is dysfunctional and then loses its own deci-sion-making role, it can’t form an effective balance with the Chairman’s indi-vidual behavior. Therefore, in the larger board of directors, the collective non-feasance of other members of the board will strengthen the authority and influ-ence of the Chairman, so that the influinflu-ence of the Chairman’s personal cultural characteristics on corporate behavior will also be more obvious. Cronqvist (2012) [23] shows that the lower the board efficiency, the relationship between the personal characteristics of CEO and the financial leverage of the enterprise is more significant. Based on the above analysis, the hypothesis 3 is proposed.
Hypothesis 3: the negative relationship between the nomadic cultural background of the Chairman and the audit fees will be enhanced in the larger scale of the board.
re-DOI: 10.4236/ojacct.2018.72008 112 Open Journal of Accounting lationship between the Chairman’s nomadic cultural background and audit fees will be strengthened. Based on the above analysis, the hypothesis 4 is proposed.
Hypothesis 4: the longer the Chairman’s tenure is, the more negative the relationship between the chairman’s nomadic cultural background and the audit fees.
3. Research Design
This is an empirical research, in which we use the regression model based on the least square method and data to test the 4 hypotheses suggested above. The em-pirical model and its variables introduced in detail in Section 3.2 and 3.3 of the paperare based on the exiting literatures about audit fees and have been well ve-rified, and the data this paper uses are coming from databases and websites of finance and economics which are introduced in Section 3.1. To run the regres-sion model and do the data analysis, this paper uses Stata as the software tool. Next, this paper will introduce the data sources and data filtering, variables defi-nition, empirical model and the descriptive statistics of the data.
3.1. Data Sources and Data Filtering
DOI: 10.4236/ojacct.2018.72008 113 Open Journal of Accounting
3.2. Variables Definition
This paper’s explained variable is audit fees. On the basis of the existing litera-ture, such as Xing Liquan and Chen Hanwen (2013) [26], etc., this paper takes the logarithm of the company’s actual audit fees, then takes it into the model re-gression, the explanatory variable is culture (the value of 1 represents the no-madic culture). Referring to the domestic scholars, such as Wu Bihu (1996) [27], this paper divides China into farming culture areas and the nomadic cultural areas according to 400 millimeters precipitation line and Hu Huanyong popula-tion distribupopula-tion line, so this paper takes Tibet, Qinghai, Xinjiang, Gansu, Ning-xia and Inner Mongolia as nomadic culture areas, and the rest as farming culture areas.
According to the research of Simunic (1980) [4], Zhang Tianshu and Huang Jun (2013) [28], this paper controls following variables: 1) The company charac-teristic variables, including size (Size), debt ratio (Debt), return on assets (Roa), inventory to total assets ratio (Casset), loss (Loss), listed years (Listyear), own-ership (Ownsh). 2) Characteristics of auditor variables, including auditor repu-tation (Big 4/Big 5), audit tenure (Autenure), audit opinion (Autype). 3) Person-al characteristics of Chairman, including Chairman’s age (Age) and tenure (Te-nure). 4) Other controlling variables, such as year (Year) and industry (Ind). Specific details are shown in Table 1. Especially, this paper deal with audit fees, corporate size, listing time, age and tenure of Chairman by natural logarithm to narrow the heteroscedasticity of the sample.
3.3. Empirical Model
We use the following regression model to test the hypothesis 1 to hypothesis 4.
(
)
0 1 2 3 4 5 6
7 8 9 10
30 40
11 12 13
14 31
Culture Ownsh Debt Roa Size Csset
Loss Listyear or
A
Big4 big5
ge Tenu
Autenure
Autype re Year
it it it it it it it
it it it it it
it it it it
Fee
Ind
β β β β β β β
β β β β
β β β ε
= + + + + + +
+ + + +
+ + + +
∑
+∑
+(1)
In the regression model, β0 represents the constant, β1 − β40 represent the
coef-ficients of Culture, and εit represents the residual.
3.4. Descriptive Statistical Analysis
DOI: 10.4236/ojacct.2018.72008 114 Open Journal of Accounting
Table 1. Variables definition.
Variables Definition
Dependent variable
Fee Natural log of year-end audit fees Independent variable
Culture If Chairman belongs to nomadic culture areas, 1, otherwise, 0 Control variables
Duality If Chairman and CEO is the same person, 1, otherwise, 0 Ownsh (ownersh) If corporate belongs to state-owned business, 1, otherwise, 0
Debt Year-end long-term debt/year-end total asset
Roa Net income/year-end total asset
Size Natural log of year-end total asset Casset Year-end inventory/year-end total asset
Loss If net income less than 0, 1, otherwise, 1 Listyear Natural log of listing time
Big 4/big 5 If accounting firm is big 4 or big 5, 1, otherwise, 0 Autenure The duration of continuous audit of the accounting firm
Autype If audit opinion is standard audit opinion, 1, otherwise, 0
Age Natural log of Chairman’s age
Tenure Natural log of Chairman’s tenure
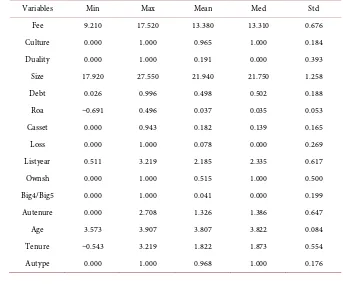
Table 2. Descriptive statistical analysis.
Variables Min Max Mean Med Std
Fee 9.210 17.520 13.380 13.310 0.676
Culture 0.000 1.000 0.965 1.000 0.184
Duality 0.000 1.000 0.191 0.000 0.393
Size 17.920 27.550 21.940 21.750 1.258
Debt 0.026 0.996 0.498 0.502 0.188
Roa −0.691 0.496 0.037 0.035 0.053
Casset 0.000 0.943 0.182 0.139 0.165
Loss 0.000 1.000 0.078 0.000 0.269
Listyear 0.511 3.219 2.185 2.335 0.617
Ownsh 0.000 1.000 0.515 1.000 0.500
Big4/Big5 0.000 1.000 0.041 0.000 0.199
Autenure 0.000 2.708 1.326 1.386 0.647
Age 3.573 3.907 3.807 3.822 0.084
Tenure −0.543 3.219 1.822 1.873 0.554
[image:8.595.197.540.448.734.2]DOI: 10.4236/ojacct.2018.72008 115 Open Journal of Accounting control variables, such as company profitability and debt ratio, are similar to the statistical results of existing studies. For example, the asset liability ratio is 49.8%, close to 50%, and the total assets earnings rate is 3.75%, which indicates that the statistical results of the sample are reliable.
4. Empirical Results and Analysis
4.1. Empirical Tests for H1 to H4
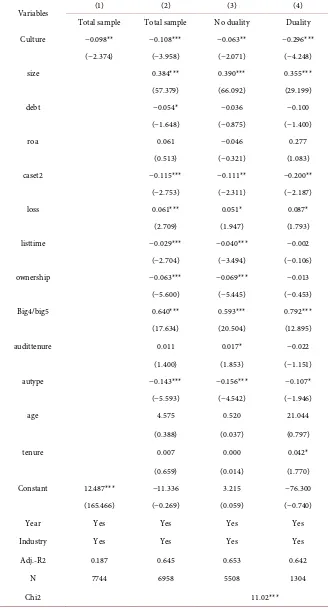
In Table 3, column (1) and column (2) are the results of regression of the audit fees to the cultural background, respectively. The results show that in the two regressions, both of the coefficients of Culture are negative(the Culture’s coeffi-cient is −0.098 in column (1) and −0.108 in column (2), and are significant at the level of 1%, the adjusted R2 reaches 18.7% and 64.5%, respectively, which means
that the model has a good fitting results. The results are similar to those of Zhang Yuan et al. (2014) [14]. By studying the relationship between culture and M&A, Zhang Yuan found that executives with nomadic culture background had more motivation of M&A, which is similar to the characteristics of nomadic people’s favor in expanding territory abroad [14]. The results above show that the Chairman of nomadic culture background tends to pay lower audit fees than the chairman with a farming culture background, so the hypothesis 1 is verified. Column (3) and column (4) show the results of the group where there don’t exist Chairman and CEO duality and the group where there exist Chairman and CEO duality. β1, the coefficient of Culturein column (3) is −0.063, significant at the
level of 5%, and −0.296 in column (4), which is significant at the level of 1%. β1
in column (4) is smaller than in that in column (3), and Chi2 of Chow test is
11.2, significant at the level of 1%.
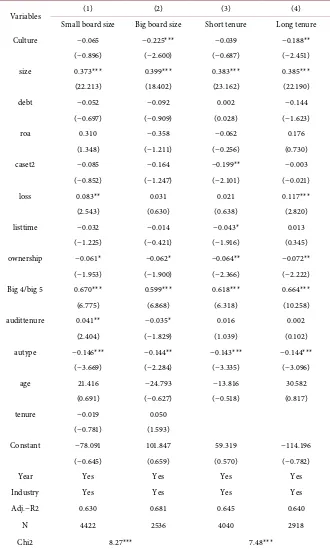
Table 4 shows the results of hypothesis 3 and hypothesis 4. Column (1) and column (2) show the results of small board size group and big board size group, respectively. For the small board size group, the coefficient of Culture is −0.065, significant at the level of 10%, for the big board size group, the culture’s coeffi-cient is −0.225 and significant at the level of 1%. The coefficoeffi-cient of culture for the big board size group is smaller than that of the small board size group and the difference of the two coefficients is significant at the level of 1%, the Chi2 is
8.27. Column (3) and column (4) show the results of short tenure group and long tenure group, respectively. For the short tenure group, the coefficient of Culture is −0.039, but not significant, for the long tenure group, the culture’s coefficient is −0.188 and significant at the level of 1%. The coefficient of culture for the long tenure group is smaller than that of the short tenure group and the difference of the two coefficients is significant at the level of 1%, the Chi2 is 7.48.
DOI: 10.4236/ojacct.2018.72008 116 Open Journal of Accounting
Table 3. Empirical results of hypothesis 1 and hypothesis 2.
Variables (1) (2) (3) (4)
Total sample Total sample No duality Duality Culture −0.098** −0.108*** −0.063** −0.296***
(−2.374) (−3.958) (−2.071) (−4.248)
size 0.384*** 0.390*** 0.355***
(57.379) (66.092) (29.199)
debt −0.054* −0.036 −0.100
(−1.648) (−0.875) (−1.400)
roa 0.061 −0.046 0.277
(0.513) (−0.321) (1.083)
caset2 −0.115*** −0.111** −0.200**
(−2.753) (−2.311) (−2.187)
loss 0.061*** 0.051* 0.087*
(2.709) (1.947) (1.793)
listtime −0.029*** −0.040*** −0.002
(−2.704) (−3.494) (−0.106)
ownership −0.063*** −0.069*** −0.013
(−5.600) (−5.445) (−0.453)
Big4/big5 0.640*** 0.593*** 0.792***
(17.634) (20.504) (12.895)
audittenure 0.011 0.017* −0.022
(1.400) (1.853) (−1.151)
autype −0.143*** −0.156*** −0.107*
(−5.593) (−4.542) (−1.946)
age 4.575 0.520 21.044
(0.388) (0.037) (0.797)
tenure 0.007 0.000 0.042*
(0.659) (0.014) (1.770)
Constant 12.487*** −11.336 3.215 −76.300
(165.466) (−0.269) (0.059) (−0.740)
Year Yes Yes Yes Yes
Industry Yes Yes Yes Yes
Adj.-R2 0.187 0.645 0.653 0.642
N 7744 6958 5508 1304
Chi2 11.02***
DOI: 10.4236/ojacct.2018.72008 117 Open Journal of Accounting
Table 4. Empirical results of hypothesis 3 and hypothesis 4.
Variables (1) (2) (3) (4)
Small board size Big board size Short tenure Long tenure
Culture −0.065* −0.225*** −0.039 −0.188***
(−1.882) (−4.894) (−1.007) (−4.981)
size 0.373*** 0.399*** 0.383*** 0.385***
(56.600) (44.287) (53.767) (49.113)
debt −0.052 −0.092 0.002 −0.144***
(−1.201) (−1.539) (0.043) (−2.684)
roa 0.310** −0.358* −0.062 0.176
(2.012) (−1.744) (−0.354) (1.021)
caset2 −0.085* −0.164** −0.199*** −0.003
(−1.698) (−2.088) (−3.439) (−0.043)
loss 0.083*** 0.031 0.021 0.117***
(2.841) (0.832) (0.674) (3.513)
listtime −0.032*** −0.014 −0.043*** 0.013
(−2.620) (−0.808) (−3.488) (0.648)
ownership −0.061*** −0.062*** −0.064*** −0.072*** (−4.291) (−3.213) (−4.016) (−4.402)
Big4/big5 0.670*** 0.599*** 0.618*** 0.664***
(18.874) (15.379) (17.078) (17.968)
audittenure 0.041*** −0.035** 0.016 0.002
(3.939) (−2.566) (1.491) (0.156)
autype −0.146*** −0.144*** −0.143*** −0.144*** (−3.989) (−2.969) (−3.781) (−3.175)
age 21.416 −24.793 −13.816 30.582
(1.398) (−1.199) (−0.851) (1.623)
tenure −0.019 0.050***
(−1.472) (2.885)
Constant −78.091 101.847 59.319 −114.196
(−1.306) (1.262) (0.936) (−1.553)
Year Yes Yes Yes Yes
Industry Yes Yes Yes Yes
Adj.−R2 0.630 0.681 0.645 0.640
N 4422 2536 4040 2918
Chi2 8.27*** 7.48***
Notes: Significance level at: *10, **5 and ***1 percent; numbers in parenthesis are t-statistics for t tests, Chi2-statistics for Chow tests.
behavior, so the negative relationship between the chairman’s nomadic cultural background and the audit fees is enhanced.
4.2. Robust Tests
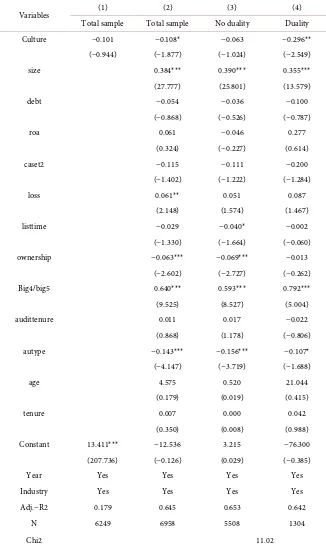
Considering the endogeneity of audit fees, the paper use one-year lagged audit fees to substitute audit fees of current period and do the robust tests, Table 5
DOI: 10.4236/ojacct.2018.72008 118 Open Journal of Accounting
Table 5. Robust tests results of H1-H2 by using lagged audit fees as independent variable.
Variables (1) (2) (3) (4)
Total sample Total sample No duality Duality Culture −0.101** −0.128*** −0.090*** −0.334***
(−2.234) (−4.041) (−2.673) (−3.927)
size 0.373*** 0.377*** 0.357***
(49.301) (56.390) (24.454)
debt −0.095** −0.062 −0.218**
(−2.421) (−1.301) (−2.456)
roa −0.139 −0.274* 0.213
(−1.059) (−1.667) (0.683)
caset 2 −0.104** −0.093* −0.269**
(−2.216) (−1.743) (−2.391)
loss 0.060** 0.047 0.113*
(2.380) (1.594) (1.889)
listtime −0.003 −0.018 0.055*
(−0.195) (−1.229) (1.937)
ownership −0.043*** −0.045*** −0.008
(−3.426) (−3.185) (−0.232)
Big 4/big 5 0.607*** 0.569*** 0.751***
(14.324) (17.377) (10.092)
audittenure 0.001 0.005 −0.025
(0.098) (0.431) (−1.096)
autype −0.130*** −0.142*** −0.067
(−4.591) (−3.510) (−0.993)
age 17.135 12.796 41.755
(1.234) (0.798) (1.281)
tenure 0.004 0.007 0.007
(0.282) (0.503) (0.214)
Constant 13.411*** −61.441 −44.564 −157.340
(355.596) (−1.134) (−0.712) (−1.236)
Year Yes Yes Yes Yes
Industry Yes Yes Yes Yes
Adj.−R2 0.179 0.622 0.630 0.623
N 6249 5530 4460 962
Chi2 7.86***
Notes: Significance level at: *10, **5 and ***1 percent; numbers in parenthesis are t-statistics for ttests, Chi2-statistics for Chow tests.
DOI: 10.4236/ojacct.2018.72008 119 Open Journal of Accounting
Table 6. Robust tests results of H3-H4 by using lagged audit fees as independent variable.
Variables (1) (2) (3) (4)
Small board size Big board size Short tenure Long tenure
Culture −0.094** −0.223*** −0.054 −0.202***
(−2.395) (−4.295) (−1.158) (−4.963)
size 0.358*** 0.389*** 0.367*** 0.379***
(47.313) (37.944) (41.949) (45.417)
debt −0.082 −0.156** −0.033 −0.178***
(−1.581) (−2.253) (−0.557) (−3.056)
roa 0.090 −0.573** −0.258 −0.045
(0.501) (−2.397) (−1.163) (−0.244)
caset2 −0.090 −0.111 −0.211*** 0.007
(−1.570) (−1.245) (−2.980) (0.111)
loss 0.061* 0.049 0.019 0.112***
(1.828) (1.163) (0.489) (3.117)
listtime 0.002 −0.000 −0.028 0.033
(0.144) (−0.003) (−1.617) (1.489)
ownership −0.047*** −0.032 −0.047** −0.046***
(−2.956) (−1.468) (−2.467) (−2.662)
Big4/big5 0.642*** 0.558*** 0.603*** 0.605***
(15.396) (12.723) (13.510) (15.353)
audittenure 0.033*** −0.050*** 0.012 −0.013
(2.758) (−3.253) (0.893) (−0.992)
autype −0.128*** −0.140** −0.115** −0.150***
(−2.946) (−2.460) (−2.405) (−3.020)
age 29.158 −4.728 −5.218 35.533*
(1.615) (−0.199) (−0.257) (1.763)
tenure −0.019 0.040*
(−1.237) (1.893)
Constant −108.161 23.688 26.013 −133.481*
(−1.535) (0.255) (0.328) (−1.696)
Year Yes Yes Yes Yes
Industry Yes Yes Yes Yes
Adj.−R2 0.599 0.670 0.626 0.617
N 3509 2021 2821 2709
Chi2 3.88** 5.37**
Notes: Significance level at: *10, **5 and ***1 percent; numbers in parenthesis are t-statistics for t tests, Chi2-statistics for Chow tests.
5. Conclusions
DOI: 10.4236/ojacct.2018.72008 120 Open Journal of Accounting
Table 7. Robust tests results of H1-H2 by using standard errors of clustering robustness.
Variables (1) (2) (3) (4)
Total sample Total sample No duality Duality
Culture −0.101 −0.108* −0.063 −0.296**
(−0.944) (−1.877) (−1.024) (−2.549)
size 0.384*** 0.390*** 0.355***
(27.777) (25.801) (13.579)
debt −0.054 −0.036 −0.100
(−0.868) (−0.526) (−0.787)
roa 0.061 −0.046 0.277
(0.324) (−0.227) (0.614)
caset2 −0.115 −0.111 −0.200
(−1.402) (−1.222) (−1.284)
loss 0.061** 0.051 0.087
(2.148) (1.574) (1.467)
listtime −0.029 −0.040* −0.002
(−1.330) (−1.664) (−0.060)
ownership −0.063*** −0.069*** −0.013
(−2.602) (−2.727) (−0.262)
Big4/big5 0.640*** 0.593*** 0.792***
(9.525) (8.527) (5.004)
audittenure 0.011 0.017 −0.022
(0.868) (1.178) (−0.806)
autype −0.143*** −0.156*** −0.107*
(−4.147) (−3.719) (−1.688)
age 4.575 0.520 21.044
(0.179) (0.019) (0.415)
tenure 0.007 0.000 0.042
(0.350) (0.008) (0.988)
Constant 13.411*** −12.536 3.215 −76.300
(207.736) (−0.126) (0.029) (−0.385)
Year Yes Yes Yes Yes
Industry Yes Yes Yes Yes
Adj.−R2 0.179 0.645 0.653 0.642
N 6249 6958 5508 1304
Chi2 11.02
Notes: Significance level at: *10, **5 and ***1 percent; numbers in parenthesis are t-statistics for t tests, Chi2-statistics for Chow tests.
DOI: 10.4236/ojacct.2018.72008 121 Open Journal of Accounting
Table 8. Robust tests results of H3-H4 by using standard errors of clustering robustness.
Variables (1) (2) (3) (4)
Small board size Big board size Short tenure Long tenure
Culture −0.065 −0.225*** −0.039 −0.188**
(−0.896) (−2.600) (−0.687) (−2.451)
size 0.373*** 0.399*** 0.383*** 0.385***
(22.213) (18.402) (23.162) (22.190)
debt −0.052 −0.092 0.002 −0.144
(−0.697) (−0.909) (0.028) (−1.623)
roa 0.310 −0.358 −0.062 0.176
(1.348) (−1.211) (−0.256) (0.730)
caset2 −0.085 −0.164 −0.199** −0.003
(−0.852) (−1.247) (−2.101) (−0.021)
loss 0.083** 0.031 0.021 0.117***
(2.543) (0.630) (0.638) (2.820)
listtime −0.032 −0.014 −0.043* 0.013
(−1.225) (−0.421) (−1.916) (0.345)
ownership −0.061* −0.062* −0.064** −0.072**
(−1.953) (−1.900) (−2.366) (−2.222)
Big 4/big 5 0.670*** 0.599*** 0.618*** 0.664***
(6.775) (6.868) (6.318) (10.258)
audittenure 0.041** −0.035* 0.016 0.002
(2.404) (−1.829) (1.039) (0.102)
autype −0.146*** −0.144** −0.143*** −0.144***
(−3.669) (−2.284) (−3.335) (−3.096)
age 21.416 −24.793 −13.816 30.582
(0.691) (−0.627) (−0.518) (0.817)
tenure −0.019 0.050
(−0.781) (1.593)
Constant −78.091 101.847 59.319 −114.196
(−0.645) (0.659) (0.570) (−0.782)
Year Yes Yes Yes Yes
Industry Yes Yes Yes Yes
Adj.−R2 0.630 0.681 0.645 0.640
N 4422 2536 4040 2918
Chi2 8.27*** 7.48***
Notes: Significance level at: *10, **5 and ***1 percent; numbers in parenthesis are t-statistics for t tests, Chi2-statistics for Chow tests.
go-DOI: 10.4236/ojacct.2018.72008 122 Open Journal of Accounting vernance, but it is difficult to control the differences between national account-ing standards, tax systems, bankruptcy laws and the implementation of laws.
This paper studies the influence of Chairman’s cultural background characte-ristics on the company’s audit fees by using the Chairman’s native place to measure the Chairman’s culture background, the results show that the Chair-man’s cultural background characteristics significantly influence the audit fees, and compared to the Chairman coming from farming culture areas, the Chair-man of the nomadic culture areas is only willing to pay lower audit fees. The main reason is that due to the influence of natural and social environment and other factors, people in nomadic culture areas will take more risks than people in farming culture areas, resulting in people coming from nomadic culture areas are more willing to take risks, and also more of risk awareness. This paper also finds that in the company of which the Chairman and CEO is the same person, the board size is bigger, the Chairman’s tenure is longer, the negative relation-ship between nomadic culture background and audit fees is more stronger. That is because it will strengthens the authority of the chairman and weaken the su-pervision of the board of directors if the Chairman and CEO is the same person, and the bigger board size will also weaken the supervision of the board of direc-tors, and the chairman’s personal characteristics will also be more likely to be shown in the company’s decisions with longer tenure of Chairman.
Unavoidably, there are still some limitations of this paper. Due to difficulties in the acquisition of certain data, there are still some other factors we don’t con-sider, such as the other differences between culture areas, which may weaken the conclusions of this paper. Still, this is the direction of author’s follow-up re-search.
References
[1] Hambrick, D.C. and Mason, P.A. (1984) Upper Echelons: Organization as a Reflec-tion of Its Managers. Academy Management Review, 9, 193-206.
[2] Malmendier, U. and Tate, G. (2005) Does Overconfidence Affect Corporate In-vestment? CEO Overconfidence Measures Revisited. European Financial Manage-ment, 11, 649-659. https://doi.org/10.1111/j.1354-7798.2005.00302.x
[3] Chen, J. and Zhou, F. (2016) Executive’s Background Characteristics, Internal Con-trol and Audit Fees. Journal of Shanxi Finance and Economics University, 6, 88-100.
[4] Simunic, A.D. (1980) The Pricing of Audit Services: Theory and Evidence. Journal of Accounting Research, 18, 161-190. https://doi.org/10.2307/2490397
[5] Bertrand, M. and Schoar, A. (2003) Managing with Style: The Effect of Managers on Firm Policies. Quarterly Journal of Economics, 118, 1169-1208.
https://doi.org/10.1162/003355303322552775
[6] North, D.C. (1990) Institutions, Institutional Change and Economic Performance. Cambridge University Press, Cambridge, 151-155.
https://doi.org/10.1017/CBO9780511808678
DOI: 10.4236/ojacct.2018.72008 123 Open Journal of Accounting https://doi.org/10.1057/palgrave.jibs.8490376
[8] Aggarwal, R. and Goodell, J.W. (2009) Markets and Institutions in Financial Inter-mediation: National Characteristics as Determinants. Journal of Banking & Finance, 33, 1770-1780. https://doi.org/10.1016/j.jbankfin.2009.03.004
[9] Ji, L.J., Nisbett, R.E. and Su, Y. (2001) Culture, Change, and Prediction. Psychologi-cal Science, 12, 450. https://doi.org/10.1111/1467-9280.00384
[10] Ferris, S.P., Jayaraman, N. and Sabherwal, S. (2013) CEO Overconfidence and In-ternational Merger and Acquisition Activity. Journal of Financial and Quantitative Analysis, 48, 137-164. https://doi.org/10.1017/S0022109013000069
[11] Kanagaretnam, K., Lim, C.Y. and Lobo, G.J. (2014) Influence of National Culture on Accounting Conservatism and Risk-Taking in the Banking Industry. Accounting Review, 89, 1115-1149. https://doi.org/10.2308/accr-50682
[12] He, W. and Liu, W. (2015) Enterprise Manager’s Ability and Audit Fees. Account-ing Research, 1, 89-97.
[13] Næss, M.W. (2003) Living with Risk and Uncertainty: The Case of the Nomadic Pastoralists in the Aru Basin, Tibet. Experimental & Applied Acarology, 56, 391-401.
[14] Zhang, Y., Rao, Y. and Zhou, R. (2014) The Influence of Regional Culture on the Decision of Enterprise Merger & Acquisition: An Empirical Study Based on the Classification of Nomadic Culture and Farming Culture. Journal of Northeastern Normal University, 6, 13-19.
[15] Fama, E.F. and Jensen, M.C. (1983) Separation of Ownership and Control. Journal of Law & Economics, 26, 301-325. https://doi.org/10.1086/467037
[16] Hoitash, U., Hoitash, R. and Bedard, J. (2009) Corporate Governance and Internal Control over Financial Reporting: A Comparison of Regulatory Regimes. The Ac-counting Review, 84, 839-867. https://doi.org/10.2308/accr.2009.84.3.839
[17] Goyal, V.K. and Park, C.W. (2002) Board Leadership Structure and CEO Turnover. Journal of Corporate Finance, 8, 49-66.
https://doi.org/10.1016/S0929-1199(01)00028-1
[18] Li, J. and Tang, Y.I. (2010) CEO Hubris and Firm Risk Taking in China: The Mod-erating Role of Managerial Discretion. Academy of Management Journal, 53, 45-68.
https://doi.org/10.5465/AMJ.2010.48036912
[19] Zhang, Y. (2010) Corporate Audit Committee, Leadership Structure and Audit Pricing. Research on Productivity, 11, 212-215.
[20] Jensen, M.C. (1993) The Modern Industrial Revolution, Exit, and the Failure of In-ternal Control Systems. Journal of Finance, 48, 831-880.
https://doi.org/10.1111/j.1540-6261.1993.tb04022.x
[21] Albuquerque, R.A. and Miao, J. (2013) CEO Power, Compensation, and Gover-nance. Annals of Economics & Finance, 14, 417-452.
[22] Morse, A., Nanda, V. and Seru, A. (2011) Are Incentive Contracts Rigged by Po-werful CEOs? Journal of Finance, 66, 1779-1821.
https://doi.org/10.1111/j.1540-6261.2011.01687.x
[23] Cronqvist, H., Makhija, A.K. and Yonker, S.E. (2012) Behavioral Consistency in Corporate Finance: CEO Personal and Corporate Leverage. Journal of Financial Economics, 103, 20-40. https://doi.org/10.1016/j.jfineco.2011.08.005
[24] Liu, Y. and Zhang, Z. (2016) Research on Equity Balance, Chairman’s Tenure and Investment Squeeze. Nankai Business Review, 19, 54-69.
DOI: 10.4236/ojacct.2018.72008 124 Open Journal of Accounting
Structure. Economic Management, 2, 78-85.
[26] Xin, L. and Chen, H. (2013) Product Market Competition, Competitive Position and Audit Fees—A Dual Consideration Based on Agency Cost and Management Risk. Audit Research, 3, 50-58.
[27] Wu, B. (1996) The Formation and Division of Chinese Cultural Area. Academic Monthly, 3, 10-15.