ISSN Online: 2165-3860 ISSN Print: 2165-3852
DOI: 10.4236/ojfd.2018.81001 Mar. 9, 2018 1 Open Journal of Fluid Dynamics
Impact of Ground Effect on Airplane Lateral
Directional Stability during Take-Off and
Landing
M. Sereez, N. Abramov, M. G. Goman
De Montfort University, Leicester, UK
Abstract
Computational simulations of aerodynamic characteristics of the Common Research Model (CRM), representing a typical transport airliner are con-ducted using CFD methods in close proximity to the ground. The obtained dependencies on bank angle for aerodynamic forces and moments are further used in stability and controllability analysis of the lateral-directional aircraft motion. Essential changes in the lateral-directional modes in close proximity to the ground have been identified. For example, with approach to the ground, the roll subsidence and spiral eigenvalues are merging creating the oscillatory Roll-Spiral mode with quite significant frequency. This transfor-mation of the lateral-directional dynamics in piloted simulation may affect the aircraft responses to external crosswind, modify handling quality characteris-tics and improve realism of crosswind landing. The material of this paper was presented at the Seventh European Conference for Aeronautics and Space Sciences EUCASS-2017. Further work is carried out for evaluation of the ground effect aerodynamics for a high-lift configuration based on a hybrid geometry of DLR F11 and NASA GTM models with fully deployed flaps and slats. Some aspects of grid generation for a high lift configuration using structured blocking approach are discussed.
Keywords
CFD, High-Lift Configuration, Ground Effect, Airplane Stability, Later-al-Directional Modes
1. Introduction
According to statistics of fatal accidents worldwide for commercial Jet Fleet How to cite this paper: Sereez, M.,
Abra-mov, N. and Goman, M.G. (2018) Impact of Ground Effect on Airplane Lateral Di-rectional Stability during Take-Off and Landing. Open Journal of Fluid Dynamics, 8, 1-14.
https://doi.org/10.4236/ojfd.2018.81001
Received: January 29, 2018 Accepted: March 6, 2018 Published: March 9, 2018
Copyright © 2018 by authors and Scientific Research Publishing Inc. This work is licensed under the Creative Commons Attribution International License (CC BY 4.0).
DOI: 10.4236/ojfd.2018.81001 2 Open Journal of Fluid Dynamics during the period 2006-2015 presented by Boeing Company Ltd the number of fatalities during landing due to Abnormal Runway Contact (ARC) and Runway Excursion (RE) holds the second place with controlled flight into terrain (CFIT) after the Loss-of-Control in Flight (LOC-I) [1]. Approach and landing accident reduction (ALAR) is the primary goal of the Flight Safety Foundation (FSF) [2]. It is noted that a better knowledge of flight dynamics in close proximity to the ground can provide increased understanding of the various crosswind handling techniques to increase safety during a crosswind landing [2].
Aircraft aerodynamic characteristics and dynamic behaviour are subjected to changes in proximity to the ground during landing approach and take-off flight [3]. An increase in the lift force, reduction in the amount of induced drag, onset of the pitching down moment requires control actions from the pilot for re-trimming aircraft. The above mentioned aerodynamic changes due to ground effect in the aircraft longitudinal dynamics and control are well recognised. Spe-cial wind tunnel techniques are used for evaluation of the ground effect in the longitudinal aerodynamic characteristics [4]. An analytical study of the ground effect on the airplane longitudinal stability can be found, for example, in paper [5].
During crosswind landing and take-off the aircraft lateral-directional dynam-ics can be excited. Aircraft can be approaching and landing with sideslip and nonzero bank angle, this requires leveling aircraft in close proximity to the run-way. Therefore the effect of closeness to the ground on the lateral-directional aerodynamic characteristics in such situations should be seriously evaluated. To the best knowledge of the authors, changes in the lateral-directional airplane dynamics due to ground effect have not been addressed in the aeronautical lite-rature and not introduced in the flight simulation practice.
In this paper we approach the above problem by using CFD methods for computational prediction of airplane aerodynamic characteristics in static con-ditions, when the airplane is flying above the runway with nonzero bank angle. The Common Research Model (CRM) [6] [7] of a generic modern transport air-plane was considered in its cruise configuration. The CFD simulations were conducted using ANSYS Fluent and OpenFOAM open source software [8]. Most of the previously reported CFD simulations of aerodynamics in ground effect have been carried out for two dimensional airfoils and low aspect ratio configu-rations [9][10][11][12].
DOI: 10.4236/ojfd.2018.81001 3 Open Journal of Fluid Dynamics handling quality characteristics. The major factor of the performed ground effect dynamic analysis was the introduction of the rolling and yawing moments de-pendencies on the airplane bank angle, which was equivalent to the “aerody-namic banking stiffness”. The airplane responses to ailerons and rudder control inputs also change in close proximity to the ground.
The formulation of the computational framework and simulation results for CRM ground effect aerodynamics are presented in Section 2. Additionally the preliminary results in grid generation for a high-lift configuration with fully deployed flaps and slats are discussed. Section 3 presents results of dynamic analysis for the lateral-directional motion and also the 6-DOF simulations of the full scale flight simulation model in close proximity to the ground.
2. CFD Simulation of Ground Effect Aerodynamics
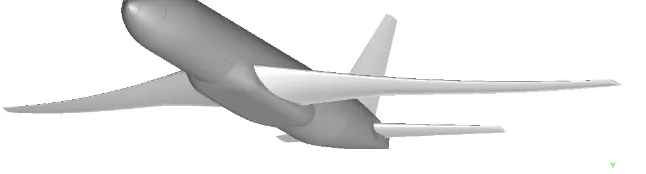
For evaluation of the ground effect aerodynamics in this study the Common Re-search Model (CRM) geometry of a generic airliner was selected. The CRM geometry in wing-body-horizontal tail configuration is available on NASA repo-sitory for Drag Prediction Workshop [6]. The geometry was modified to include the ONERA vertical fin available at [7]. The reference area for CRM model, shown in Figure 1 is Sref= 383.7 m2 and Cref= 7 m, the wing has an aspect ratio of AR= 9.0.
2.1. Grid Generation
The build topology of the CRM model has been checked and corrected to ensure air tightness on the model surfaces. After this procedure a hexahedral mesh was generated for the full model. A structured mapped blocking approach with ap-propriate splits and inclusion of O-grids was used to better capture the boundary layer regions on the airplane surfaces.
[image:3.595.209.532.592.679.2]The blocks initially generated, were transformed through rotations and trans-lations to generate hexahedral unstructured meshes according to flight condi-tions, i.e. airplane attitude and closeness to the ground. The boundary condi-tions on the ground were implemented as a moving wall with direction and ve-locity magnitude of incoming flow and were resolved with inclusion of H-grid layers with appropriate wall distance (Y+<1).
DOI: 10.4236/ojfd.2018.81001 4 Open Journal of Fluid Dynamics The initial meshes were generated for different altitudes above the ground, i.e.
4
h= c, h=2c, h=1c, and h=0.5c. At each altitude h, the grid was adapted
for a number of different angles of attack settings α =4 ,8 ,12 . At altitude 0.5
h= c additionally a number of bank angle settings was considered
4 ,8 ,12
φ =
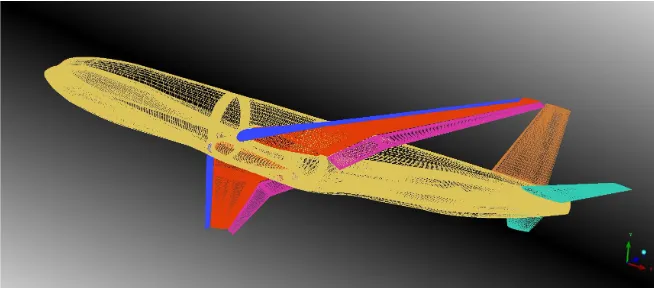
with additional adaptation of the grid. Figure 2 shows differentCRM attitudes at h=0.5c (different colors are used to highlight different
aerodynamic surfaces of the model). The blue mesh in the bottom represents the ground.
The numerical simulations were carried out within reasonable accuracy of a grid between coarse to medium, i.e. about 10 million cells for a full body confi-guration. This seems suitable for our purpose here to evaluate ground effect.
2.2. Governing Equations and Boundary Conditions
The Navier-Stokes equations governing incompressible fluid flow are: 0
u
∇ ⋅ = (1)
(
)
2u
u u u p
t ν ρ
∂ + ⋅∇ − ∇ = −∇
∂ (2)
For the Reynolds numbers typical for industrial applications, the computa-tional resources required for a Direct Numerical Simulation (DNS) of Equations (1) (2) are exceeding the currently available technical capabilities. The effect of turbulence is normally simplified by solving the Reynolds-Averaged Navi-er-Stokes (RANS) equations, which are the time averaged approximation of Eq-uations (1) (2). The averaging of fluctuating velocities generates additional terms, known as the Reynolds stresses. To describe these stresses the additional empirical equations, generally in the form of partial differential equations are required to close the computational model. The majority of RANS models are based on the concept of an eddy viscosity, equivalent to the kinematic viscosity of the fluid, which describes the turbulent mixing or the diffusion of momen-tum. For closure, in this study the turbulence k-ω-SST formulation is used [13].
( )
j *(
)
k k t
j j
u k k
P k
t x x t
ω
β ω
µ σ µ
∂
∂ + = − + ∂ + ∂
[image:4.595.209.537.522.703.2]∂ ∂ ∂ ∂ (3)
DOI: 10.4236/ojfd.2018.81001 5 Open Journal of Fluid Dynamics
( )
j 2(
)
k t
j t j
u
P D
t x x ω
ω
ω
γ
βω
µ σ µ
µ
∂
∂ + = − + ∂ + +
∂ ∂ ∂ (4)
where turbulent viscosity is defined as:
(
11 2)
max ,
t
a k
a F
µ
ω
=
Ω (5)
Far field is assumed at least 100 chord lengths away from the aircraft in x and y direction and +z direction. The –z distance was measured in terms of distance
h as it was normal to the ground. A free stream turbulence intensity 0.1% was assumed at the inlet and pressure was discretized to be zero gradient in normal direction at inlet, outlet and the airplane surfaces.
2.3. Solver and Numerical Settings
The ground effect aerodynamics was simulated using the steady-state and un-steady solver (U/RANS), closed by the k-ω-SST model for turbulence. Under re-laxation is applied for solution of U/RANS equations to increase convergence stability. Second order discretization schemes were used to solve momentum and continuity equations. All scalar variables are solved with the first order ac-curacy. The residuals for all the equations are allowed to reach a satisfactory convergence of 1/10,000th of the initial values (see Figure 3).
In the case of unsteady simulations at moderately high angle of attack and bank angle, the steady state solution is computed first, which is then used to in-itialize the unsteady solution to improve the convergence and stability for the unsteady solution.
The simulations were run on a University cluster with 24 processors and the time for convergence for a single point in steady state simulations took an aver-age of 1 - 2 days, while for unsteady simulations it took 4 - 5 days to reach con-vergence. The average CPU time was about 1.05 min/iteration. Most of the si-mulations ran from at least 5000 iterations to a maximum of 15,000 iterations.
[image:5.595.209.538.560.704.2]The results for M = 0.4, Re = 24 million at zero angle of attack is validated against available data obtained at the Netherlands Aerospace Center (NLR)
DOI: 10.4236/ojfd.2018.81001 6 Open Journal of Fluid Dynamics using their in-house CFD code ENFLOW. The lift coefficient at the above men-tioned flight conditions is CL = 0.188 for our simulations and CL = 0.197 for ENFLOW simulations. The variation in the lift coefficient between two codes is about 5% and is subject to many differences such as grid and numerical setup.
2.4. Simulation Results
In close proximity to the ground the airplane wing tip vortices are modified giv-ing a reduced downwash contribution. This leads to increase in the lift force, reduction in the amount of induced drag, onset of the pitching down moment. For illustration purposes, Figure 4 shows a pressure distribution on the CRM surfaces, the ground and in a far field cross-section at flight with altitude
0.5
h= c, angle of attack α =8 and bank angle φ=4. Note, the wing closer to the ground has a much weaker tip vortex than a similar vortex on the upper wing, which appears to be slightly elliptical. There are also zones with increased pressure on the ground under the wing and horizontal tail.
Transformations of the wing tip vortices in ground effect produce changes in the aerodynamic forces and moments acting on the aircraft. Figure 5 presents simulated dependencies for the lift, drag and also for the pitching, rolling and yawing moment coefficients. The ground effect increments in the aerodynamic loads increase with increase of the magnitude of the lift and strengthening the wing tip vortices and downwash outside of the ground. For example, at α =8 and zero bank angle
φ =
0
the increase in the lift coefficient is ∆CL =0.08, which is equivalent to increase on 11.2% (see Figure 5, top left plot). Further in-crease in the lift coefficient takes place at bank angleφ =
12
, ∆CL=0.217, which is equivalent to increase on 28.7% (see Figure 5, top right plot). The drag coefficient at bank angle φ=12 decreases, ∆CD = −0.013, this is equivalent to decrease on 11.8% (see Figure 5, top right plot).The aerodynamic moments are also affected by the bank angle in close prox-imity to the ground. There is a significant pitching down effect at φ=12, i.e.
0.198
m
C
∆ = − (see Figure 5, bottom left plot). The most important for our
[image:6.595.212.540.562.688.2]ob-jectives are the rolling and yawing moment dependencies on bank angle, shown in Figure 5, bottom right plot. The moment coefficient Cl proportionally
Figure 4. Pressure distribution on CRM surface, the ground and far field cross-section at
0.5
DOI: 10.4236/ojfd.2018.81001 7 Open Journal of Fluid Dynamics Figure 5. Effect of bank angle on aerodynamic coefficients CL, CD, Cm, Cl, Cn at
0.5
h= c , α=8.
decreases with increase of bank angle
φ
, which is acting in a way as a stiff spring. The yawing moment coefficient increases with increase of bank angle untilφ =
8
, but decreases with the change of sign atφ =
12
(see Figure 5,bottom left plot).
2.5. High-Lift Configuration
The ground effect in aerodynamic characteristics is proportional to the lift force. For CRM configuration we considered high angle of attack runway approach. The airplanes are normally approach landing with deployed leading and trailing edge flaps, which produce a high lift at low angles of attack. Hereafter, we present preliminary set up for a high-lift configuration.
2.5.1. Geometry
A hybrid model is constructed by combining the wing-body configuration (DLR F11) provided in the 2nd AIAA High Lift Prediction workshop [14] and the NASA General Transport Model (GTM) available in Open VSP Hangar [15]. This is successfully done by trimming the vertical and horizontal stabilizers along with fuselage rear end at roughly ¾th of the fuselage length from the nose. The geometry is then also simplified for CFD by cleaning up in terms of topolo-gy. Surfaces are further simplified and merged together to automate the ease of blocking with caution such that the authenticity of the model is not lost and the geometry is not violated.
[image:7.595.212.533.74.321.2]DOI: 10.4236/ojfd.2018.81001 8 Open Journal of Fluid Dynamics span. The flaps are deflected down at 32 degrees and the slats are deflected down at 26.5 degrees.
2.5.2. Grid Generation
The grid for this particular configuration is structured using Hexa-8 and quad-4 elements. The hexa elements are ideally 8 node elements in 3D space, and 2D quads are 4 node elements. Such a grid is made using blocking and mapping the blocks to the model under consideration. The current mesh contains more than 1500 blocks and hence for complex full flight configurations such as DLR F11 it is difficult to maintain mesh quality in terms of orthogonality, skewness and as-pect ratio for such a mesh. This becomes even more difficult when specially ap-plied to the small gaps in between the flaps, slats and the main wing as we need to resolve the boundary layer for each of them separately, but also maintain connectivity in mesh such that they are resolved as a single structure.
[image:8.595.209.536.378.522.2] [image:8.595.210.538.554.702.2]However, as seen in Figure 6 and Figure 7 the special blocking allows us to control the boundary layer from flaps, slats and wing without having them col-lapse each other. This is one of the main advantages of using a structured block-ing approach for such configurations along with other benefits such as reduction in cell count, higher quality meshes and more flexible and solvable by matrix solvers as the nodes are in a much regular order.
Figure 6. Isometric wireframe view of the surface grid for F11-GTM model.
DOI: 10.4236/ojfd.2018.81001 9 Open Journal of Fluid Dynamics The gridding also follows the guide lines given by the High Lift Prediction Workshop [14]. A coarse mesh according to [14] should have the wall spacing of Y+ = 1 and in dimensional form is y = 0.00055 mm. With the increase in mesh size a proportional decrease in wall distance y, should be implemented. It is also advised that at least the first 2 layers in the boundary should have a constant cell spacing. A minimum of at least 4 cells is recommended in the trailing edge for a coarse mesh and the boundary growth is to be at the ratio of <1.25. The spacings should be roughly 0.1% of the span wise length and chord wise local length pa-rallel to the direction of the grid. Furthermore, as common practice indicates, the far field is at least 100 Cref away from the body in every direction. The grids are intended for the landing conditions of Re = 15.1 million and the same grids are recommended to be used for lower Reynolds tests as well.
Future plans include to run CFD simulations for the ground effect aerody-namics considering the described high-lift configuration with additional objec-tive to evaluate unsteady and rotary aerodynamic derivaobjec-tives in proximity to the ground and their effect on the lateral-directional stability.
3. Airplane Lateral-Directional Dynamics in Close Proximity
to the Ground
The obtained in CFD simulations dependencies for the aerodynamic coeffi-cients, presented in the previous section, have been used for modification of the full flight simulation model of a typical transport aircraft for conducting 6-DOF simulations in a level trimmed flight in close proximity to the ground. Trim and linearisation procedures have been applied to evaluate aircraft stability condi-tions and small amplitude modes of motion in the longitudinal and later-al-directional motion. Additionally, the impact of ground proximity on stability of the lateral-direction dynamics is addressed in this section complemented by the eigenvalues analysis for the linearised lateral-directional equations.
3.1. Lateral-Directional Equations
For evaluation of the airplane lateral-directional dynamics in close proximity to the ground the stability-axis lateral-directional equations are considered in the following vector-matrix form (see notations in [16]):
1 0 0 0
0 0 1 0 0 0
a r a r r p a r r p N N
r N N N N r
g V
p L L L L p L L
Y
δ δ
β φ
β
β φ δ δ
δ β β δ φ φ − = + (6)
The new terms in the state matrix of Equation (6) are
( )
22 n
zz
V Sb
N C h
I
φ= φ ρ
and
( )
22 l
xx
V Sb
L C h
I
φ= φ ρ . They represent the rolling and yawing accelerations
DOI: 10.4236/ojfd.2018.81001 10 Open Journal of Fluid Dynamics “aerodynamic roll stiffness”, which will tend to level the airplane above the run-way.
In flight away from the ground, when Nφ =Lφ =0, the lateral-directional modes are defined by the Roll-Dutch complex-conjugate eigenvalues
2
1
DR n
λ
= − ±
ξ ω
−
ξ
, the roll subsidence eigenvalue λR and the spiral modeeigenvalue λS. It is reasonable to represent the ground effect in the form of a
root-loci with a parameter indicating variation of the reduced flight altitude h=h c.
3.2. Oscillatory Roll-Spiral Mode in Lateral-Directional Dynamics
The lateral-directional characteristic equation with account of ground effect can be represented in the following form:
(
)(
)
(
2 2)
(
2)
1 0
2 0
S R n n
DR GE
s−
λ
s−λ
s +ξω ω
+ −L sφ +a s+a = (7)where
1 r r
N
a L N
L Y
φ
β φ
= − −
0 r r
N N
a N L N L
L L Y
φ φ
β β β
φ φ
= − + −
(8)
Parameter Lφ varies from zero value in flight with no ground effect (h= ∞) to its maximum value in close proximity to the ground (
h
=
0.5 - 1.0
). TheNφ Lφ ratio in expressions a1 and a2 (8) has a weak dependence on reduced al-titude h. So, with increase of parameter Lφ the eigenvalues will move on the
complex plane from their initial values 2
1
DR n
λ
= − ±
ξ ω
−
ξ
, λR and λSto-ward s the values defined by zeros z1, z2 of the second order polynomial equation
2
1 0
0
s
+
a s
+
a
=
and one pair of eigenvalues will migrate to infinity. Theloca-tion of zeros z1 and z2 depends on lateral directional coefficients in the expres-sions for a1 and a0 (8). These zeros can be located in the left half of the complex plane, being a complex-conjugate pair, or move to the right unstable half of the complex plane creating an opportunity for onset of oscillatory instability due to ground effect, when a1< 0. There is also a possibility for onset of aperiodical in-stability due to ground effect if a0< 0.
A full flight simulation model of a typical transport aircraft has been modified taking into account the aerodynamic dependencies presented in the previous section for the 6-DOF flight simulations in a level trimmed flight in close prox-imity to the ground. The ground effect is strong in close proxprox-imity to the ground and at the altitude exceeding four mean aerodynamic chords practically vanish-es.
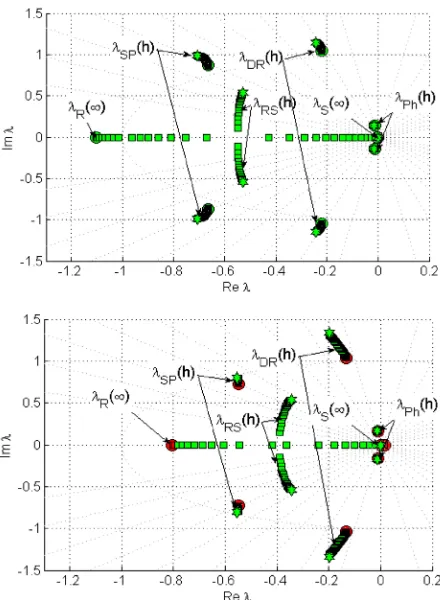
The eigenvalues of the linearised equations of motion are presented in Figure 8 with variation of parameter h. The eigenvalues root-loci shows significant transformation of the lateral-directional modes of motion.
DOI: 10.4236/ojfd.2018.81001 11 Open Journal of Fluid Dynamics Figure 8. Root-loci of eigenvalues of the longitudinal and
lat-eral-directional dynamics modes at different altitudes above the runway h=4c, h=2.5c and h=1c , top plot-α=3
and bottom plot α=8.
are merging creating the oscillatory Roll-Spiral mode with quite significant fre-quency ω =RS 0.538 rad s (see Figure 8, bottom plot, α =8
). Along with this
change, the Dutch-roll eigenvalues increase frequency from the level of 1.05 rad s
D
ω = to ω =D 1.34 rad s.
There are very little changes in the short-period longitudinal eigenvalues, λSP
and practically no changes in the longitudinal phugoid mode, λPh. In Table 1
the eigenvalues for the lateral-directional motion modes for flight at h=∞ and 1
h= c, are presented for clarity showing a substantial transformation of the lat-eral-directional dynamics.
DOI: 10.4236/ojfd.2018.81001 12 Open Journal of Fluid Dynamics Figure 9. Airplane responses to doublet aileron control input
25 a
δ = ± at different altitudes above the runway obtained in
6-DOF simulation.
Figure 10. Airplane responses to doublet rudder control input 35
r
δ = ± at different altitudes above the runway obtained in
[image:12.595.249.494.71.261.2]6-DOF simulation.
Table 1. Eigenvalues of Longitudinal and Lateral-Directional Dynamics Modes at α=8. Ground
Effect Short Period (SP) Phugiod (Ph) Roll® Spiral (S) Dutch Roll (DR)
( )
h ∞ 0.549 ± 0.742i 0.012 ± 0.17i −0.8 −0.008 −0.133 ± 1.048i
0.5
h= c −0.554 ± 0.8i −0.012 ± 0.17i −0.344 + 0.538i −0.344 - 0.538i −0.2 ± 1.335i
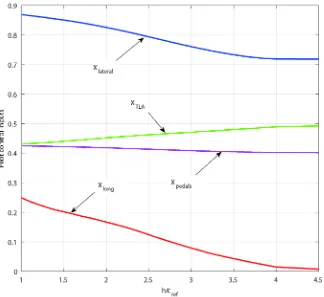
[image:12.595.250.498.331.517.2] [image:12.595.208.539.600.653.2]DOI: 10.4236/ojfd.2018.81001 13 Open Journal of Fluid Dynamics Figure 11. Trim control inputs required in landing approach with nonzero sideslip and bank angles (α=8 , β =10 ,φ=4).
angles. Figure 11 shows the required control pilot inputs in trim flight with steady sideslip α =8, φ=4 and β=10. The control inputs are normalised with respect to maximum deflections. One can see that during landing signifi-cant retrimming is required in the longitudinal and lateral control channels and thrust control, and less sensitivity is shown in the directional channel.
4. Concluding Remarks
CFD simulation results for evaluation of the ground effect aerodynamics have been obtained for CRM model [17] in its cruise configuration using Fluent soft-ware. The k-ω SST turbulence model and the “moving wall” boundary condi-tions were utilised to realistically simulate runway boundary layer. The future plans include evaluation of the ground effect aerodynamics for a high-lift confi-guration F11/GTM using the OpenFOAM software with objective to additionally evaluate unsteady and rotary aerodynamic derivatives in close proximity to the ground and their effect on the lateral-directional stability.
DOI: 10.4236/ojfd.2018.81001 14 Open Journal of Fluid Dynamics
Acknowledgements
The authors appreciate discussions with test pilot Vladimir Biryukov and are grateful for his comments on crosswind approach-and-landing. His participa-tion in preliminary piloted simulaparticipa-tions helped to tune the aerodynamic model to produce realistic results.
References
[1] Statistical Summary of Commercial Jet Airplane Accidents (2015) World Wide Op-erations 1959-2015. Aviation Safety, Boeing Commercial Airplanes, 2015.
[2] Flight Safety Foundation (2000) Approach-and-Landing Accident Reduction (ALAR) Briefing Note: 8.7—Crosswind Landing. Flight Safety Foundation, Flight Safety Digest. https://flightsafety.org/files/alar_bn8-7-crosswind.pdf
[3] Cui, E. and Zhang, X. (2010) Ground Effect Aerodynamics. In: Encyclopedia of AerospaceEngineering, Wiley Online Library.
https://doi.org/10.1002/9780470686652.eae022
[4] Meredith, C. and Evans,W. (2000) Ground Effect Testing Capabilities in the Filton 12'×10' Low Speed Wind Tunnel. 22ndInternationalCongressoftheAeronautical Sciences, Harrogate, 27 August-1 September 2000, Paper ICAS-373.
[5] Staufenbiel, R.W. and Schlichting, U.-J. (1988) Stability of Airplanes in Ground Ef-fect. JournalofAircraft, 25, 289-294. https://doi.org/10.2514/3.45562
[6] https://aiaa-dpw.larc.nasa.gov/Workshop5/DPW5-geom.html
[7] https://commonresearchmodel.larc.nasa.gov/geometry/vertical-tail%20geometry/
[8] OpenFOAM (2017) The Open Source Computational Fuid Dynamics Toolbox.
http://www.openfoam.com/
[9] Ahmed, M.R., Takasaki, T. and Kohama, Y. (2007) Aerodynamics of a NACA 4412 Airfoil in Ground Effect. AIAAJournal, 45, 37-47. https://doi.org/10.2514/1.23872
[10] Doig, G. and Barber, T.J. (2011) Considerations for Numerical Modeling of In-verted Wings in Ground Effect. AIAAJournal, 49, 2330-2333.
https://doi.org/10.2514/1.J051273
[11] Mahon, S. and Zhang, X. (2005) Computational Analysis of Pressure and Wake Characteristics of an Aerofoil in Ground Effect. Journal of Fluids Engineering, Transactions of the ASME, 127, 290-298.https://doi.org/10.1115/1.1891152
[12] Zhang, X. and Zerihan, J. (2004) Edge Vortices of a Double-Element Wing in Ground Effect. Journal of Aircraft, 41, 1127-1137. https://doi.org/10.2514/1.1380
[13] Menter, F.R. (1992) Improved Two-Equation k-ω Turbulence Models for Aerody-namic Flows. TM 103975, NACA.
[14] 2nd AIAA CFD High Lift Prediction Workshop (2017).
https://hiliftpw.larc.nasa.gov/index-workshop2.html
[15] OpenVSP Sofware and Hangar (2017). http://hangar.openvsp.org/
http://openvsp.org/
[16] Robert, F. (2004) Stengel. Flight Dynamics. Princeton University Press, Princeton. [17] Abramov, N.B., Sereez, M. and Goman, M.G. (2017) Computational Ground Effect