Studies on the Macrobenthos of the Southern Ocean
A thesis
submitted for the Degree of
Doctor of Philosophy in Zoology in the
University of Canterbury by
James K. ~owry
Christchurch, New Zealand
iii
PREFACE
The following thesis is written in five parts. These include a diversity paper, a zoogeography paper, two taxonomy papers, and a catalogue. Al though each paper is a separate entity, they are all inherently related. The foundation of the thesis is a series of collections made between southern New Zealand and McMurdo Sound,
~ntarctica, intermittently from December 1970 to February 1973. They have formed the basis of the diversity study and raised the questions on which the rest of the thesis depends. Sorting, identifying and counting the animals in the collections has been a long slow job, broken up by other shorter studies presented here and elsewhere.
The zoogeography study was undertaken to gain a better under-9tanding of the origin and present day distribution of Antarctic Amphipoda and Polychaeta, the two main groups in the diversity study. Much of this work consisted of searching the literature and compiling distribution records which were sorted by the computer into areal checklists. The mechanics for this line of research are now worked out and I hope to continue i t for other Antarctic invertebrate groups with the objective of looking for large scale zoogeographic trends. As the zoogeography study progressed i t became apparent that the literature on Southern Ocean amphipods was badly in need of unifica-tion. Since I had most of the ~iterature at my fingertips, and since I had to determine synonymies and distributions for the zoogeography study I decided to formalize this information into a catalogue, which was subsequently done with the help of Miss Suzanne Bullock. The catalogue was compiled on a computer and is very easy to update as new information becomes available. This makes i t a continuous record of published information on Southern Ocean Amphipoda.
The two amphipod taxonomy papers came directly from the collec-tions for the diversity study. Unfortunately they describe only a small proportion of the new species in the collections. I
Christchurch
studies on the Macrobenthos of the Southern Ocean
L Marine Benthic Diversity along a Latitudinal
v
Gradient . , . . . 1-176
2. Zoogeography of the Antarctic and Subantarctic
Arnphipoda and Polychaeta . . . • . . . • • . . . • . . • • . . . . • . . . . 1-26
3. Neoxenodice cryophile, a new Podocerid from the Ross Sea, Antarctica (Crustacea:
Antphipoda) ... '" . ~ '" '" '" e .. (I . . . Q . . . 11< " . . . '" '" ~ '" • '" . . . '" .. " 111> '" Oil '" . . . . . . . 1-8
4. New Garomaridean Arnphipoda from Port Pegasus,
Stewart Island, New Zealand ....•.••.•••••••••.•...•.•• 1-18
5, of the Marine Gammaridean Arnphipoda
Studies on the Macrobenthos of the Southern Ocean. 1.
~ampling in Moubray Bay, Cape Hallett,
It is fascinating to contemplate the possibilities inherent in
stable environments existing in rather cold temperatures ..• In a
system at high temperatures a higher amount of entropy is produced
in the exchange of a fixed amount of energy. In consequence, a
system at high temperature cannot go as far (cannot reach the same
degree of maturity) as an equivalent system at a lower temperature
".Nevertheless, i t happens that at the present time the most stable environments are found in the tropics.
Ramon Marga1ef
ix
ABSTRACT
Four hundred and sixty-nine species and 61 559 individuals
were collected from six stations along a latitudinal transect
between southern New Zealand, 47°8, and McMurdo Sound, 77°8, Ross
Sea. Dominant species based on abundance and frequency of
occurrence are discussed for each sampled community. Based on the
numerical percentage of suspension-feeding and deposit-feeding
individuals, the basic trophic structure of each community is
deter-mined. Two stations have mixed suspension, deposit-feeding
communities, two have deposit-feeding communities, and two have
suspension-feeding communities. The species diversity statistics,
heterogeneity, richness, and equitability are determined for each
corrununity. These statistics show no correlation between species
diversity of the sampled macrobenthos and latitude, indicating that
macrobenthic diversity does not change with latitude along tl1e
trrulsect. However, there is good correlation between species
diversity of the sampled macrobenthos and trophic structure of the
communities. The relationship indicates that mixed suspension,
deposit-feeding communitieg are more diverse than deposit-feeding
cooonunities which, in turn, are more diverse than suspension-feeding
communities.
Along the latitudinal transect polychaetes, peracarids, and
bivalves are always the dominant macrobenthic groups. But, while
polychaete species and numbers remain relatively constant with
latitude, bivalves decrease with increasing latitude and peracarids
increase. The decrease in bivalve importance on the Antarctic
shelf is attributed to low temperatures, which affect larval
reproduction, and the shallow calcium carbonate compensation depth
which affects shell construction and maintenance. Peracarids and
polychaetes are apparently not affected by these parameters, and
have effectively replaced bivalves on the Antarctic shelf.
Heterogeneity of the soft bottom macrobenthos from other sampled
parts of the world oceans is similar to the Southern Ocean
macro-benthos, except the North Atlantic shelves and the Arctic deep sea
\vhich are lower. This similarity is believed to be the result of
stable environmental conditions over a long period of time whereas
lower heterogeneity on the North Atlantic shelves and in the Arctic
CONTENTS
INTRODUCTION •....•.•• PREVIOUS STUDIES
OBJECTIVES OF THIS STUDY ENVIRONMENT
STUDY AREA
Campbell Plateau Antarctic Peninsula victoria Land Coast LATITUDINAL GRADIENT
METHODS
Temperature •.•...•• Salinity and Oxygen
Insolation and Primary Productivity
FIELD AND LABORATORY WORK Sampling and Sieving Sediments
Identification and Curation
Trophic Structure •..•••.•...••••••. DATA PROCESSING AND STATISTICAL ANALYSES
Data processing Rank Analysis
xi Page 1 1 2 4 4 4 5 5 5 5 16 16 19 19 19 19 19 20 20 20 20 Species Diversity . . . ' . . . a . I t • • 21 Species Richness ... " . . . . "... 21
Heterogeneity . . . .
Species Equitability RESULTS
SEDIMENT DESCRIPTION COMMUNITY DESCRIPTION PORT PEGASUS, 47°S
Numerical Dominants Component Groups
...
.:.
.1. • • • . • • .
C>II •
22 22 24 24 29 29 29 29
Trophic Structure Species Diversity
41
44
PERSEVERANCE HARBOUR, 52 Os ••••••••••••••••••••••••••••••••• 48
Numerical Dominants •..•.••••..••..•••••••.••••..••.•.• 48 Component Groups .•.••...•...••..••.••••••. , .••• ,.... 48
Trophic Structure Species Diversity
50
52 ARTHUR HARBOUR, 64°s .•••••••••••••..•.••••••.•.•••.•• ,... 56
Numerical Dominants ••.•••••.•.•..•••••.••.••..•••....• 56 Componen t Groups "'." ... " " " .•• " ... '" ... " •••• It It ., . . . . " • " • .. .. 56
Trophic Structure Species Diversity
58 60 CAPE HALLETT, 72 Os ••••••••••••••••••••••••••••••••••••••••• 64
Numerical Dominants ••.•.•...••.•.••••..••••.•..••.•..• 64
Component Groups •••...••.••.•••.••••••••••.•.••.•.••.. 64
Trophic structure Species Diversity
66
68 CAPE BIRD, 77°S . 11 (I 1l> .. \II (I 0 . . . ". (I . . . 6 Ii (I • • _ " . . (I • (I (I ( I ' " (I. " ... '" (I " (I • ~ Q 75
Ntunerical Dominants . . . 75
Component Groups i!Ir "" " • • '" • 110 .. 110 (I . , (I " " " • \II I) II 11 (# • (I 'I 00 Q • Ii> at> .. ~ (I ., • • • 75 Trophic structure
Species Divers
HURLBERT'S ANALYSIS .. , • • • • • • • • • ., • • • • • • • • 1 ) 0 0 . o e . " • • 0 0 9 • • • • • • • •
77 79 84 DI SCUSS ION • (I (I (I . . . (I (I • • • (I • (I • (I • • • • (I . . . . (I . . (I U (I (I (I . . . I) (I • (I (I • • • • • (ji (I • (I . . . . (I '" (I .. 90
SPECIES DIVERSITY OF THE SHALLOW WATER MACROBENTHOS BETWEEN 47°S AND 77°S LATITUDE: ITS RELATIONSHIP TO LATITUDE
AND TO TROPHIC STRUCTURE ...•..•.•••...••...•.•••••.•••••.•• 90 Species Diversity and Latitude •.••••••.•..••••••••.••• 90 Species Diversity and Trophic
Structure: ~1ixed Suspension,
COMPOSITIONAL STRUCTURE OF THE SHALLOW WATER MACROBENTHOS BETWEEN 47°S AND 77°S
LATITUDE: ITS RELATIONSHIP TO LATITUDE
Changes in the Composition of the Macrobenthos between 47°S and 77°S
Latitude . . . $ 9 • • • • "'U . . . 8 e • • • • • • • • • • • • • • ., • • • • • • • • •
Bivalvia ".'J • • • • • • • • • • " . . . .
Peracarida
Polychaeta
Requirements for Life on the
xiii
102
102
106
107
108
Cold Antarctic Shelf •.• , •••••••••••••••••••••••••••••• 109
Palaeoclimatology and Palaeogeography of the Southern Ocean from the Eocene
to the Recent .... '" . . . III . . . 9 • • • • • • • • • " • • • • • • • • • • • • • 112
Evolutionary Synthesis: the
Development of the Fauna 114
LATITUDINAL BENTHIC DIVERSITY: A
NEW LOOK AT AN OLD PROBLEM ••••.••••••.••...•••••••••••••••• 120
SUMMARY
Previous Studies .•.•...••••••••••••••••••••••.••.••• 120
Heterogeneity Comparisons
Stability-Time Hypothesis
125
128
132
ACKNO'~LEDGMENTS ... (0 • • • " II; " e lit _ 'lI e .. '" !II " " n • i'i • Ii'/: • • II " tI Ii'/: • • v • • • • • • • • • • • • • " . , . . 135
LITERATURE
APPENDIX I
CITED . /II • ~ • • • 0 <> G . . . O/f .. ., 0' • • '" . . . '" • • • (; • 9 . . . 0' • • • • • • • 137
148
long been recognized (Wallace, 1878), but only recently have they
come under critical examination (Darlington, 1957; Fisher, 1960;
Pianka, 1966; Sanders, 1968). Examples of work on terrestrial
gradients include Dobzhansky (1950) '. Kusenov (1957), Simpson (1964),
and MacArthur (1965). In the marine environment studies involving
latitudinal gradients and species diversity include Hartmeyer
(1911), Thorson (1952, 1957), Wells (1955), Fisher (1960), Stehli,
McAlester and Helsley (1967), Sanders (1968), and Johnson (1970).
Steh1i (1968) wrote a very interesting paper which used terrestrial
and marine diversity gradients to test the hypotheses of continental
drift and polar wandering. In general these studies have
established that there are more species toward the tropics than in
temperate or polar latitudes, and that species living in the tropics
maintain smaller populations than. species living in temperate or
polar climes.
There has been a large number of theoretical explanations for
latitudinal changes in species diversity, and much of this work has
been revievled by Pianka (1966). He summarized six distinct
hypo-theses concerning changes in species diversity with latitude; the
time hypothesis (Fisher, 1960; Simpson, 1964), the competition
hypothesis (Dobzhansky, 1950; Williams, 1964), the climatic
stability hypothesis (Klopfer, 1959; Fisher, 1960; Dunbar, 1960),
and the productivity hypothesis (Connell and Orias, 1964). Paine
(1966) proposed a theory based on predation.
The theories of Margalef (1963) and Sanders (1968) have become
particularly relevant to understanding diversity of extant marine
communities, and also in interpreting fossil evidence (Shaak,
1975) • Marga1ef and Sanders believed that community succession
proceeds on a sliding scale from a pioneer or predominantly
physically controlled community to a mature or predominantly
biologically controlled community. Succession proceeds with time
in a stable environment. At any stage physical or biological
disturbances can slow down or even set back the process, but as the
Woodin (1974) has recently shown, in a quantitative manner, the importance of biological interaction in a physically controlled community as defined by Sanders (1968, 1969).
In his recent book, Marine Zoogeography, Briggs (1974) argued his concept of latitudinal diversity as a step-wise
progression correlated with major zoogeographic boundaries. Each step from the tropics to the poles takes the ecosystem further from a biologically controlled system, and closer to one that is physically controlled. However, this type of argument may not be relevant to the marine soft bottom benthos because it is a
buffered environment where changes are very gradual. Briggs discussed geographic size as an important factor controlling numbers of species in the marine environment. He supported this argument by referring to the good correlation between numbers of
and geographic area on isolated oceanic islands as docu-mented by MacArthur and Wilson (1963, 1967), and Johnson, Mason and Raven (1968).
Of particular relevance to the present study is the work of Gunnar rrhorson and Howard Sanders" Thorson (1957), r8flecting on his earlier work (1952), st.ated that while the number of epifaunal increased significantly from the North Polar Ocean to the tropics the number of infaunal species remained relatively
constant. 'ro illustrate this point: he plotted various groups of epifatmal and infaunal invertebrates against latitude. Sanders
(1968) used bivalves and polychaetes, which normally made up at least 80% of his benthic samples from the North Atlantic and Indian Oceans to show that the numbers of infaunal increased
substantially toward the tropics. Thorson (1957) and Sanders (1968) have thus come to different conclusions concerning changes in the of in faunal species with latitude. This has created a as to whether the established generality mentioned earlier, which states that tropical ecosystems contain more species with smaller popUlations than polar ecosystems,
actually to the marine benthos.
OBJECTLVES OF THIS STUDY
This study the diversity of the shallow water benthos between southern New Zealand and the Antarctic seas.
2. to divide each macrobenthic community into its major component
parts to deternune if specific groups are changing along the
gradient; 3. to describe and classify each community by its
numerically dominant species and by its basic trophic structure;
4. to compare the diversity of the communities in this study with
studies from other parts of the world.
Throughout the study I have used the term community to describe
the macrobenthic samples from each area. The term as used here
follows the concept of Mills (1969) which stated that a community
is "a group of organisms occurring in a particular environment,
presumably interacting with each other and with the environment, and
separable by means of ecological survey from other groups". I have
also used the name "Southern Ocean" in preference to other names in
the literature, such as the "Antarctic Ocean", The name is used
here to refer to the body of water bounded at its southern margin by
the Antarctic continent and at its northern margin by the Antarct.ic
convergence. Hedgpeth (1969) has discussed the derivation and
ENVIRONMENT
STUDY AREA
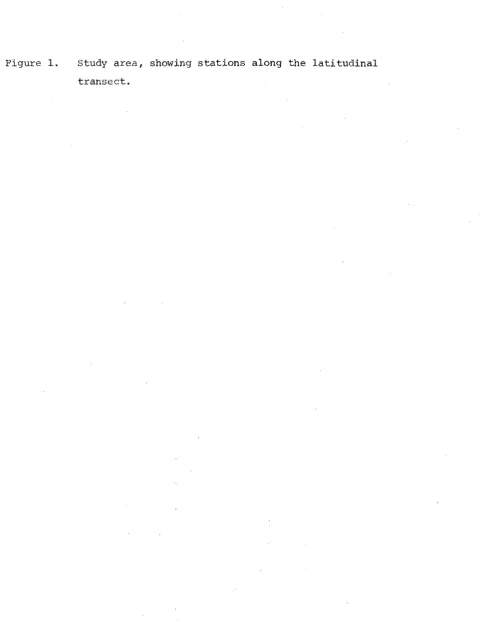
The study area (figure 1) was a transect from 47°S to 77°S
latitude and 165°E to 1700E longitude, except one station at 64°W.
The stations along the transect were confined to continental
shelves between 11 m and 250 m depth. Three stations were sampled
on the Campbell Plateau south of New Zealand, one station was
sampled on the Antarctic Peninsula, and two stations were sampled
along the Victoria Land Coast in the Ross Sea. From these stations
I collected 469 species and 61,559 individuals (see Appendix I for
species list).
Campbell Plateau
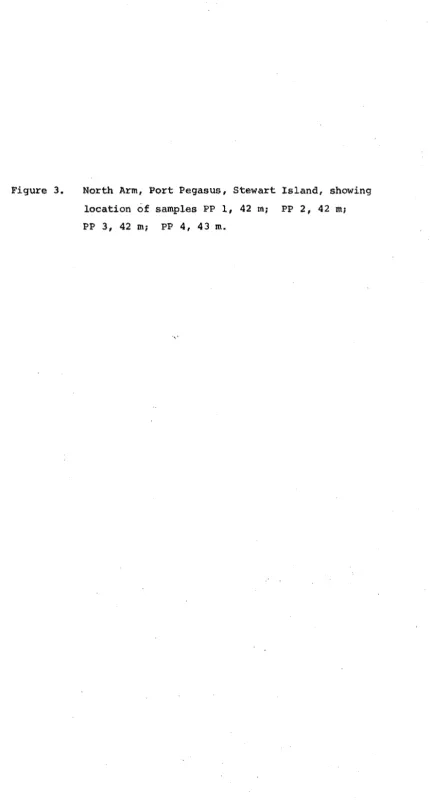
Station PP 1-4: North Arm, Port Pegasus, Stewart Island, New
Zealand; 47°10'S, 167°41'Ei 42 m to 43 m depth, (figures 2, 3).
This is the northernmost set of samples which were collected on
23 March 1972 in a howling NW ga.le from the R. V. Acheron. The
protected nature of the port resulted in relatively calm water and
allowed the sampling to be accomplished without undue problems.
Station AI 3-4: Sandy Bay, Por'c Ross, Auckland Islands, New
Zealand; 50030'S, 166°16'Ei 11 m to 14.6 m depth, (figures 2, 4).
These samples were taken from the R.V. Acheron on 14 February 1973
while anchored off Enderby Island. The evening was fine and calm
and no trouble was experienced in making the collections. AI 1-2:
waterfall Inlet, Auckland Islands, New Zealand; 50049'S, l66°16'Ei
13 m to 14.6 m depth, (figures 2, 5). These samples were "71so
taken from the R.V. Acheron on 12 February 1973. The ship was
stationed just outside the inlet on a strong ebbing tide.
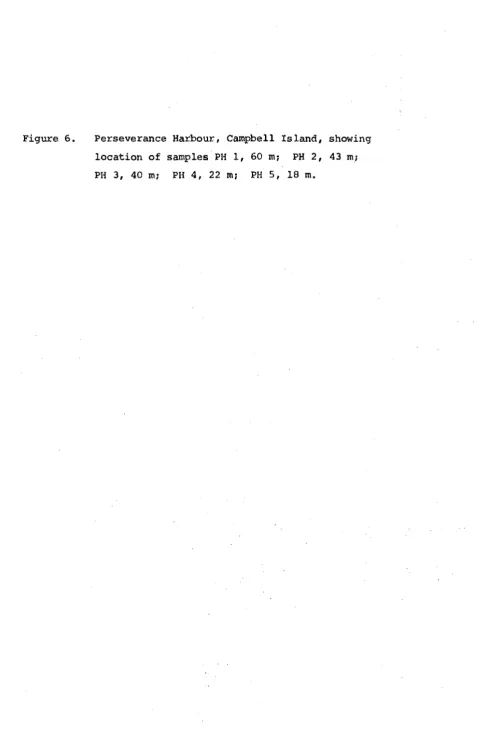
Station PH 1-5: Perseverance Harbour, Campbell Island, New
Zealand; 52°33'S,169°l0'Ei 14 m to 60 m depth, (figures 2,6).
This set of samples was made on two occasions, 12 and 25 February
1971 from the H.M.N.Z.S. Endeavour. The narrowness of the harbour
made collecting difficult and the samples from the head of the
harbour were taken with some effort from one of the landing boats.
On both occasions the sea was calm with little wind.
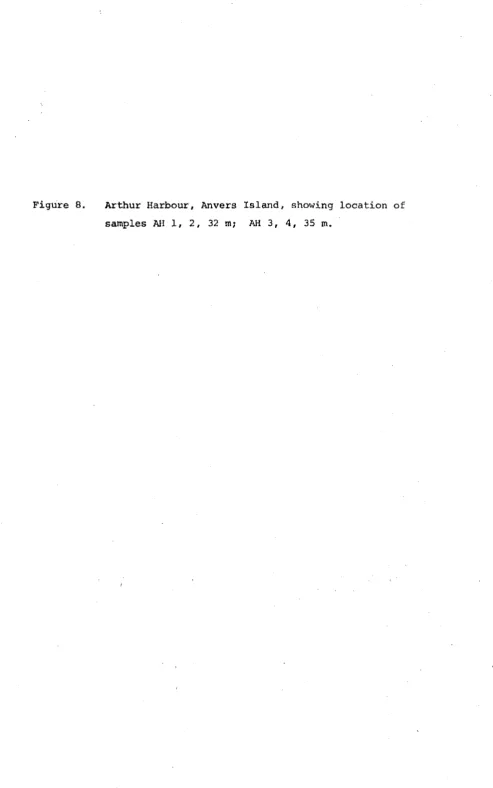
64°48'S, 64°06'Wi 26 m to 40 m depth, (figures 7, 8), These
samples were collected during the summer seasons of 1967 and 1968
from small dinghies.
of the area.
Victoria Land Coast
Lowry (1975) has given a complete description
Station CH 1-4: Moubray Bay, Cape Hallett, Antarctica;
72°l8'S, l700l2'E; 104 m to 250 m depth, (figures 9, 10). These
samples were collected on 17 and 18 January 1972 from the U.S.C.G.C.
Northwind during a continuous 18 hour sampling period. In order to collect the samples a transect was cut through the ice, and clear
water for the grab was made by wagging the stern of the ship.
Samples were difficult to collect because of gravel in the sediment
which often became lodged in the jaws of the grab.
Station CB 1-4: McMurdo Sound, Cape Bird, Ross Island,
Antarctica; 77°l3'S, 166°26'Ei 35 m to 54 m depth, (figures 9,
11). These samples were taken from the small trimaran R.V. Clione
on 25, 28 December 1970 and 4, 11 January 1971. Samples were
collected on calm days when little pack ice was in the area although
the strong southerly flowing current off Cape Bird made sampling
somewhat difficult.
LATITUDINAL GRADIENT
Temperature
The latitudinal gradient forms a transect of approximately
2900 km between Port Pegasus and McMurdo Sound along a longitude of
about l700
E except Arthur Harbour at 64°W. The physical parameter
most easily measured is temperature. The summer temperature range
is about 18°C along the gradient, from 16°C in southern New Zealand
(C. Hay, University of Canterbury, pers. comm., 1975) to -1.90C in
McMurdo Sound (Littlepage, 1965). This is not considered a wide
temperature gradient over such a long transect, for as Dunbar (1968)
Figure 1. Study area, showing stations along the latitudinal
AUCKLAND ISLANDS'
'CAMPBELL ISLAND
'00
140
60
120
'"
..
,10
60
ISLAND
80
600S .'
./
40
50°
60
Figure 2. Campbell Plateau, showing the New Zealand Subantar
[image:21.595.143.519.217.820.2]47oL--t---STEWART (>
ISLAND
THE SNARES •.
170°
PEGASUS
49.L--+-~---
.... -...
~----... - - -
_~_---_-__I49°51°
CAMPBELL PLATEAU
PORT ROSS
AUCKLAND
i.t ..
ISLANDS .' ".
~_-+_-~---
..
---+---~ 51"1650
CARNLEY HARBOUR
CAMPBELL
ISLAND
~----PERSEVERANCE
HARBOUR
Figure 3. North Arm, Port Pegasus, stewart Island, showing
location of samples PP 1, 42 m; PP 2, 42 m;
[image:23.595.108.539.31.832.2]Figure 4.
Figure 5.
Sandy· Bay, Port Ross, Auckland Islands, showing
location of samples AI 3, 11 m; AI 4, 14.6 m.
Waterfall Inlet, Auckland Islands, showing location
3
10'
00'
PORT ROSS
AUCKLAND ISLANDS ~.
NEW ZEALAND
-1----t$~~3876;%870©7~---l
BAY
EWING
----...,~1.
---+---,34·
os· 166010'
CARNLEY HARBOUR
AUCKLAND ISLANDS.~
NEW ZEALAND
;
:
: :
~
:
.:
. . . .: . : : . ' : :
: :: ~
,;iH:;';
15'
TERFALL INLET
11 2
. AUCKLAND ISLAND'
: , : : . ::
05 • 166010 •
CAPE FARR
Figure 6. Perseverance Harbour, Campbell Island, showing
location of samples PH 1, 60 m, PH 2, 43 m;
[image:27.595.61.539.88.818.2]169'10' 12'
V
CAMPBELL ISLAND NEW ZEALAND
::,:,:
169'10' 1:2'
14'
I~.,.
EAST
l,y CAPE
,EREBUSls2< POINT 134'
I
.PHI
I
[:l6'
Figure 7. Antarctic Peninsula, showing Arthur I
SOUTH
WEDDELL SEA
.. : : : : '. LARS EN ICE::: . : . : : : :: SHELF:::::: • . . ' • t • ~ • • • • • • _ • • • • • • •
Figure 8. Arthur Harbour, Anvers Island, showing location of
[image:31.595.48.542.22.811.2]. ARTHUR HARBOUR .. ::'-':::: .. ANVERS ISLAND
ANTARCTICA
170· 180·
_ _ .. - - - . _ - ; 71·
HALLETT
13°
ISLAND
_ - - - - -.. ---1
'5
° ROSS SEA'?J FRANKLIN ISLAND
\
BEAUFORT ISLAND - - - -.. --- - 77· \ n'"''
... ROS S ISLAND
Figure 10. Moubray Bay, Cape Hallett, showing location of
samples CH 1, 104 m; CH 2, 134 m; CH 3, 208 m;
10'
MOUBRAY BAY
CAPE HALLETT ANTARCTICA
170015 ' 20'
17 ' I - - - + - - - -.. ~ H 4 - + - - - + - - - - i 17'
eCH3
eCH2
~---~.---_4---_t-~72
111 II'
eCH 1
CAPE HALLETT
EDISTO INLET
Figure 11. McMurdo Sound, Cape Bird, Ross Island, show
location of samples CB 1, 35 mi CB 2, 65 ~
[image:37.595.128.465.151.814.2]CAPE BIRD
ROSS ISLAND ANTARCTICA
13'~--+-_~_
7 14'
15 '
MCMURDO SOUND
ClCB4
eCB3
77
environment, but the range of temperature over a given period of
time that is important. Annual temperature ranges in the shallow
water along the transect are shown in figure 12, and the stability
of the environment with respect to temperature is considered below.
Littlepage (1965) found that the annual temperature range in
McMurdo Sound was only 0.6°C. In Arthur Harbour it has increased
to slightly over 2°C (Lowry, 1975). Means from 25 years of sea
surface temperature data from Perseverance Harbour indicate an
annual range of 3.4°C (E. Farkas, New Zealand Meteorological
Service, pers. comm., 1975). The annual range at Tautuku
Penin-sula in southern New Zealand is 8°C (C. Hay, University of
Canterbury, pers. corom., 1975). Consequently annual temperature
ranges increase with decreasing latitude between McMurdo Sound and
southern New Zealand. However these ranges are considered
moderate when compared with the 30°C range along the shallow shelf
of the western North Atlantic (Sanders, 1958; Boesch, 1972), and
reflect the stability of the environment along the transect.
Salinity and Oxygen
The waters on the Campbell Plateau are mainly Australasian
Subantarctic surface waters with a salinity between 34.60~00 and
34.70~oo according to Houtman (1967). Salinity in Arthur Harbour
varied from 33.68%0 to 34.62%0 (Lowry, 1975). In McMurdo Sound,
16
Littlepage (1965) reported a salinity range from 33.96~o to
34.92%0' He found stable oxygen levels in McMurdo Sound between
75% and 105% saturation throughout the year. Bogoyavlenskiy (1966)
showed high oxygen values all along 1700
E longitude.
Insolation and Primary Productivity
The main physical variables along the gradient which might
affect the shallow water macrobenthos are temperature and light.
,
Stehli (1968) plotted a solar capture gradient and a planetary
temperature gradient (figure 13) for ocean surface waters, which
illustrates how these parameters change from the equator to the
poles. The figure indicates that surface plankton on the Antarctic
shelf will receive only half the amount of solar energy as surface
Meteorological Service, pers. corom., 1975);
C: Anvers Island, 64°48'S, (LowrYt 1975);
D: McMurdo Sound, 77°51'S, (Littlepage, 1965).
13. Solar energy capture gradient and
temperature gradient (0---0) for the southern
17
A
46°8
B
52°8
C
64°8
D
H
77°8
%
90 25
Z 70 15
0 t-3
H tx:I
8
:s:
~ 'd
H tx:I
0
~
U)
Z t-3
H d
~
50 5
30 -5
o
30 60period of .continuous sunlight. EI-Sayed (1968, 1970) found high
primary productivity in the coastal areas of New Zealand, the Ross
,
Sea, and along the inshore areas of the Antarctic Peninsula. He
illustrated (1970) a doubling of the carbon fixation rate between
35°S and 75°S in the area between New Zealand and the Ross Sea.
Other work~rs who have reported high primary productivity rates
from the inshore areas of the Antarctic Peninsula include EI-Sayed,
Mandelli and Sagimura (1964), Mandelli and Burkholder (1966), and
Horne, Fogge and Eagle (1969). Hedgpeth (1969) using this data
calculated that the waters south of the Antarctic Convergence are
"400% more productive than the rest of the oceans". Such a large
amount of pelagic food production may be expected to support dense
populations of benthic invertebrates. Furthermore the,se
popula-tions rr~y be expected to be highly diverse for Connell and Orias
(1964) have suggested that in a stable environment more energy can
be directed towards growth and reproduction and less to coping with
the environment. This leads to increased genetic variability,
because of the larger gene pool, and to narrower niches through
METHODS
FIELD AND LABORATORY WORK
Sampling and Sieving
All samples were taken between 11 m and 250 m depth. Samples
from Cape Hallett and Cape Bird were somewhat deeper than samples
from other areas because of the boulder bottoms above 30 m depth
and the uniformity of the bottom between 30 m and 200 m. All
samples except those from Arthur Harbour were collected with a
0.1 m2 Smith-McIntyre grab. This is a spring loaded
~ampler
which takes a consistent sample in normal sea conditions and may
be made heavier or lighter for sampling from hard sand to soft
19
mud (see Smith and McIntyre, 1954; Wigley, 1967), The samples
from Arthur Harbour were collected with a 0.06 m2 Petersen grab.
Samples were washed through a 1 rom screen, in accordance with Mare's
(1942) definition of macrofauna.
Sediments
The method used for analyzing the Arthur Harbour sediments
was described by Lowry (1975). The Bird sediments were
analyzed by Mr W. Farrelly, then of the Department of Geography,
university of Canterbury. All other sediments were analyzed in
the Department of Geology, University of Canterbury by Mr M.
MacPherson and myself. The sand and gravel fraction was analyzed
with u.S, Standard Sieves using the techniques of Folk (1974).
The mud fraction was analyzed using a hydrophotometer, model 7312.
Identification and Curation
Samples were stored in 10% buffered formalin in sea water. until
they could be sorted. They were then transferred to fresh water
and sorted in petri dishes under a dissecting microscope. Each
species was identified as far as possible, and the individuals
counted. Further identifications were made by specialists (see
acknowledgments) • They were then placed in small vials with 70%
could be recognized as living at the time of capture were used in
the study.
Trophic structure
To determine the basic trophic structure of each community,
identified taxa were classified into feeding types. The feeding
types of major interest here are suspension-feeders and
deposit-feeders. The remaining types such as omnivores, predators, and
scavengers have been lumped together in one group_ In classifying
the polychaetes I have relied on the work of Dales (1967) and Day
(1967), and personal communication with Knox (University of
Canterbury, 1975). For the bivalve molluscs I have consulted
Nicol (1969) and Meglitsch (1972). To classify the amphipods I
have referred to Enequist (1949), Kanneworff (1965), Barnard
(1962), and Mills (1967), and for the ostracods I have consulted
Cannon (1933) and Kornicker (1975) and Kornicker (Smithsonian
Institution, pers. corom., 1975). For smaller groups such as
sipunculids and priapulids, I have relied on Meglitsch (1972).
DATA PROCESSING AND S'l'ATISTICAL ANALYSES
Da ta Process ing
Data were analyzed on a Burroughs 6700 computer. The program
for analyzing heterogeneity, species richness, and equitability was
written by Dr C.L. McLay, Department of Zoology, University of
Canterbury. The program for analyzing species richness by
Hurlbert's method (1971) was written by Dr W.P. Barit, Department
of Mathematics, University of Canterbury.
Rank Analysis
To obtain a standard method for determining numerical dominance
among the macrobenthos from each area a rank analysis was used
21
were ranked by number. The most abundant species was given a score
of 10, the next was given a score of nine, and so on. The values
for each species were multiplied to give a score for that species,
and they were then ranked in descending order.
occurrence is expressed in percent.
species Diversity
Frequency of
Peet (1974) reviewed the problems centred around the
"concept-cluster diversity". In addition to tightening up definitions of
many of the terms now in general use he also provided guidelines
for the proper use of many of the indices. I have followed these
guidelines whenever discussing diversity in this paper. The term
diversity as used here refers to a combination of species richness,
heterogeneity and equitabi1ity.
Species Richness
The simplest component of diversity is the number of species
present. Because it is usually impossible to know all of the
species present in an area under investigation this measurement is
normally based on a series of samples. However as sample size
increases the proportional increase between species and individuals
becomes logarithmic. Marga1ef (1958) developed the following
formula to measure this relationship:
R (8-1)
log N
where 8 is the number of species and N is the number of individuals.
To use this index Peet (1974) stated that "the functional
relation-ship between the expected number of species ~(S) and the number of
individuals in the sample N remains constant among the communities
being stUdied" and that "the precise functional relationship is
knownll
• Obviously there would be little value in comparing the
number of bird species in a beech forest with the number of
amphipods in a benthic community, or crustacean species in the
plankton with insects' in the tundra, but one might reasonably
expect this to be a good comparative measure between several
macro-benthic communities living under similar conditions, especially if
weighed with other information.
often called species richness.
around the integration of the number of species and the distribution
of individuals among the species. The most useful method of
measu.ring this has been the formula of Shannon (1948) based on
information theory:
H'
=
-L
p. 10g2 p.~ ~
where P. equals the actual proportions of individuals in the popula-~
tion. However P. may be estimated by n./N where N equals the total
~ ~
number of individuals and n. is the number of individuals in the ith ~
species of the sampled population. This statistic is a measure of
the uncertainty of encounter between any two species in the
community under study. The more species in a community and the
more evenly distributed are the individuals among the species, then
the greater is the uncertainty of any two species meeting, and the
more uncertain the encounter the higher the heterogeneity. The
applicability of this measure to sampled populations is discussed
fully by Pielou (1966A~ Bf 1967).
Species Equitability
Lloyd and Ghelardi (1964) introduced the term equitability to
describe the component Qf diversity which is concerned with the
proportional distribution of individuals among species in the
popula-tion. In their concept species richness is dependent on the
structural diversity of the habitat, whereas equitability is more
dependent on the stability of the physical environment. In order
to measure equitability, heterogeneity must be compared with some
standard everness for the population. This may be done by using
Shannon's (1948) formula to calculate the maximum theoretical
heterogeneity of the population. Maximum theoretical heterogeneity
occurs when all individuals in the population are evenly distributed
among all species. The ratio of the heterogeneity value for the
community to the maximum theoretical heterogeneity value is a
measure of the equitability of the community.
Pielou (1967) as:
J ' H'/H' max
where Shannon's formula is used in both the numerator and the
denominator.
Because of the well established correlation between animal
distribution and sediment type (Sanders, 1958; Grey, 1974; Rhoads,
1974) it was originally intended to sample similar sediment types
along the transect, but in general they range from sandy-silt
bottoms to almost pure sand bottoms (figures 14-17). The sediment
samples from Perseverance Harbour were lost and never recovered.
In the North Arm of Port Pegasus the bottom sediments ranged
from silty-sand to sandy-silt, with the two fractions comprising
about equal percentage weights of the sediments. The sands were
mainly fine to very fine and the largest fraction of silt was coarse
(figure 14). Clay usually made up less than 3% of the sediment,
and gravel less than 2%.
The sediments in Waterfall Inlet and in Sandy Bay, Auckland
Islands were 84% to 97% sand (figure 15). The sediments from
Waterfall Inlet had a higher silt content, and are termed
silty-sands. Most of the particles fall in the range from medium sand to
coarse silt. The Sandy Bay bottom was nearly pure sand in the size
range from medium to very fine. Gravel and clay fractions from all
of the Auckland Islands samples are 1% or less.
The sediments from the western side of Arthur Harbour have been
described by Lowry (1975). The bottom was composed of sandy-mud
with a mud content varying from 50% to 96% of the total weight, and
a sand fraction varying from 7% to 48%.
In Moubray Bay, Cape Hallett, at CH I, 3, 4 the bottom was
composed of silty-sand with small amounts of gravel and clay present
(figure 16). On this silty-sand bottom the main fraction of
particles was fine to very fine sands. But at CH 2 the sand
fraction was less pronounced and the gravel fraction increased to
form a silty-gravelly-sand bottom.
The bottom at Cape Bird was 87% to 96% sand and similar in
particle size distribution to the Auckland Islands except that a
larger gravel fraction was present (figure 17). Only the sediment
at CB 2 had a mud fraction, and CB 4 had a large enough gravel
fraction to be classified as a gravelly-sand bottom. Cape Bird has
Figure 14. Distribution of grain size fractions in samples
% 30 20 10 o % 30 20 10 o % 30 20 10 o
-GRAVEL1. 35'1,
GRAVEL 1.76%
-PP 2
PP 3
pp 4
.---.
Very Pebble Granule Coarse
Sand GRAVEL 0.76~ r---t Coarse Sand S.:u..~~D 48.24" SA:JD 48.17'
r - i
:.ledium sand SAND 44.27%
r
-VeryFine Fine
Sand Sand
SILT 47.13% SILT 47.47% ,...- r---Medium Coarse to Very
Silt Fine
% 50 40 30 20 10 o % 50 '
')0
)0
20
10 '~
GRAVEL 0.80%
GRAVEL
1,00%
lU 1
AI 2
Very Coarse Sand Coarse Sand SAND 85.22%
Hedi Ul1'
Sand SAND 84.63% Fine Sand Very Fine Sand SILT 13.41% 'Nedium
Coarse to Very
Silt Fine Silt SILT 14.07% CLAY 0.57% Clay CLAY 0.34%
15, Distribution of grain size fractions in samples AI 1,
AI 2, Waterfall Inlet, and AI 3, AI 4, Sandy Bay,
% 50 40 30 20 10 o % 50 40 30 20 10 o r- I'- l- I'-
I-AI 3
GRAVEL
0.66%
AI
Pebble Granule
GRAVEL 0.15% 4
--Ve::;y Coarse Sandr
-Coarse Sand SAND 95.28 r---Medium Sand SAND 97.45% r---~ very Fine Fine Sand Sand
SILT 3.77%
--
,....-,~1edium
Coarse to Very s i l t Fine
% .j() 30 20 10 % 40 30 20 10 o GRAVEL
1. 07~
GRAVEL
36.97\\
16
eH 1
CH 2
Very Coarse Sand Coarse Sand SA~D 75.37% Hedium Sand SAND 46.931)
Distribution of
Fine Sand Very Fine Sand SILT 21.05% ~ledium
Coarse to Very
Silt Fine
Silt SILT 14.61% CLAY 2.51% Clay CLAY 1.49%
size fractions in samples
% 40
30
20
10
o
%
40
30
20
10
o
GRAVEL
0.64%
CH 3
CH 4
Very Pebble Granule Coarse
Sand
GRAVEL
7.39%
Coarse Sand
SA:-.lD
73.68%
~ledium
Sand
SAND
67.0%
Fine Sand
Very Fine Sand
SILT 23.02%
Nedium Coarse to Very
sil t Fine
Silt
SILT 22.9%
CLAY
2.65%
Clay
CLAY
17. Distribution of grain size fractions in samples CB 1,
20 10 o % 40 30 20 10 o % 40 30 20 10 GRAVEL 4.06% GRAVEL o
CB 2
CB 4
Very Pebble Granule Coarse
Sand GRAVEL 12.79% SAND 95.94% SAND 93.07
Coarse Medium Sand Sand
SAND 87.21% Fine Sand Very Fine Sand SIL'l' o SILT 5.08% Hedium Coarse to Very
Sil t Fine
Farrelly (1972) has given a more complete description of the Cape
Bird offshore sediments.
29
The most similar bottom types occur between the Auckland Islands
and Cape Bird which both have sandy bottoms. Port Pegasus and
Moubray Bay have somewhat similar sediment types, but the sediments
in Moubray Bay have a larger sand and gravel fraction. The bottom
of the western side of Arthur Harbour has a higher mud fraction than
any of the other stations, and is considered a sandy-mud bottom.
COMMUNITY DESCRIPTION
POR,T PEGASUS, 47° S
Numerical Dominants
One hundred and seven invertebrate species and 1186 individuals
comprise the Port Pegasus samples (Table 5). Ten of these species
are present in every sample and make up 19% of the species and 76%
of the individuals. The rank analysis (Table 1) indicates that the
protobranch Nucula dunedinensis is the most abundant and evenly
distributed species in the samples. ~1e sedentary polychaetes
Phyllochaetopterus socialis and Maldane SPa also have even
distribu-tions, but are only half as abundant as N. dunedinensis. Other
abundant bivalves include the protobranch Solemya parkinsoni and the
eulamellibranchs Limatula suteri and Diplpdonta rakiura. Two
ubiquitous polychaetes Lumbrineris magalhaensis and Notomastus
latericeus rank next in the top 10 near the eulamellibranch
Nucinella maorianus. The only nt~erically important crustacean in
these samples is the pardaliscid amphipod Halice sublittoralis.
In contrast the remaining species are numerically unimportant
and unevenly distributed. Forty-seven percent of the species occur
in only one sample and make up 6% of the total numbers. These
include widespread New Zealand forms such as Aglaophamus verrilli,
Diastylis neozelanica, and Nemocardium pulchellum.
Component Groups
Most of the species and individuals in the Port Pegasus
1 2 3 4 5 6 7 8 9 10 11 12 13 14 15 16
of occurrence of the top 10 species in each sample.
PP 1 PP 2 PP 3 PP 4 f
Nucula dunedinensis 10 10 10 10 100
Phyllochaetopterus socialis 5 9 8 7 100
Solemya parkinsoni 9 6 7 6 100
Limatula suteri 6 5 5 8 100
Maldane sp. S 9 9 75
Diplodonta rakiura 7 7 4 2 100
Lurnbrineris magalhaensis 4 4 3 5 100
Nucinella maorianus 8 3 50
Halice sublittoralis 2 4 50
Notomastus latericeus 3 2 50
Dorvillea incerta 1 6 50
Cossura sp. 3 25
Diplodonta globus 2 25
Exogone heterosetosa 1 25
Ceradocus sp. 1 25
Phoxocephalus regium 1 25
31
Although bivalves do not have a large number of species they have
the largest population of any group present. The polychaetes have
a slightly lower population but they represent the largest number
of species in the community. Peracarids have a large number of
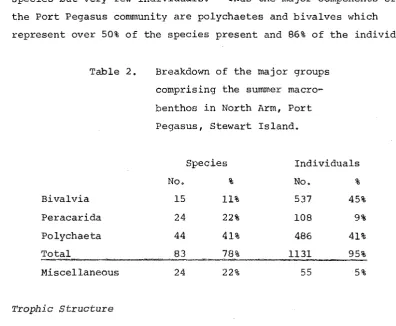
species but very few individuals. Thus the major components of
the Port Pegasus community are polychaetes and bivalves which
represent over 50% of the species present and 86% of the individuals.
Table 2.
Bivalvia
Peracarida
Polychaeta
Miscellaneous
Trophic structure
Breakdown of the major groups
comprising the summer
macro-benthos in North Arm, Port
Pegasus, Stewart Island.
Species Individuals
No. % No. %
15 11% 537 45%
24 22% 108 9%
44 41% 486 41%
%
24 22% 55 5%
The Port Pegasus macrobenthic samples represent a mixed
suspension, deposit-feeding community with 33% of the individuals
made up of suspension-feeders and 55% made up of deposit-feeders
(Table 3). In the suspension-feeding fraction there are a large
number of bivalves (55% of the individuals) and proportionally
smaller numbers of polychaetes (34%), peracarid crustaceans (8%),
and other miscellaneous groups (3%). The veneroid bivalves are
the most diverse group with seven species in six families. The
most important of these are the ungulids Diplodonta rakiura (l38/m2)
2
and D. globus (43/m). Among the pteroids the limid Limatula
suteri (l75/m2) is the most common suspension-feeder. Among the
arcoids, the nucinellid Nucinella maorianus (851m2) is also common.
These four species make up the majority of the bivalve
suspension-feeders. The only common peracarid suspension-feeder is the
pardaliscid amphipod Halice sublittoralis (631m2), Polychaetes
[image:59.595.82.479.157.483.2]abundant in the samples. Among the miscellaneous
suspension-feeders the alcyonarian Virgularia gracillima is very rare. The
anomuran decapod Callianassa filholi is also rare in these samples,
but it is known to be more abundant in sandier areas of Port Pegasus.
Deposit-feeders are the major feeding group in Port Pegasus and
the bivalves with 53% of the individuals are again the numerically
dominant group although they compose only 8% of the species (Table
3). The dominant species is the nuculid Nucula dunedinensis
(610/m2) and to a lesser extent the solemyid Solemya parkinsoni
2
(255/m ). Peracarid crustaceans are represented by a large
percentage of the species (32%), but only 10% of the
deposit-feeding individuals. There are three species in as many genera of
cumaceans including Diastylis neozelanica, but all are rare. The
tanaid Leptochelia tenuis is also rare. Arophipods are the most
diverse peracarid group with eight species in six families, but only
the phoxocephalid Phoxocephalus regium (531m2) is common. The
Corophiidae is represented by three species in three genera, and
there is a gammarid, a liljeborgiid, a lysianassid, and an
oedicero-tid among the remaining amphipods. The polychaetes have the richest
species composition and they make up 33"6 of the individuals. The
most diverse family is the Maldanidae with four species in as many
genera. Maldane Spa (253/11\2) is the most common deposit-feeding
polychaete. The large capitellid Notomastus latericeus (501m2), the
cossurid Cossura sp. (451m2), and the trichobranchid Terebellides
stroemii (351m2) are also well represented. Other rare
deposit-feeding polychaetes include two cirratulids, two orbiniids, two
spionids, two terebellids, an ampharetid, and the opheliid Armandia
maculata.
Among the remaining feeding types in Port Pegasus the possible
omnivores Lumbrineris magalhaensis (l23/m2), and Dorvillea incerta
2
(43/m ) are common along with the carnivorous syllid Exogone hetero-2
setosa (851m).
Thus it appears that the majority of the Port Pegasus community
is composed of deposit-feeders and suspension-feeders. Six of the
top 10 deposit-feeders are sedentary polychaetes, two are protobranch
suspension-Table 3. Trophic structure of the summer macrobenthos in North Arm, Port Pegasus, Stewart Island, based on 72% of the species and 95% of the individuals
(see Appendix II for detailed breakdown of trophic structure).·
Species % Individuals
Suspension-feeders 26 34% 375
Deposit-feeders 37 48% 617
Remainder (Omnivores, 14 18% 154
Carnivores, Scavengers)
Suspension-feeders
Bivalvia 11 42% 205
Peracarida 3 11% 32
Polychaeta 6 23% 127
Miscellaneous 6 23% 11
Deposit-feeders
Bivalvia 3 8% 331
Peracarida 12 32% 61
Polychaeta 17 46% 204
Miscellaneous 5 14% 22
Remainder (Omnivores, Carnivores, Scavengers)
Peracarida 1 8% 3
Polychaeta 11 84% 149
Miscellaneous 1 8% 2
33
% 33% 54% 13%
55% 8% 34% 3%
53% 10% 33% 4%
2%
[image:61.595.87.507.70.808.2]polychaetes and bivalves share a major role in the trophic structure
of the Port Pegasus community.
Species Diversity
The Port Pegasus samples are characterized by high species
richness, equitability, and heterogeneity (Table 4). These high
values reflect the mixed suspension, deposit-feeding community
structure where contrasting basic feeding types allow more different
kinds of animals to coexist within the community, thereby increasing
species richness and heterogeneity. The low population levels of
the dominant species and the large number of rare species cause high
equitability values,
PP 1
PP 2
pp 3 pp 4
Table 4. Species diversity statistics for the
summer macrobenthos in North Arm,
Port Pegasus, Stewart Island.
Species Species Species
heterogeneity richness equitability
4.40 9.55 0.77
4.44 9.53 0.77
4.83 11.40 0.80
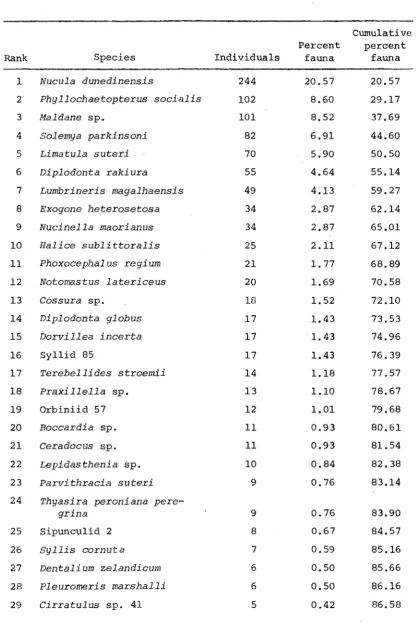
Table 5. Structure of the summer macrobenthic community in North Arm, Port Pegasus, stewart Island, based on the accumulated totals of samples PP 1 - PP 4. Species are listed in order of abundance,
35
Rank Species Individuals
Percent fauna
Cumulative percent
fauna
1 Nueula dunedinensis 244
2 Phylloehaetopterus soeialis 102
3 Maldane sp. 101
4 Solemya parkinsoni 82
5 Limatula suteri 70
6 Diplodonta rakiura 55
7 Lumbrineris magalhaensis 49
8 Exogone he,terosetosa 34
9 Nueinella maori an us 34
10 Haliee sublittoralis 25
11 Phoxoeephal us regium 21
12 Notomastus laterieeus 20
13 Cossura sp. 18
14 Diplodonta globus 17
15 Dorvillea ineerta 17
16 Syllid 85 17
17 Terebellides stroemii 14
18 Praxillella sp. 13
19 Orbiniid 57 12
20 Boeeardia sp. 11
21 Ceradoeus sp. 11
22 Lepidasthenia sp. 10
23 Parvithracia suteri 9
24 Thyasira peroni ana pere-grina 25 26 27 28 29
Sipunculid 2 Syllis cornuta
Dentalium zelandieum Pleuromeris marshalli Cirratulus sp. 41
9 8 7 6 6 5 20.57 8.60 8.52 6.91 5.90 4.64 4~13 2.87 2.87 2.11 1.77 1.69 1.52 1.43
1. 43
[image:63.595.93.511.176.802.2]33 Liljeborgia Spa A 5 0.42 88.26
34 Mysid 1 5 0.42 88.68
35 Nuculana bellula 5 0.42 89.10
36 Oedicerotid 80 5 0.42 89.52
37 Podocopid 7 5 0.42 89.94
38 Armandia maculata 4 0.34 90.28
39 Callianassa filholi 4 0.34 90.66
40 Euchone Spa A 4 0.34 90.96
41 Gammaropsis Spa A 4 0.34 91.30
42 Leaena SPa 4 0.34 91.64
43 Phascolosoma Spa 4 0.34 92.98
44 Spio Spa A 4 0.34 92.32
45 Pachychelium Spa 3 0.25 92.57
46 Pagurid 1 3 0.25 92.88
47 Polychaete 78 3 0.25 93.07
48 Pseudoprotomima Spa 3 0.25 93.32
49 Syllid 70 3 0.25 93.57
50 Artacama proboscidea 2 0.17 93.74
51 Brachiopod 1 2 0.17 93.91
52 Cadulus teliger 2 0.17 94.08
53 Holothurian 1 2 0.17 94.25
54 Idomene SPa 2 0.17 94.42
55 Isopod 15 2 0.17 94.59
56 Isopod 17 2 0.17 94.76
57 Mysid 2 2 0.17 94.93
58 Nemocardium pulchellum 2 0.17 95.10
59 Nicomache Spa 2 0.17 95.27
60 Lumbrineris galatheae 2 0.17 95.44
61 Ophiodromus angustifrons 2 0.17 95.61
62 Ophiuroid 1 2 0.17 95.78
63 Ophiuroid 2 2 0.17 95.95
64 Orbinia SPa 56 2 0.17 96.12
65 Rhodine Spa 2 0.17 96.29
66 Scolelepis antipoda 2 0.17 96.46
67 Tunicate 2 2 0.17 96.63
37
69 Amphicteis sp. 1 0.084 96.80
70 Arophipod 85 1 0.084 96.88
71 Aorcho sp. 1 0.084 96.97
72 Astacilla fusiformis 1 0.084 97.05
73 Astacilla tuberculata 1 0.084 97.13
74 Branchiomma sp. A 1 0.084 97.22
75 Solenogastre 1 1 0.084 97.30
76 Cirriformia sp. 1 0.084 97.39
77 Cyclopoid 1 1 0.084 97.47
78 Dasychone sp. 1 0.084 97.55
79 Diastylopsis thileniusi 1 0.084 97.64
80 Diastylis neozelanica 1 0.084 97.72
81 Dorvillea australis 1 0.084 97,81
82 Enteropneustid 1 0.084 97.89
83 Eteone sp. 1 0.084 97.97
84 Eunicid 46 1 0.084 98.06
85 Isopod 16 1 0.084 98.14
86 Melliteryx parva 1 0.084 98.23
87 Monia zelandica 1 0.084 98.31
88 Muelleriella hispida 1 0.084 98.39
89 Nimertean 1 1 0.084 98.48
90 Ninoe falklandica 1 0.084 98.56
91 Notocallista multistriata 1 0.084 98.65
92 Onuphis sp. 1 0.084 98.73
93 Orchomene sp, A 1 0.084 98.81
94 Paramithrax ? peronii 1 0.084 98,90
95 Photis nigrocula 1 0.084 98.98
96 Photis phaeocula 1 0.084 99.07
97 Eunicid 84 1 0.084 99.15
98 Heterospionid 88 1 0.084 99.23
99 Syllid 69 1 0.084 99.32
100 Syllid 86 1 0.084 99.40
101 Pon tophi 1 us australus 1 0.084 99.49
102 Prionospio malmgreni 1 0.084 99.57
103 Strepto.leberis arcuata 1 0.084 99.65
104 Tawera sp. A 1 0.084 99.74
105 Tunicate 1 1 0.084 99.82
was 107 and the total number of individuals was 1186, which
2
AUCKLAND ISLANDS, 500
S
Numerical Dominants
The four samples from the Auckland Islands contain 83 species
and 18,849 individuals (Table 10) which is much more than the
previous station. Seventeen percent of the species occur in every
sample and comprise 80% of the sampled population. The sedentary
39
polychaetes Spiophanes sp. A and Euchone Spa A are the most abundant
and widespread members of the community (Table 6). Among the
peracarids, the tanaidacean Anatanais novaezealandiae is also
abundant in all samples, but the cumacean Diastylis neozelanica,
although abundant, is numerically important only in samples AI 1
and AI 2. The eulamellibranch Perrierina aucklandica is very
abundant in samples AI 3 and AI 4. Common species occurring in all
samples include the polychaetes Exogone heterosetosa, Axiothella
quadrimaculata, the eulamellibranch Mysella unidentata, and
Oligochaete 3. ,Other species occurring in high numbers but not in
all samples include the polychaetes Boccardia sp. and Spio sp., the
eulamellibranch Cyamium problematicum, and the amphipod Lembos SPa
2.
About 30% of the species occur in only one sample, but among
these the amphipod Paraphoxus sp., the foraminiferan Psammosphaera
sp., and the polychaete Lumbrineris sphaerocephala are numerically
important.
Component Groups
Polychaetes, peracarid crustaceans, and bivalve molluscs totally
dominate the Auckland Islands community (Table 7). However, within
these groups the' polychaetes possess a majority of both the
and the individuals. Peracarids are also an important part of the
community, Their species richness is high and they have large
populations. Bivalves are not as important here as they were in
Port Pegasus. They have a large number of individuals but the
number of is low and the majority of the population belongs
1 2 3 4 5 6 7 8 9 10 11 12 13 14 15 16 17 18 19
numerical dominance and frequency of occurrence of the top 10 species in each sample.
AI 1 AI 2 AI 3 AI 4 f
Spiophanes sp. 9 10 7 10 100
Euchone sp. 10 8 5 7 100
Anatanais novaezealandiae 5 6 9 4 100
Perrierina aucklandiae 10 8 50
Diastylis neozelanica 8 9 50
Axiothella quadrimaculata 6 5 2 75
spio sp. 7 7 50
Boccardia sp. 8 5 50
Cyamium problematicum 6 2 50
Capitellidae n. g. 3 4 50
Exogone heterosetosa 9 25
Lembos sp. 2 6 25
Aonides trifidus 2 2 50
Lumbrineris magalhaensis 4 1 50
Paraphoxus sp. 4 25
Caprellina longi colli s 3 25
Mysella unidentata 3 25
Cirratulid 101 1 3 50
Oligochaete 3 1 25
Table 7.
Bivalvia
Peracarida
Polychaeta
Total
Miscellaneous
Trophic Structure
Breakdown of the major groups
comprising the summer
macro-benthos in Waterfall Inlet and
Sandy Bay, Auckland Islands.
Species Individuals
No. % No. %
10 12% 5167 27%
24 29% 3722 20%
33 40% 9602 51%
67 81% 18 669 98%
16 19% 358 2%
At the Auckland Islands 70% of the populations in Sandy Bay 41
and Waterfall Inlet are made up of suspension-feeders, although they
contribute only 2]% of the species (Table 8). This dominance is
due to the very large populations of the cyamiid bivalve Perrierina
aucklandica (11 635/m2), the spionid polychaete Spiophanes sp. A
(10 080/m2), and the sabellid polychaete Euchone sp. A (5600/m2).
The latter two species are particularly important members of the
community being first and second in the rank analysis. In spite
of the numerical dominance of these three species, veneroid
bivalves are fairly diverse and comprise 47% of the
suspension-feeding species with seven genera and species in four families.
Another cyamiid Cyamium probelmaticum (1037/m2) is well represented,
as is the lasaeid Mysella unidentata (490/m2) and the ungulid
2
Diplodonta rakiura (2l7/m). Peracarids comprise less than 1% of
the popUlation and are repre,sented by a mysid and the corophiid
amphipod Haplocheira barbimana. Polychaetes make up only 27% of
the suspension-feeding species, but all the species are common.
The spionids Boccardia sp. (2290/m2) and Spio sp. (1542/m2) and the
burrowing actinarian Edwardsia tricolor (50/m2) complete the
suspension-feeding ass~mblage.
Deposit-feeders are a much more diverse element of the Auckland
Islands community, for although they comprise only 25% of the
population they contribute 58% of the species (Table 8), Bivalves