feedstock for thermochemical conversion
MOHAMMED, Isah, ABAKR, Yousif, KABIR, Feroz Kazi <http://orcid.org/0000-0002-3121-9086>, YUSUP, Suzana, ALSHAREEF, Ibraheem and CHIN, Soh
Available from Sheffield Hallam University Research Archive (SHURA) at:
http://shura.shu.ac.uk/11744/
This document is the author deposited version. You are advised to consult the publisher's version if you wish to cite from it.
Published version
MOHAMMED, Isah, ABAKR, Yousif, KABIR, Feroz Kazi, YUSUP, Suzana,
ALSHAREEF, Ibraheem and CHIN, Soh (2015). Comprehensive characterization of Napier Grass as a feedstock for thermochemical conversion. Energies, 8 (5), 3403-3417.
Copyright and re-use policy
See http://shura.shu.ac.uk/information.html
energies
ISSN 1996-1073
www.mdpi.com/journal/energies
Article
Comprehensive Characterization of Napier Grass as
a Feedstock for Thermochemical Conversion
Isah Y. Mohammed 1, Yousif A. Abakr 1,*, Feroz K. Kazi 2, Suzana Yusup 3, Ibraheem Alshareef 4 and Soh A. Chin 4
1 Energy, Fuel and Power Technology Research Division, School of Engineering, the University of Nottingham Malaysia Campus, Jalan Broga, Semenyih 43500, Selangor Darul Eshan, Malaysia; E-Mail: [email protected]
2 Department of Chemical Engineering and Applied Chemistry, Aston University, Aston Triangle, Birmingham B4 7ET, UK; E-Mail: [email protected]
3 Department of Chemical Engineering, Universiti Teknology Petronas (UTP), Bandar Seri Iskandar, Tronoh 31750, Malaysia; E-Mail: [email protected]
4 Crops for the Future (CFF), the University of Nottingham Malaysia Campus, Jalan Broga, Semenyih 43500, Selangor Darul Eshan, Malaysia;
E-Mails: [email protected] (I.A.); [email protected] (S.A.C.)
* Author to whom correspondence should be addressed; E-Mail: [email protected]; Tel.: +60-132-321-232.
Academic Editor: Thomas E. Amidon
Received: 18 March 2015 / Accepted: 16 April 2015 / Published: 24 April 2015
the experimental data. The proposed models may be a reliable means for describing thermal decomposition of lignocellulosic biomass under nitrogen atmosphere at constant heating rate.
Keywords: Napier grass; characterization; proximate and ultimate analysis; XRD; FTIR; TGA; DTG
1. Introduction
Development of alternative renewable energy continues to grow in recent times due to the fear of energy insecurity in the near future and environmental cum sociopolitical issues associated with the use of fossil fuels. Application of lignocellulosic biomass (non-food materials) such as forest residues, agro-wastes, energy grasses, aquatic plants and algae, etc. for bioenergy production seem promising as they are evenly distributed across the globe and have also eliminated initial public perception of food insecurity associated with first generation biofuels which were produced from food materials [1–3]. In addition, these materials have low levels of sulfur, nitrogen and ash content which make them relatively environmentally friendly. Napier grass (Pennisetum purpureum) is an herbaceous plant with high potential for use as a feedstock for biofuel processing. It has a high biomass yield compared to other energy grasses such as miscanthus, switchgrass, etc, typically in the range of 25–35 oven dry tons per hectare annually, which corresponds to 100 barrels of oil energy equivalent per hectare. Cultivation of Napier grass follows conventional farming practices. It outcompetes weeds, needs very little or no supplementary nutrients and therefore requires lower establishment costs. It can be harvested up to four times within a year with a ratio of energy output to energy input of around 25:1, hence making it one of the best potential energy crops for development of efficient and economic bioenergy systems [4]. Furthermore, our recent trials in the field have proved that Napier grass can be intercropped with oil palm. The study was conducted under 70% and 50% shade levels with a full sunlight treatment as control. The plant showed more potential for higher dry weights in shaded conditions due to its elongated stem which contained more biomass than the higher leaf biomass produced in unshaded conditions. This suggests that shaded Napier grass produces longer and thicker stems in an attempt to reach better quality light. Intercropping Napier grass with oil palm will offer higher biomass yield, minimize the unused spaces in the oil palm plantation (estimated at 26.63% of the total space) and bring added economic value to the oil palm industries.
its properties so as to be able to predict product compositions, yields, selectivity and co-products formed during conversion. The objective of this paper was to carry out a comprehensive characterization of the different parts of Napier grass for sustainable biofuel production.
2. Experiment
Fresh Napier grass stem (NGS), leaf (NGL) and stem and leaf (NGT) chopped 6 to 8 cm were collected from the Crops for the Future (CFF) Field Research Centre and transported in plastic bags to the research building of the University of Nottingham Malaysia campus. The materials were oven dried at 105 °C for moisture content determination according to the BS EN 14774-1 standard [9]. The dried materials were then shredded in a Retsch® rotor beater mill to particle sizes between 0.2 mm and 2 mm and stored in air tight plastic bags for further studies. Volatile matter and ash content on dry basis were determined according BS EN 15148 [10] and BS EN 14775 [11], respectively. Fixed carbon was computed by subtracting the percentage compositions of ash and volatile matter from the bone dry sample mass. Higher heating value (HHV) was determined using a Parr 6100 oxygen bomb calorimeter following BS EN 14918 [12]. The ash inorganic composition was determined using energy dispersive x-ray (EDX). Elemental compositions were determined using a LECO Corporation, USA CHNS analyzer (LECO Corporation, St Joseph, MI, USA). The structural analysis of the biomass was performed according to the procedure outlined in NREL/TP-510-42618 [13]. X-ray diffraction (XRD) was carried out to examine the crystalline systems present in each sample using PANalytical XpertPro (DSKH Technology Sdn Bhd, Selangor, Malaysia) (CuKα radiation, λ = 0.1541 nm) between 2Ө angle of 10°–60°
at 25 mA, 45 kV, step size of 0.025°and 1.0 s scan rate. Crystallinity index (CrI) was calculated using peak height method according to Equation (1) below [14]:
100 (%)
200 200
I I I
CrI am
(1)
where I200 and Iam is the intensity of crystalline and amorphous portion of the biomass respectively. The nature of chemical bonds and functional groups was evaluated by Fourier transform infrared spectroscopy (FTIR) on a PerkinElmer Spectrometer Spectrum RX1 instrument (Perkin Elmer Sdn Bhd, Selangor, Malaysia) using the potassium bromide (KBr) method. The translucent KBr discs (13 mm diameter) were made from homogenized 2 mg samples in 100 mg KBr using a CARVER press at 5.5 tons for 5 min. Spectra were recorded with the Spectrum V5.3.1 software within the wavenumber range of 400–4000 cm−1 at 32 scans and 4 cm−1 resolution. Pyrolysis characteristics of the samples were studied in a PerkinElmer Simultaneous Thermal Analyzer (STA) 6000 thermogravimetric analyzer (TGA) (Perkin Elmer Sdn Bhd, Selangor, Malaysia) in a nitrogen atmosphere, flow rate 20 mL/min at temperature between 300 K and 1100 K and heating rate of 10 K/min. About 10.0 mg of sample (with a particle size of 0.2 mm) was used.
3. Results and Discussion
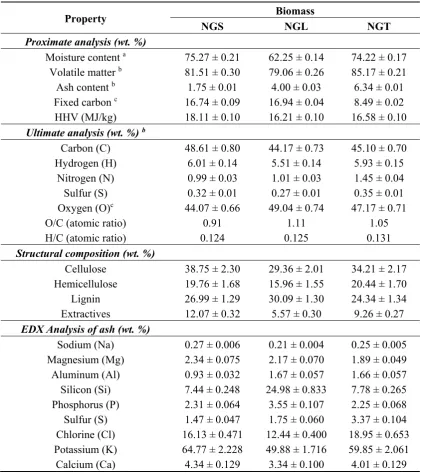
from leaf (NGL) having 62.25 wt. %. High volatile matter of 85.17 wt. %, 81.51 wt. % and 79.06 wt. % was recorded in the NGT, NGS and NGL, respectively. Ultimate analysis on a dry basis revealed that NGS has higher carbon (48.61 wt. %) and lower oxygen (44.07 wt. %) contents relative to NGT with 45.10 wt. % carbon, 47.17 wt. % oxygen and NGL (44.17 wt. % carbon, 49.04 wt. % oxygen).
Table 1. Proximate, ultimate, structural and ash characteristics of Napier grass (NGS, NGL and NGT).
Property Biomass
NGS NGL NGT
Proximate analysis (wt. %)
Moisture content a 75.27 ± 0.21 62.25 ± 0.14 74.22 ± 0.17
Volatile matter b 81.51 ± 0.30 79.06 ± 0.26 85.17 ± 0.21
Ash content b 1.75 ± 0.01 4.00 ± 0.03 6.34 ± 0.01
Fixed carbon c 16.74 ± 0.09 16.94 ± 0.04 8.49 ± 0.02
HHV (MJ/kg) 18.11 ± 0.10 16.21 ± 0.10 16.58 ± 0.10
Ultimate analysis (wt. %) b
Carbon (C) 48.61 ± 0.80 44.17 ± 0.73 45.10 ± 0.70
Hydrogen (H) 6.01 ± 0.14 5.51 ± 0.14 5.93 ± 0.15
Nitrogen (N) 0.99 ± 0.03 1.01 ± 0.03 1.45 ± 0.04
Sulfur (S) 0.32 ± 0.01 0.27 ± 0.01 0.35 ± 0.01
Oxygen (O)c 44.07 ± 0.66 49.04 ± 0.74 47.17 ± 0.71
O/C (atomic ratio) 0.91 1.11 1.05
H/C (atomic ratio) 0.124 0.125 0.131
Structural composition (wt. %)
Cellulose 38.75 ± 2.30 29.36 ± 2.01 34.21 ± 2.17
Hemicellulose 19.76 ± 1.68 15.96 ± 1.55 20.44 ± 1.70
Lignin 26.99 ± 1.29 30.09 ± 1.30 24.34 ± 1.34
Extractives 12.07 ± 0.32 5.57 ± 0.30 9.26 ± 0.27
EDX Analysis of ash (wt. %)
Sodium (Na) 0.27 ± 0.006 0.21 ± 0.004 0.25 ± 0.005
Magnesium (Mg) 2.34 ± 0.075 2.17 ± 0.070 1.89 ± 0.049
Aluminum (Al) 0.93 ± 0.032 1.67 ± 0.057 1.66 ± 0.057
Silicon (Si) 7.44 ± 0.248 24.98 ± 0.833 7.78 ± 0.265
Phosphorus (P) 2.31 ± 0.064 3.55 ± 0.107 2.25 ± 0.068
Sulfur (S) 1.47 ± 0.047 1.75 ± 0.060 3.37 ± 0.104
Chlorine (Cl) 16.13 ± 0.471 12.44 ± 0.400 18.95 ± 0.653 Potassium (K) 64.77 ± 2.228 49.88 ± 1.716 59.85 ± 2.061
Calcium (Ca) 4.34 ± 0.129 3.34 ± 0.100 4.01 ± 0.129
Notes: a As received at harvest; b dry basis; c by difference; (NGS) Napier grass stem; (NGL) Napier grass leaf
and (NGT) Napier grass stem and leaf.
trend of a typical biomass ash [7,15–17]. Result of structural analysis revealed that NGS has 38.75 wt. % cellulose, 19.76 wt. % hemicellulose and 26.99 wt. % lignin while 34.21 wt. %, 20.44 wt. %, 24.34 wt. % and 29.36 wt. %, 15.96 wt. %, 30.09 wt. % of cellulose, hemicellulose, lignin were recorded in NGT and NGL respectively. This structural characteristica are similar to those o obtained by Reddy et al. [5], and Lee et al. [8] and those of other warm season grasses such as switchgrass, Miscanthus, etc. [18,19].
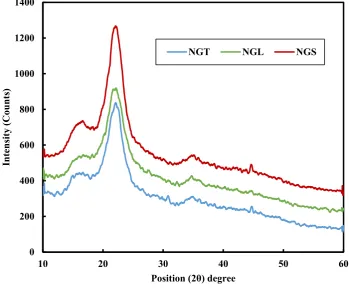
[image:6.595.126.476.331.619.2]The diffraction pattern (Figure 1) from the XRD study shows similar patterns for all the biomass samples with peaks at a 2Ө value of 22.16° (main peak), 15.81° and 35.10° (broad peaks) which reflect the crystalline system in the samples. These represent the crystallographic planes 200, 110 and 004, respectively, according to the native cellulose structure [20–23]. These characteristic peaks in the diffractogram are comparable to the Napier grass peaks identified by Reddy et al. [6]. The remaining components, mainly hemicellulose, lignin and extractives in the material are approximated to belong to the amorphous phase since no larger crystals are formed by these components [20,24]. The value of crystallinity index obtained using Equation (1) above was 79.15%, 76.14 and 75.41 for NGS, NGT and NGL correspondingly. This result shows good agreement with the structural analysis result.
Figure 1. X-ray diffractogram of Napier grass (NGT, NGS and NGL).
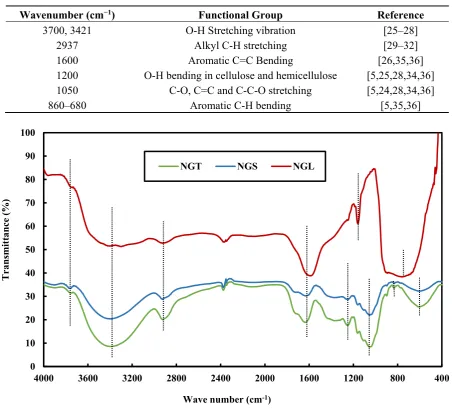
Table 2 below lists typical FTIR wavenumber bands for the biomass material. The averaged FTIR spectra (Figure 2) show similar characteristic peaks for all the biomass samples, with a region of high frequency between 4000 cm−1 and 2300 cm−1 and region of low frequency between 1626 cm−1 and 400 cm−1 which indicates the possible presence of different alkyl, aromatic, alcohol, ester and carbonyl functional
groups originating from the extractive, hemicellulose, cellulose and lignin components of all the biomass. In the high frequency region, peaks in the samples between 3700 cm−1 and 3421 cm−1 can be attributed to different hydroxyl group (alcohol/phenol) stretching vibrations [25–28]. The band at 2937 cm−1
0 200 400 600 800 1000 1200 1400
10 20 30 40 50 60
Intensity (Counts)
Position (2θ) degree
could be a result of aliphatic saturated C-H stretching vibrations (asymmetric and symmetric methyl and methylene stretching groups) from extractives and lignin components of the biomass since fatty acid methyl esters and phenolic acid methyl esters, have methyl and methylene groups [29–32]. In the fingerprint region, the band at 1600 cm−1 may be due to the ring-conjugated C=C bonds of lignin while the band observed at 1200 cm−1 may be an indication of O-H bending in the cellulose and hemicellulose components of the biomass [5,25,26,28,33–36]. The frequency at 1,050 cm−1 may be ascribed to C-O, and C=C, and C-C-O stretching in cellulose, hemicelluloses and lignin [25,28,34,36] while the bands between 800 and 600 cm−1 may be attributed to aromatic C-H bending vibrations from the lignin in the samples [5,35,36].
Table 2. FTIR wavenumber bands in biomass material.
Wavenumber (cm−1) Functional Group Reference
3700, 3421 O-H Stretching vibration [25–28]
2937 Alkyl C-H stretching [29–32]
1600 Aromatic C=C Bending [26,35,36]
1200 O-H bending in cellulose and hemicellulose [5,25,28,34,36]
1050 C-O, C=C and C-C-O stretching [5,24,28,34,36]
860–680 Aromatic C-H bending [5,35,36]
Figure 2. Averaged FTIR spectra (auto-smoothed and auto-baseline corrected) of Napier grass samples (NGT, NGS and NGL).
Thermogravimetric analysis revealed thermal decomposition of various structural components of NGS, NGT and NGL (Figure 3). Point (a) at 478 K is attributed to decomposition of extractives while (b) and (c) correspond to decomposition of hemicellulose at temperatures 543 K and cellulose at 600 K,
0 10 20 30 40 50 60 70 80 90 100
400 800
1200 1600
2000 2400
2800 3200
3600 4000
Transmittance (%
)
Wave number (cm-1)
respectively. Beyond 600 K, point (d), indicates the decomposition of lignin. Considering decomposition intensity of the main peaks (cellulose), reaction intensities of 5.3, 6.0 and 6.6 wt. %/K were recorded for NGS, NGT and NGL in that order. The lower value for NGS may be attributed to w high amount of alkali metals, particularly potassium, in the biomass (see Table 1) since high levels of alkali metals tends to reduce the cellulose decomposition rate during pyrolysis [36–39]. A noticeable peak was observed in the lignin decomposition region of NGT at 730 K and NGL at 880 K while none was observed in NGS. Consequently, it can be deduced that the lignin content of NGS has similar decomposition pathways while the change observed in the NGT and NGL may be attributed to different oxygen functional groups present in the lignin component of the respective biomass sanmples. The decomposition temperature values of different parts of the Napier grass in this study are in good agreement with literature values of 373–523 K, 523–623 K, 623–773 K and above 773 K for extractives, hemicellulose, cellulose and lignin, respectively [6,36,39].
Figure 3. Residual mass ratio and DTG of Napier grass on dry basis. (NGT) Napier grass stem and leaf, (NGS) Napier grass stem, (NGL) Napier grass leaf. (a) Extractives; (b) Hemicellulose; (c) Cellulose; and (d) lignin decompositions respectively. Condition: nitrogen atmosphere (20 mL/min), heating rate (10 K/min).
Biomass decomposition can be represented by the Equation (2) below:
) ( ) ( )
( g s
k
s V Rs
B (2)
where B: solid biomass; V: volatiles and Rs: residual solid. k: decomposition rate constant. From solid state chemistry, the rate of reaction can be written as [40]:
) ( ) ( b
b k T f x
dt dx
The rate constant k is a function of temperature and generally represented by the Arrhenius equation and f (xb) is expressed in form of reaction order model. Equation (3) then becomes:
) 1 ( RT E n b
b x Ae
dt
dx
(4)
For a non-isothermal process at constant heating rate (β), Equation (4) can be transformed as given in Equation (5):
(1 ) RTE n
b b
b
b x Ae
dT dx dt dT dT dx dt dx
(5)
Taking the natural logarithm of Equation (5) and rearranging, we obtain Equation (6). A plot of right hand side versus 1/T will give a straight line for a particular reaction order. The kinetic parameters; frequency factor, A (min−1) and activation energy, E (kJ/mol) can be obtained from the intercept and slope of the graph. R is the general gas constant (8.314 J/mol·K):
R T
E A x dT dx n b b 1 ln ) 1 ( ln ) 6 ( 1 ; 1 1 1 1 1 ratio conversion K K m m m m m m m m
x t t
o o t o t o
b (7)
where the terms mo, mt, and m∞ are the initial sample mass, mass remaining at any time (t) and residual
mass at the end of pyrolysis, respectively.
From Equation (7), we need to develop the limit for dxb/dT and relate it to the experimental data:
t
t
tt
b d d d
K d
dx
K 1 0 K 1 1 K 1 1 (8)
From the above t
o t o t t dm m d m
m 1
and Equation (8) now becomes:
dT dm m dT dx t o b 1 K 1 (9)
But
K
dT dw
DTG %/ and
% 100o t
m m w
K
dT dw m dT
dmt o
/ % 100
(10 )
Substituting Equation (10) in (9), we have:
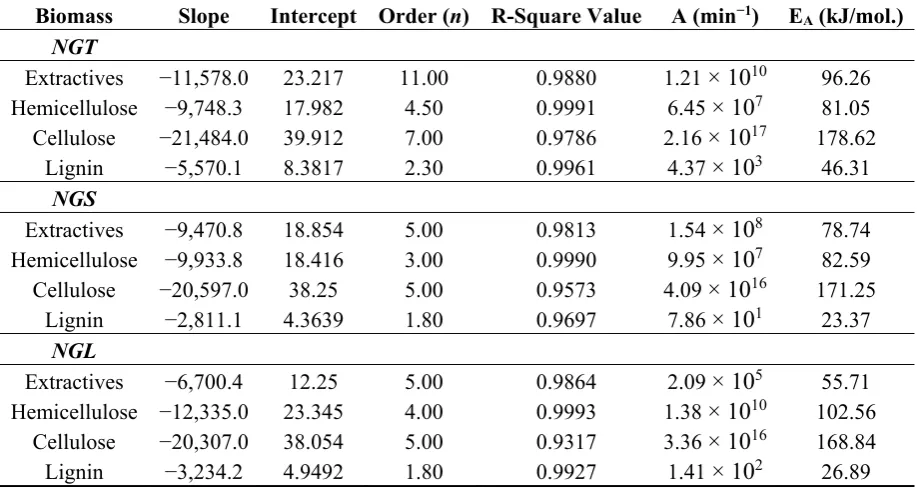
The experimental data were fitted to the straight line model presented in the Equation (6) above for different components in the biomass as identified in the DTG curves in Figure 3 above. Summarized kinetic parameters such as activation energy, frequency factor and reaction order are given in Table 3. The lignin decomposition NGS and NGL biomass samples followed a reaction order of 1.8 while a 2.3 reaction order was recorded for NGT. The activation energy was between 23.37 and 46.31 kJ/mol which was lower than that of the remaining components. This observation may be attributed to mass and heat transfer effects. Similar lower values of activation energy of lignin decomposition have been reported in the literature [41–45]. Similarly, the cellulose and extractives decompositions of NGS and NGL biomass obeyed the same reaction order of 5, whereas NGT followed 7 and 11 reaction orders for cellulose and extractives. High activation energies of 178.62, 171.25 and 168.84 kJ/mol were recorded for cellulose in NGT, NGS and NGL, respectively. The higher value of activation energy of cellulose may be linked to the high crystallinity index recorded in the samples which generally tends to inhibit cellulose degradation due to resistance to heat diffusion [36,37,46,47]. This observation is also in agreement with our previous study where pretreated biomass produced higher activation energy compared to the untreated sample due to increased crystallinity brought about by the pretreatment [39]. On the other hand, the reaction orders for hemicellulose varied across all the biomass samples: orders of 4.5, 3 and 5 were recorded for hemicellulose decomposition in NGT, NGS and NGL, respectively with corresponding activation energy of 81.05, 82.59 and 102.56 kJ/mol.
Table 3. Kinetic parameters of pyrolysis Napier grass (NGT, NGS and NGL) under nitrogen atmosphere (20 mL/min) and heating rate of 10 K/min using reaction order model.
Biomass Slope Intercept Order (n) R-Square Value A (min−1) E
A (kJ/mol.)
NGT
Extractives −11,578.0 23.217 11.00 0.9880 1.21 × 10¹⁰ 96.26
Hemicellulose −9,748.3 17.982 4.50 0.9991 6.45 × 10⁷ 81.05
Cellulose −21,484.0 39.912 7.00 0.9786 2.16 × 10¹⁷ 178.62
Lignin −5,570.1 8.3817 2.30 0.9961 4.37 × 10³ 46.31
NGS
Extractives −9,470.8 18.854 5.00 0.9813 1.54 × 10⁸ 78.74
Hemicellulose −9,933.8 18.416 3.00 0.9990 9.95 × 10⁷ 82.59
Cellulose −20,597.0 38.25 5.00 0.9573 4.09 × 10¹⁶ 171.25
Lignin −2,811.1 4.3639 1.80 0.9697 7.86 × 101 23.37
NGL
Extractives −6,700.4 12.25 5.00 0.9864 2.09 × 10⁵ 55.71
Hemicellulose −12,335.0 23.345 4.00 0.9993 1.38 × 10¹⁰ 102.56
Cellulose −20,307.0 38.054 5.00 0.9317 3.36 × 10¹⁶ 168.84
Lignin −3,234.2 4.9492 1.80 0.9927 1.41 × 10² 26.89
n n n n n NGT b b b b RT E b b b b RT E b x x x x e A x x x x e A dT dx 2 ) 2 5 ( 2 2 ) 1 2 ( 1 2 3 . 2 7 5 . 4 11 ) 1 ( ) 1 ( ) 1 ( ) 1 ( ) 1 ( ) 1 ( ) 1 ( ) 1 ( (12)
n n n n n NGS b b b b RT E b b b b RT E b x x x x e A x x x x e A dT dx ) 1 2 ( 2 8 . 1 5 3 5 ) 1 ( ) 1 ( ) 1 ( ) 1 ( ) 1 ( ) 1 ( ) 1 ( ) 1 ( (13)
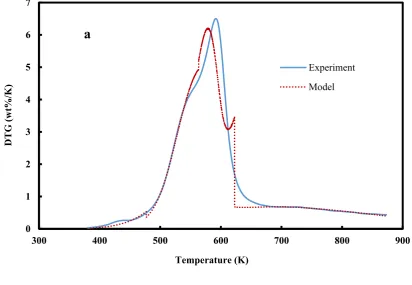
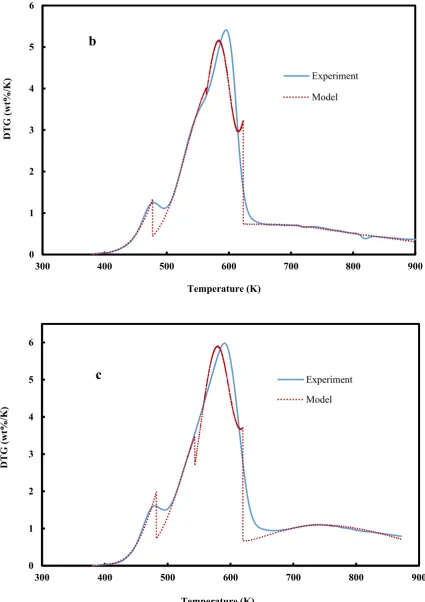
n n n n n NGL b b b b RT E b b b b RT E b x x x x e A x x x x e A dT dx ) 1 2 ( 1 8 . 1 5 4 5 ) 1 ( ) 1 ( ) 1 ( ) 1 ( ) 1 ( ) 1 ( ) 1 ( ) 1 ( (14) [image:11.595.75.488.443.728.2]where n5and the first, second, third and fourth term of Equations (12)–(14) represent the rate of conversion of extractives, hemicellulose, cellulose and lignin at temperatures between 373–473 K, 473–573 K, 573–673 K and >673 K, respectively. Using these models with the kinetic parameters obtained above, predicated DTG data was obtained using the relation in Equation (11). The predicated DTG was compared with the experimental DTG as shown in Figure 4 below. The result showed that the models described well the pyrolysis process of the different components of Napier grass biomass.
Figure 4.Cont.
0 1 2 3 4 5 6 7
300 400 500 600 700 800 900
Figure 4. Comparison between Experimental and Predicted DTG curves of Napier Grass Biomass. (a) NGL; (b) NGS; (c) NGT.
0 1 2 3 4 5 6
300 400 500 600 700 800 900
DTG (w
t%
/K)
Temperature (K)
Experiment
Model
b
0 1 2 3 4 5 6
300 400 500 600 700 800 900
DTG (w
t%
/K)
Temperature (K)
Experiment
4. Conclusions
Napier grass leaf (NGL), stem (NGS) and leave and stem (NGT) were characterized. Proximate and ultimate analyses revealed that the materials have high volatile matter contents, higher heating value, high carbon content and lower ash, nitrogen and sulfur contents. Structural composition showed that Napier grass biomass has considerable cellulose and lignin contents which makes it a good candidate for good quality bio-oil production. However, some levels of extractives and hemicellulose were also recorded. The biomass ash consists mainly of the elements potassium, chlorine and silicon. These minerals, together with extractives and hemicellulose, may be reduced through a pretreatment step prior to the pyrolysis process. The pyrolysis characteristics from the thermogravimetric studies under nitrogen atmosphere of 20 mL/min at constant heating rate of 10 K/min showed that degradation of extractives, hemicellulose, cellulose and lignin occurred at temperatures around 478 K, 543 K, 600 K and above 600 K, respectively. The kinetics of the process were evaluated using a reaction order model. Higher activation energy was recorded for the decomposition of cellulose. This was attributed to the high level of crystallinity in the materials. Some models were developed using the kinetic parameters and the data compared with the experimental data. The results of the models fit well to the experimental data. The proposed models may be a reliable means for describing the thermal decomposition of other lignocellulosic biomass samples under nitrogen atmosphere at constant heating rate, which shall be the focus of our next study.
Acknowledgments
The project was supported by the Crops for the Future (CFF) and University of Nottingham under the grant BioP1-005.
Conflicts of Interest
The authors declare no conflict of interest.
References
1. Margeot, A.; Hahn-Hagerdal, B.; Edlund, M. New improvements for lignocellulosic ethanol.
Curr. Opin. Biotechnol.2009, 20, 372–380.
2. Nigam, P.S.; Singh, A. Production of liquid biofuels from renewable resources. Prog. Energy Combust. Sci.2011, 37, 52–68.
3. Srirangan, K.; Akawi, L.; Moo-Young, M. Towards sustainable production of clean energy carriers from biomass resources. Appl. Energy 2012, 100, 172–186.
4. Samson, R.; Mani, S.; Boddey, R. The potential of C4 perennial grasses for developing a global bioheat industry. Crit. Rev. Plant Sci.2005, 24, 461–495.
5. Reddy, K.O.; Maheswari, C.U.; Shukla, M.; Rajulu, A.V. Chemical composition and structural characterization of Napier grass fibers. Mater. Lett.2012, 67, 35–38.
6. Reddy, K.O.; Maheswari, C.U.; Reddy, D.J.P.; Rajulu, A.V. Thermal properties of Napier grass fibers. Mater. Lett.2009, 63, 2390–2392.
8. Lee, M.-K.; Tsai, W.-T.; Tsaic, Y.-L.; Lin, S.-H. Pyrolysis of Napier grass in an induction-heating reactor. J. Anal. Appl. Pyrolysis2010, 88, 110–116.
9. Solid Biofuels. Determination of Moisture Content. Oven Dry Method. Total Moisture. Reference Method; BS EN 14774-1; British Standards Institution: London, UK, 2009.
10. Solid Biofuels. Determination of the Content of Volatile Matter; BS EN 15148; British Standards Institution: London, UK, 2009.
11. Solid Biofuels. Determination of Ash Content; BS EN 14775; British Standards Institution: London, UK, 2009.
12. Solid Biofuels. Determination of Calorific Value; BS EN 14918; British Standards Institution: London, UK, 2009.
13. Sluiter, A.; Hames, B.; Ruiz, R.; Scarlata, C.; Sluiter, J.; Templeton, D.; Crocker, D. Determination of structural carbohydrates and lignin in biomass. In Laboratory Analytical Procedure,
NREL/TP-510-42618; National Renewable Laboratory: Golden, CO, USA, 2012.
14. Segal, L.; Creely, L.; Martin, A.E.; Conrad, C.M. An empirical method for estimating the degree of crystallinity of native cellulose using X-ray diffractometer. Text. Res. J.1959, 29, 786–794.
15. Vassilev, S.V.; Baxter, D.; Andersen, L.K.; Vassileva, C.G. An overview of the chemical composition of biomass. Fuel2010, 89, 913–933.
16. Lindberg, D.; Backman, R.; Chartrand, P.; Hupa, M. Towards a comprehensive thermodynamic database for ash-forming elements in biomass and waste combustion—Current situation and future developments. Fuel Process. Technol.2013, 105, 129–141.
17. Yeboah, N.N.N.; Shearer, C.R.; Burns, S.E.; Kurtis, K.E. Characterization of biomass and high carbon content coal ash for productive reuse applications. Fuel 2014, 116, 438–447.
18. Bioenergy System Planners Handbook. Available online: http://bisyplan.bioenarea.eu/html-files-en/04-02.html (accessed on 23 April 2015).
19. DoKyung, L.; Vence, N.O.; Arvid, B.; Peter, J. Composition of herbaceous biomass feedstocks. In
Sun Grant Initiative 2007; North Dakota University: Brookings, SD, USA, 2007.
20. Wada, M.; Okano, T.; Sugiyama, J. Allomorphs of native crystalline cellulose I evaluated by two equatorial d-spacings. J. Wood Sci.2001, 47, 124–128.
21. Park, S.; Baker, J.O.; Himmel, M.E.; Parilla, P.A.; Johnson, D.K. Cellulose crystallinity index: Measurement techniques and their impact on interpreting cellulase performance. Biotechnol. Biofuels 2010, 3, 4–10.
22. Poletto, M.; Pistor, V.; Zattera, A.J. Structural characteristics and thermal properties of native cellulose. In Cellulose-Fundamental Aspects; van de Ven, T., Gdbout, L., Eds.; InTech.: Caxias do Sul, Brazil, 2013; pp. 45–68.
23. Timpano, H.; Sibout, R.; Devaux, M.-F.; Alvarado, C.; Looten, R.; Pontoire, B.; Martin, M.; Legée, F.; Cézard, L.; Lapierre, C.; et al. Brachypodium cell wall mutant with enhanced saccharification potential despite increased lignin content. Bioenerg. Res.2014, doi:10.1007/s12155-014-9501-1. 24. Cheng, G.; Varanasi, P.; Li, C.; Liu, H.; Melnichenko, Y.B.; Simmons, B.A.; Kent, M.S.; Singh, S.
25. Yang, H.; Yan, R.; Chen, H.; Lee, D.H.; Zheng, C. Characteristics of hemicellulose, cellulose and lignin pyrolysis. Fuel2007, 86, 1781–1788.
26. Xu, F.; Yu, J.; Tesso, T.; Dowell, F.; Wang, D. Qualitative and quantitative analysis of lignocellulosic biomass using infrared techniques: A mini-review. Appl. Energy2013, 104, 801–809.
27. Nazir, M.S.; Wahjoedi, B.A.; Yussof, A.W.; Abdaulla, M.A. Eco-friendly extraction and characterization of cellulose from oil palm empty fruit bunches. BioResources2013, 8, 2161–2172. 28. Lupoi, J.S.; Singh, S.; Simmons, B.A.; Henry, R.J. Assessment of lignocellulosic biomass using analytical spectroscopy: an evolution to high-throughput techniques. Bioenergy Res.2014, 7, 1–23. 29. Yokoi, H.; Nakase, T.; Goto, K.; Ishida, Y.; Ohtani, H.; Tsuge, S.; Sonoda, T.; Ona, T. Rapid
characterization of wood extractives in wood by thermal desorption-gas chromatography in the presence of tetramethylammonium acetate. J. Anal. Appl. Pyrolysis2003, 67, 191–200.
30. Ishida, Y.; Goto, K.; Yokoi, H.; Tsuge, S.; Ohtani, H.; Sonoda, T.; Ona, T. Direct analysis of phenolic extractives in wood by thermochemolysis-gas chromatography in the presence of tetrabutylammonium hydroxide. J. Anal. Appl. Pyrolysis2007, 78, 200–206.
31. Mészáros, E.; Jakab, E.; Várhegyi, G. TG/MS, Py-GC/MS and THM-GC/MS study of the composition and thermal behavior of extractive components of Robinia pseudoacacia. J. Anal. Appl. Pyrolysis2007, 79, 61–70.
32. Plis, A.; Lasek, J.; Skawinska, A.; Kopczynski, M. Thermo-chemical properties of biomass from
Posidonia Oceanica. Chem. Pap.2014, 68, 879–889.
33. Naik, S.; Goud, V.V.; Rout, P.K.; Jacobson, K.; Dalai, A.K. Characterization of Canadian biomass for alternative renewable biofuel. Renew. Energy2010, 35, 1624–1631.
34. Nanda, S.; Mohanty, P.; Pant, K.K.; Naik, S.; Kozinski, J.A.; Dalai, A.K. Characterization of north american lignocellulosic biomass and biochars in terms of their candidacy for alternate renewable fuels. Bioenergy Res.2013, 6, 663–677.
35. Qian, K.; Kumar, A.; Patil, K.; Bellmer, D.; Wang, D.; Yuan, W.; Raymond, L.; Huhnke, R.L. Effects of biomass feedstocks and gasification conditions on the physiochemical properties of char.
Energies2013, 6, 3972–3986.
36. Sills, D.L.; Gossett, J.M. Using FTIR to predict saccharification from enzymatic hydrolysis of alkali-pretreated biomasses. Biotechnol. Bioeng.2012, 109, 353–362.
37. Raveendra, K.; Ganesh, A.; Khilar, K.C. Pyrolysis characteristics of biomass and biomass
components. Fuel1996, 75, 987–998.
38. Hagedorn, M.M.; Bockhorn, H.; Krebs, L.; Muller, U. A comparative kinetics study on the pyrolysis of three different wood species. J. Anal. Appl. Pyrolysis2003, 68–69, 231–249.
39. Biwas, A.K.; Umeki, K.; Yang, W.; Blasiak, W. Change of pyrolysis characteristics and structure of wood biomass due to steam explosion pretreatment. Fuel Process. Technol.2011, 92, 1849–1854. 40. Mohammed, I.Y.; Abakr, Y.A.; Kabir, F.; Yusuf, S. Effect of aqueous pretreatment on pyrolysis
characteristics of napier grass. J. Eng. Sci. Technol.2015, in press.
41. Khawam, A.; Flanagan, D.R. Solid-state kinetic models: Basics and mathematical fundamentals.
J. Phys. Chem. B2006, 110, 17315–17328.
43. Teng, H.; Wei, Y.-C. Thermogravimetric studies on the kinetics of rice hull pyrolysis and the influence of water treatment. Ind. Eng. Chem. Res.1998, 37, 3806–3811.
44. Orfao, J.J.M.; Antunes, F.J.A.; Figueiredo, J.L. Pyrolysis kinetics of lignocellulosic materials— Three independent reactions model. Fuel1999, 78, 349–358.
45. Brebu, M.; Vasile, C. Thermal degradation of lignin—A review. Cellul. Chem. Technol.2010, 44, 353–363.
46. Chen, W.-H.; Kuo, P.-C. Isothermal torrefaction kinetics of hemicellulose, cellulose, lignin and xylan using thermogravimetric analysis. Energy2011, 36, 6451–6460.
47. Braga, R.M.; Costa, T.R.; Freitas, J.C.O.; Barros, J.M.F.; Melo, D.M.A.; Melo, M.A.F. Pyrolysis kinetics of elephant grass pretreated biomasses. J. Therm. Anal. Calorim.2014, 117, 1341–1348.