Social Participation, Personal Travel and
Internet Use
Glenn Lyons, University of the West of England
Susan Kenyon, University of the West of England
Conference paper
Session XXX
Moving through nets:
The physical and social dimensions of travel
Social Participation, Personal Travel and Internet Use
Glenn Lyons / Susan Kenyon
Unit for Transport and Society, Faculty of the Built Environment University of the West of England
Bristol, UK
Phone: +44 117 344 3219 Fax: +44 117 344 3899
Email: Glenn.Lyons@uwe.ac.uk Email: Susan.Kenyon@uwe.ac.uk
Abstract
Internet access and use in Great Britain and in many other countries around the world has increased dramatically in a very short space of time. That this communications medium can provide access to opportunities, services, social networks and other goods makes the nature and scale of its current and potential future impacts on society hugely significant. It should therefore be of considerable concern that monitoring and understanding of such impacts is failing to keep pace with developments which in turn seriously impedes the opportunities for informed policy interventions. In providing a means of access, the Internet has the potential to improve or change people’s quality of life and also to change levels and patterns of the alternatives means of access, notably personal travel. This paper reports on a GB survey which marks the first stage in a three year project which is seeking to begin addressing the gap in data and understanding concerning the (evolving) links between social participation, personal travel and Internet use. The results presented are based on responses from 1028 GB weekly Internet users to an online questionnaire survey. Presentation of results consider behaviour and attitudes concerning personal travel, Internet use and links between the two. Key findings relate to the growing array of online activities, access to which people believe is improving their quality of life. The suggestion is made that further to the prevalence of car dependence within society, the phenomenon of Internet dependence may now be emerging. Contrary to expectations, the motivation to engage in online rather than offline activities is derived in many cases not from the attraction of saving travel time but, it appears, from the activity time saving. Nevertheless, not only is the Internet improving access without increasing personal travel, stated intentions suggest that online activities have already become sufficient in quality and scope to offer a viable alternative or substitute to offline activities and associated physical travel, particularly if traffic restraint or the cost of travel were to be increased.
Keywords
Social exclusion, Internet access and use, personal travel, telecommunications-transport interactions
Preferred citation
1. Introduction
1.1 Internet – the new communications medium
The rapid growth in Internet use across the Western world has excited much speculation about the potential cultural, economic, political, social and infrastructural impacts of the technology. It is the rapid pace at which the Internet has spread into businesses, homes, government and public spaces, largely ungoverned and uncontrolled, which underlies much of the concern about these impacts. In Great Britain1, data from the Office for National Statistics (ONS) suggest that two thirds of the adult population had accessed the Internet at some time by February 2003. In just four years, the percentage of households with access to the Internet has increased by 500 per cent, from 9 per cent in December 1998 to 45 per cent in December 2002 (ONS, 2003a). And the technology is pervasive: the majority of those with access at home use the Internet more than once a week. The importance of the Internet in the workplace has also grown, with an estimated 90 per cent of UK businesses with more than ten in employment now online (ONS 2002)2. Whilst rates of growth in Internet access now appear to be slowing in the UK, as traditional barriers to communications technologies begin to take effect, the UK government is committed to extending Internet access via no or low cost access schemes, including the UK Online and Wired Up Communities initiatives, such that universal Internet access is achieved by 2005 (Hudson, 2003).
The penetration of other key communications technologies (for example, the car, printed word, telephone, television) has been easily controlled and slowed by educated, ruling or wealthier sectors in society; the pace also slowed by natural and imposed barriers to access (including cost, literacy, regulation). Thus, there has been good opportunity to monitor and manage the effects of the technologies. However, the penetration of the Internet into society has been so fast that the monitoring and tracking of the effects has been unable to keep pace with the changes that Internet access is affecting. Thus, the effects of Internet use are largely unknown. This data gap has resulted in a great deal of speculation, perpetuated by academia,
1This paper draws conclusions for the UK as a whole. However, the reader should note that the survey
undertaken, in common with figures from ONS, covers Great Britain (England, Scotland, Wales) only, not the UK (GB, plus Northern Ireland).
2
government, the media and society as a whole, regarding the impact of Internet use upon culture, economy, politics, society and infrastructure in the UK.
1.2 Internet use and personal travel
In transport, the effects of information and communication technologies (ICTs) have long been discussed. Even before the advent and widespread use of the Internet, Mokhtarian (1990), drawing on the work of Salomon (1986) hypothesised four possible relationships.
Firstly, substitution, where the use of telecommunications acts to decrease travel. Secondly, enhancement, where the use of telecommunications stimulates travel. Third, improved operational efficiency – that is, that the use of telecommunications increases the efficiency of the transport network, enabling its more effective use. Fourth, the indirect, long term impacts of ICT upon travel, for example, where telecommunications lead to changes in land use patterns, or population distributions, which then affect travel.
Prior to the Internet, it has been observed that previous telecommunications media have not, apparently, reduced the amount of personal travel. It is certainly true that levels of personal travel have increased in parallel with increasing levels of telecommunications use. What remains unclear, however, is the extent to which levels of personal travel are related to levels of telecommunications use. Some commentators subscribe to the view that telecommunications use is, overall, stimulating travel. An alternative view is that telecommunications use is dampening levels of personal travel which are, nevertheless, continuing to increase for other reasons. Concern has also been expressed (Lyons, 2002) that commentators are making reference to the net effect of telecommunications use on levels of personal travel. No net effect does not equate to no effect – patterns of travel may still be changed in ways that could be significant.
1.3 Internet use and social participation
The discussion regarding the social effects of Internet use is similarly affected by a lack of sufficient and comprehensive data, such that the debate is highly polarised. Unsurprisingly, the debate is more emotive and popularly appealing than that regarding the transport effects of Internet use and as such, it has been played out not only in academia, but in the media and in society as a whole. Such concerns centre around differential access to the technology (the 'digital divide') and community and social effects. The former concerns the exacerbation of social exclusion, largely based on financial and skills gaps, through increased Internet use. The latter includes concern regarding decline of human relations; a decline in the importance of face-to-face and physical contact; an increase in social isolation; deception and misrepresentation in the online world; and the decline of community (for example, Cornwell and Lundgren, 2001; Hamburger and Ben-Artzi, 2000). Other commentators, however, suggest that online activity boosts social contact and community well being (including Baym, 1995; Negroponte, cited in Schon, 1999; Rheingold, 2000) and discuss the possibility that ICT could be used as a tool of social policy (Hudson, 2003; Selwyn, 2002). There is little writing of substance that suggests that either side of the debate has the upper hand, a problem that can again be attributed to the lack of data in this area.
1.4 Internet use, social participation and personal travel
This paper reports on research that seeks to begin to address the data gap in relation to both the transport and social effects of Internet use. The research is UK-based and, henceforth, this paper will discuss findings in the UK context. The research links the concerns regarding the transport and the social effects of Internet use with concerns regarding the social effects of transport and 'hypermobility' (Adams, 2000). The links between transport and social exclusion in the UK have been well researched over the past decade (for a review, see Kenyon, Lyons and Rafferty, 2002), with governmental concern culminating in the publication this year of Making the Connections (SEU, 2003), a policy position paper documenting the community, health and social effects of culturally and infrastructurally-imposed car dependence. The document identifies five principal barriers to access to transport. Suggested policy initiatives are thus focussed around these five areas, of which all but one focus upon the facilitation and encouragement of an increase in mobility, a policy proposition that is likely to worsen the mobility burden and, in turn, social exclusion (Kenyon, 2003).
and other goods. Currently, mention of the Internet as a mode of access in UK government policy documents is noticeable by its absence (see, for example, the Ten Year Plan for Transport (DETR, 2000a); and Making the Connections (SEU, 2003)). In assessing the transport and social impacts of the Internet, this research aims to provide an evidence-based indication of the possibility that virtual mobility could be considered as part of an integrated transport policy that has reduced social exclusion as an aim.
Research concerning the Internet is changing. Traditional thinking on the social effects of Internet use is being challenged, as more evidence is collated and as time passes, allowing the dust to settle following the Internet's 'explosion' in Western society. Ideologically-based presumptions about the net's impact are giving way to evidence-based observations. This can be seen in research into the digital divide, where a recent publication (Lenhart, 2003) highlights the prevalence of self-exclusion from the Internet amongst those who do not have Internet access, rather than the externally-imposed exclusion that has been at the root of efforts to tackle non-access. As data banks expand and use of the Internet matures, there is every reason to suggest that traditional thinking on the impacts of ICTs upon transport – the majority of which were developed prior to the Internet explosion – will be similarly challenged. Recent qualitative research, which focuses upon the Internet (Kenyon, Rafferty and Lyons, 2003) has begun to challenge theories regarding Internet-personal travel interactions, suggesting in fact that an alternative effect may be experienced: the substitution of additional trips by Internet use, thus the levelling out or dampening of transport growth alongside an increase in Internet use. However, conclusive evidence is needed to support this hypothesis.
The quantitative research reported in this paper is part of an Engineering and Physical Sciences Research Council (EPSRC) funded research project, entitled: 'INTERNET: Investigating New Technology's Evolving Role, Nature and Effects for Transport'3. This is a three-year project, consisting of two waves of a national, online survey completed by 1000+ GB weekly Internet users aged 16+ and a longitudinal panel survey, consisting of activity diaries completed in four six-monthly waves by up to 100 participants in key demographics across the UK. INTERNET builds upon a one-year, EPSRC-funded study entitled: 'Virtual mobility: implications for accessibility, social exclusion and travel'4. This study used qualitative research methods, including focus groups, interviews, participant observation and
3 http://www.transport.uwe.ac.uk/research/projects/internet.htm
4
a one-day workshop with experts. The study found that, whilst virtual mobility is being used to substitute for some travel (or, more specifically, physical access to activities outside of the home), its primary use is in supplementing travel. That is, that it is being used to provide access to opportunities, services, social networks and other goods from which people have previously been excluded, because of lack of access to physical mobility. Therefore, virtual mobility appears to be substituting for an increase in physical mobility – an option which does not appear to have been considered in the hypothesised effects of virtual mobility, discussed above. Findings are reported in full in Kenyon et al, 2002 and Kenyon et al, 2003 and form the basis of the research currently being undertaken.
This paper now turns to consider the first national survey undertaken as part of this research. The paper firstly outlines the methodological approach. Results are presented, firstly with reference to transport behaviour and attitudes, then Internet behaviour and attitudes and finally Internet use and personal travel. In each of these areas, summarising remarks are drawn out which then lead to a discussion of the survey findings. This includes some references to respondent characteristics in relation to survey responses.
2. Methodology
2.1 Aims and objectives
The INTERNET project is seeking to reconcile two requirements. Firstly, a need to better understand, at the level of the individual, how Internet use and personal travel relate to one another in the context of access and social engagement. Secondly, to be able to offer commentary at the aggregate level on the implications of Internet use for personal travel and in turn for transport policy.
In this context the first stage of the INTERNET project consists of a national self-completion questionnaire survey with the following objectives:
• to gather information from a representative sample of Internet users in GB;
• to establish, broadly, the travel behaviour of the sample in terms of mode use and activities undertaken outside the home;
• to elicit attitudes to personal travel;
• to elicit attitudes to Internet use; and
• to assess respondent views concerning the interaction or not between Internet use and personal travel.
The intention was that such a survey would, in its own right, yield useful findings concerning Internet use and personal travel but also that it will provide insights and guidance for the subsequent panel survey which will seek to probe more deeply, at the individual level, into such issues.
2.2 Survey design
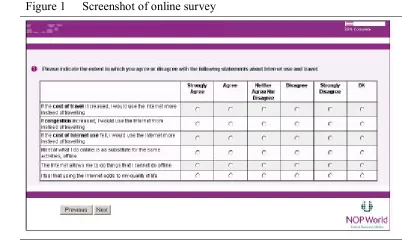
[image:8.595.86.488.464.715.2]The decision was taken to conduct an online survey, to be distributed by National Opinion Polls (NOP), via their e-omnibus5. Whilst online surveys are new to many, they are certainly not untested. For the purposes of this research, an online survey was judged to be both time and cost effective. In placing the survey online, it could be distributed and results received within seven days; it could be targeted at a key demographic sample; and over 1,000 responses was guaranteed. Results are automatically entered into a database, eliminating the time and cost of data input.
Figure 1 Screenshot of online survey
5
The onscreen layout of the survey has been usability tested by NOP. A sample screen is shown in Figure 1. There is one question per screen, to minimise vertical scrolling. Horizontal scrolling is avoided. This said, each question can contain multiple responses, such that up to ten sub questions can be included in a single question, on a single screen. Key features include the use of radio buttons to indicate responses; the inability of the respondent to enter a null response; the ability to leave the survey incomplete and return to it at a later date; and the inclusion of a 'percentage complete' indicator, informing the respondent of their place in the survey. An additional benefit is that questions can be filtered, ensuring that the questionnaire is more respondent-friendly. Whilst NOP was responsible for distribution of the survey and for the design of the onscreen layout, all questions were designed by the authors.
5,700 members of a panel of GB-based weekly Internet users, aged 16+, were contacted by NOP during the period 17-20 March, 2003. Panellists received an email requesting that they take part in a survey. A URL (web address) in the email, specific to the respondent, then links directly to a web page hosted on a secure server. The respondent's identification is therefore noted without respondent input, allowing NOP access to key demographic data about each respondent. These personal data are stored separately, to ensure anonymity of response. Survey response rates are monitored by NOP and distribution is staged, according to response rates. If key demographic groups (including age and gender) are under-responding, they are targeted in subsequent waves of the distribution. NOP maintains an Internet User Survey Profile (IUSP). The IUSP, which is based on NOP’s biannual Internet User Survey, defines the makeup of the GB weekly Internet user population in terms of the key demographics considered. In effect, therefore, stratified random sampling was employed with the online survey. 1028 responses were received.
2.3 Survey sample
The NOP survey is only distributed to weekly Internet users aged 16+, who are resident in Great Britain6. The following sections discuss the extent to which the respondents are representative of weekly Internet users and of the national population. Percentage comparisons with similar surveys are given in Table 1.
6
Table 1 Comparison of survey sample with national populations (weekly Internet users and general population)
Characteristic Survey sample (per cent)
Weekly Internet users7
(per cent)
General population8
(per cent) Age
up to 24 25-34 35-44 45-54 55+ 17 27 20 21 15 17 27 20 21 15 Census9 31 14 15 13 27 Gender female male 42 58 42 58 Census 51 49 Income
less than 5,999 6k – 12,999 13k – 16,999 17k – 21,999 22k – 26,999 27k – 33,999 34k – 41,999 42k – 55,999 56k or more
5 11 10 12 15 16 13 11 8 not obtained ONS10 10 20 10 10 10 10 10 10 10 Frequency of Internet usage
up to 3 hours 3-5 hours 5-10 hours 10+ hours 14 13 24 48 34 16 20 30 not obtained 7
Data from the NOP IUPS. Refers to weekly Internet users aged 16+, resident in GB.
8
Data from other sources.
9 ONS (Nd).
Table 1 continued
Characteristic Survey sample (per cent) Weekly Internet users (per cent) General population (per cent) Internet expertise beginner quite knowledgeable quite advanced expert 9 35 35 21 18 45 24 13 not obtained Location remote village town city (suburban) city (inner) 3 22 43 22 11 not obtained BSA11 2 17 49 24 8 Mode of transport
car/van weekly bike weekly bus weekly train weekly 83 8 23 13 not obtained
DfT12 / BSA13 84 / 63 14 / 10 27 / 26 - / 7
Age. Whilst UK Census data suggest that this sample is unrepresentative of the national population in terms of age, over sampling greatly from ages 25-54 and greatly under sampling from those under 25 and over 55, data from the IUPS suggest that the sample age distribution is in line with that of weekly Internet users. ONS data (ONS, 2003a) also suggest that Internet use is skewed towards younger age groups, although these statistics include all who have ever used the Internet, rather than weekly Internet users.
11 Stratford and Christie (2000). Actual categories used in Stratford and Christie are: big city; suburbs or
outskirts of a big city; small city or town; country village; farm or home in the country.
12 DfT (2001); car use data from Dorothy Salathiel, personal communication.
13
Gender. Data from the UK Census suggest that the gender split in the UK is 51:49 female: male. The gender split in this survey is 42:58, respectively. Thus, the survey is not representative of the national population. However, data from the NOP IUPS suggest that the gender split in weekly Internet users matches that given in this survey. ONS data (ibid) are also broadly in line with IUPS data.
Household income. Income bands used in this survey were based upon the income deciles used in the Expenditure and Food Survey (ONS, 2003b). Comparison suggests that this survey has under sampled from the lowest three deciles and over sampled from deciles 6 and 7, in comparison with the national population. Although unsubstantiated, it is believed likely that the sample income distribution is more in line with that of weekly Internet users.
Frequency of Internet usage. The sample has over sampled those spending more than ten hours per week online and under sampled those spending less than 3 hours per week online, each by approximately 20 per cent, when compared to the weekly Internet user profile. Comparable national statistics cannot be found.
Internet expertise. The sample has over sampled from those who judge themselves to be 'quite advanced' or 'expert' Internet users, yet under sampled those who describe themselves as 'beginners' or 'quite knowledgeable', each approximately by 20 per cent.
The over sampling of people who judge themselves to be Internet experts and of those who use the Internet a lot introduces complications for the generalisation of results to the whole population, for the sample being considered is likely to have a higher level of virtual mobility readiness (Kenyon et al, 2003) than the national population as a whole.
Location. A comparison of the self-assessed location descriptors used in this survey with similar self-assessed location descriptors used in the 2001 British Social Attitudes Survey (Stratford and Curtice, 2000) shows a high degree of fit between the two. However, comparable figures for home location distribution of weekly Internet users cannot be found.
Mode of transport. Comparison of data with British Social Attitudes data14 suggests that train users appear to be under represented and car users to be over represented, the latter by 20 per cent in relation to the national population. This may be explained by the separation in the BSA survey of car driver and car passenger, a separation that is not given in this survey. Data
14
from the National Travel Survey15 reinforces this view, suggesting that 84 per cent travel by car each week, compared to 82.5 per cent in this survey. However, NTS data (DfT, 2001) suggest that this survey under samples both bicycle and bus users. BSA data falls between the two surveys. Both surveys are given to illustrate the apparent uncertainty of data in this area.
3. Survey Results
The survey was designed such that it would address both behaviour and attitudes regarding (i) respondents’ personal travel; (ii) Internet use; and (iii) the interactions between the two. The survey results are presented and discussed accordingly below for the overall sample. This is followed by a discussion of the survey including some commentary concerning respondent characteristics in relation to responses given in the survey.
3.1 Personal travel – behaviour
As a context some key national statistics are presented which reflect personal travel behaviour for the national population as a whole. The figures are for 1998/2000 (DTLR, 2001). 69 per cent of all trips made in the UK were under 5 miles in length. 56 per cent of trips made by car drivers were under 5 miles. 26 per cent of all trips were made on foot and 62 per cent made by car. The average time for a walk trip was 15 minutes and by car approximately 20 minutes. Average trip lengths were 0.6 miles and approximately 8.7 miles accordingly. In summary, the majority of travel undertaken is local and is on foot or by car. The most frequently undertaken journey types in the UK are commuting and for shopping - 16 per cent of all journeys are for commuting and 21 per cent are for shopping (DETR, 2000b).
In terms of mode use (see Table 1), as expected, the majority of respondents are, like the UK population as a whole, regular car users (drivers and/or passengers). A quarter of respondents use the bus at least once a week and over one in ten use the train this frequently.
Respondents were asked to indicate how they normally reached a range of activity centres (Table 2). (A negligible proportion of respondents answered ‘don’t know’.) For all the activity
15
centres considered, well over three quarters of respondents access each centre either by car or on foot (again very much in line with behaviour of the UK population as a whole).
Table 2 ‘How do you NORMALLY travel to the following places? If you use more than one, please indicate the main one used. Within each category, please answer for the place or location you visit most often’
(per cent of respondents for whom the category is relevant and who have not answered ‘don’t know’)
Activity centre Size of sub-sample
Car (driver or
passenger) Bus Walk Other mode
bank or building society, inc cashpoint 1009 54 5 38 3
doctor’s surgery 1006 55 5 38 2
entertainment venue (e.g. cinema, theatre) 977 72 10 9 9
social venue (e.g. pub or club, bingo) 963 43 8 33 16
hospital 935 78 10 7 5
library 821 47 6 44 3
nearest close family or friend 1010 62 4 27 7
place of education for you 325 53 14 23 10
place of work 779 64 9 15 12
post office 985 37 2 58 3
supermarket for main grocery shop 999 79 4 15 2
shopping centre 1013 65 14 17 4
Figure 2 ‘From home, approximately how long does it NORMALLY take you to reach the following places, using your MOST used means of transport? Within each category, please answer for the place or location you visit most often’
(approximate mean travel time16 across respondents for whom activity centre is relevant)
0 5 10 15 20 25 30
place of work
place of education for you
hospital
nearest close family or friend
entertainment venue (e.g. cinema, theatre)
shopping centre
social venue (e.g. pub or club, bingo)
supermarket library bank or building society
doctor's surgery post office
3.2 Personal travel – attitudes
Respondents were asked, compared to their current levels of use, whether they would prefer to see personal levels of transport mode use change (see Table 3). For car, bus and train the majority of respondents are content with their current levels of use. Having noted the high level of car dependence of the sample overall, a substantial proportion of respondents (over 1 in 4) would like to reduce their car use. In spite of the lower incidence of regular bus users within the sample (see Table 1), nearly 1 in 5 of all respondents would like to reduce their bus use. There is a strong desire (or aspiration) to do more cycling. Yet, notwithstanding the need to own a bicycle, the opportunity to cycle is not constrained by service frequency, cost of
16
travel or reliability of travel as it is (or can be) for public transport use. It is perhaps surprising therefore that people feel unable to cycle as much as they would wish. A likely explanation for this anomaly is the possible perception, amongst respondents, that cycling is a leisure activity, rather than a means of access to activities. Such an explanation would diminish the potential to achieve the mode shift implied by this finding.
Table 3 ‘Thinking about your current use, how much use of the following activities would you prefer to do?’
(per cent of respondents – base: 1028 respondents)
Mode A lot less A little less About the same
A little more A lot more Don’t know
car, van 10 19 51 8 7 4
bicycle 5 0 32 30 15 18
bus 9 9 54 12 2 15
train 7 7 51 17 4 14
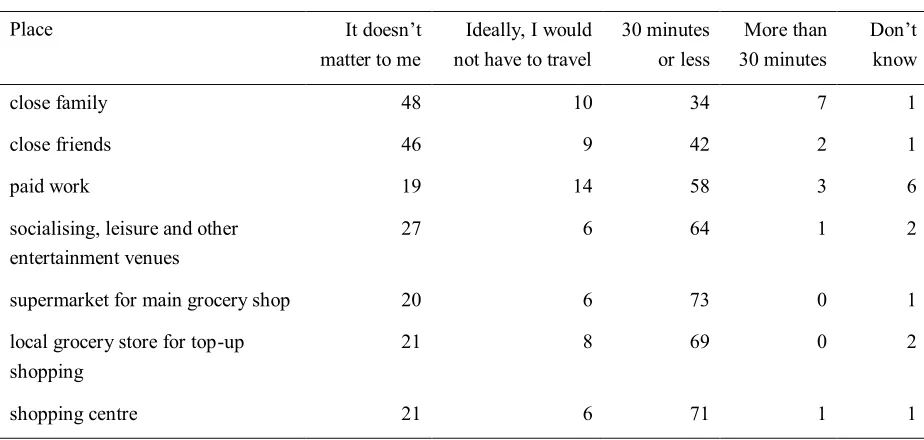
Table 4 ‘What would your preferred travel time to the following places be?’ (per cent of respondents – base: 1028 respondents)
Place It doesn’t
matter to me
Ideally, I would not have to travel
30 minutes or less
More than 30 minutes
Don’t know
close family 48 10 34 7 1
close friends 46 9 42 2 1
paid work 19 14 58 3 6
socialising, leisure and other entertainment venues
27 6 64 1 2
supermarket for main grocery shop 20 6 73 0 1
local grocery store for top-up shopping
21 8 69 0 2
shopping centre 21 6 71 1 1
[image:16.595.66.528.457.677.2]expectations of what is reasonably possible’. For all destinations considered at least 1 in 5 respondents are not concerned about travel time – this may imply more specifically that they are not particularly concerned or displeased with their current travel time to given destinations. An alternative explanation is available and could be especially valid in the case of seeing family and friends, where concern about travel time is particularly low. The response could reflect devotion to the activity: the notion that respondents would travel as far as necessary to see family and friends and that distance is no barrier to their relationships.
It might have been expected that a substantial proportion of respondents would elect to remove the need to travel. This option is most popular for access to work (reflecting perhaps the fact that this is one of the longest commonly undertaken journeys in terms of travel time (see Figure 2)). Nevertheless only 14 per cent of respondents would wish, ideally, not to have to travel to work and for other destinations no more than 1 in 10 would wish not to have to travel. Where a preferred travel time range has been indicated by respondents, the vast majority would wish their travel time to be 1-30 minutes – this corresponds broadly, for the sample as a whole, to what they are currently experiencing (Figure 2).
Table 5 ‘Please indicate the extent to which you agree or disagree with the following statements about TRAVELLING:’
(per cent of respondents, who did not answer ‘don’t know’ or ‘not applicable’)
Statement Size of
sub-sample
Strongly agree
Agree Neither agree or disagree
Disagree Strongly disagree
I am content with the amount of time that I spend travelling to work
828 18 41 16 17 9
Having to travel to places reduces my enjoyment of what I do when I get there
1012 4 21 32 35 8
I value the time that I spend travelling to work
822 3 16 33 32 16
I do not have time to do all of the things that I would like to do, because of the time that I spend travelling
974 7 20 25 37 11
I am content with the length of time that I spend travelling to do my grocery shopping
1003 12 55 24 8 2
The time that I spend getting to places is wasted time
1024 6 23 36 30 5
If I didn’t have to travel any more, I would miss it
1020 5 32 29 27 7
Difficulties with travelling stop me from seeing my close family or friends as much as I would like to
1018 9 29 19 35 8
It would be nice if more of my activities (work shopping, socialising, etc.) were in the local (home) area
1007 9 39 37 13 2
I am content with the amount of time that I spend travelling to see close family or friends
1021 5 44 28 19 4
The following summarising remarks can be drawn from this look at personal travel:
§ There is a wish by many to reduce the amount they use their cars and yet not, it would seem, to achieve this through greater use of alternative modes for their journeys.
§ For a substantial proportion of weekly Internet users, travel is not considered to be a problem and indeed is viewed by some to be a positive thing. As such, many people are not apparently actively concerned about the amount of mobility they undertake.
§ Accordingly it might be implied that the ‘costs’ of travel (time, monetary cost, discomfort etc) are not necessarily the motivating force for people to pursue greater use of virtual mobility to access opportunities, services, social networks and other goods via the Internet.
§ Many people have indicated that difficulties with travelling are limiting their level of social participation.
[image:19.595.126.470.418.697.2]3.3 Internet use – behaviour
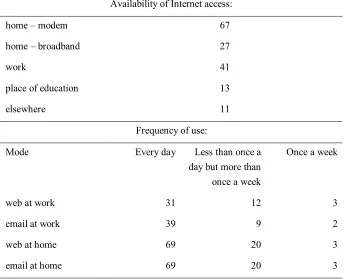
Table 6 Internet access and use
(per cent of respondents – base: 1028 respondents)
Availability of Internet access:
home – modem 67
home – broadband 27
work 41
place of education 13
elsewhere 11
Frequency of use:
Mode Every day Less than once a day but more than once a week
Once a week
web at work 31 12 3
email at work 39 9 2
web at home 69 20 3
email at home 69 20 3
for the fourth quarter of 2002 and for February 2003 (ONS, 2003a). 62 per cent of adults have accessed the Internet at some time: 38 per cent have never used the Internet. 50 per cent of adults have accessed the Internet in January 2003; and 45 per cent of all households have Internet access from the home. Internet use is unevenly distributed according to age, with 95 per cent of people aged 16-24 having used the Internet, compared with 15 per cent for those aged 65+. People access the Internet for personal use from a variety of locations, the most popular being the home (80 per cent), the workplace (38 per cent) and another person's home (36 per cent). On average, 55 per cent of those who have used the Internet use it at least once a week; 28 per cent, every day. People undertake a wide variety of activities online, the most common being to search for information, the second most popular being to communicate.
In terms of Internet access and use across the survey sample (Table 6), the vast majority of respondents (92 per cent) access the Internet at home at least once a week for web and email, with almost 70 per cent using each every day. Of those respondents who have home access, 97 per cent use web and email from home at least once a week. Far fewer have access and use web and email at work (though it should be noted that only 51 per cent of the sample are in full-time employment (with a further 7 per cent and 6 per cent in part-time employment and self-employed respectively)).
[image:20.595.118.475.559.739.2]It is (currently) more common to access the Internet at home by modem than by broadband - for the survey sample the figures are 67 per cent and 27 per cent respectively. With so many weekly Internet users gaining their experience via home Internet access, such experience in terms of speed of access will be markedly different between modem and broadband access.
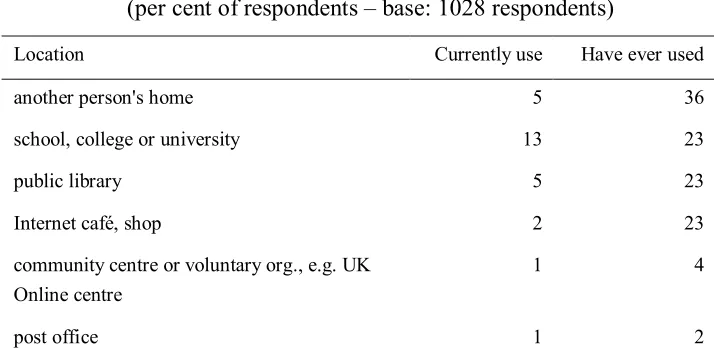
Table 7 ‘Please indicate where you use the Internet.’ (per cent of respondents – base: 1028 respondents)
Location Currently use Have ever used
another person's home 5 36
school, college or university 13 23
public library 5 23
Internet café, shop 2 23
community centre or voluntary org., e.g. UK Online centre
1 4
Few currently access the Internet outside of the home from a non-work location, as illustrated in Table 7. However, relatively high numbers have accessed the Internet from these locations at some time.
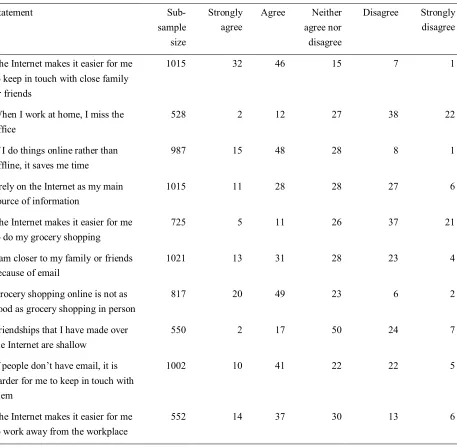
[image:21.595.78.535.308.755.2]3.4 Internet use – attitudes
Table 8 ‘Please indicate the extent to which you agree or disagree with the following statements about USING THE INTERNET (web and email).’
(per cent of respondents, who did not answer ‘don’t know’ and for whom statement is applicable)
Statement
Sub-sample size
Strongly agree
Agree Neither agree nor disagree
Disagree Strongly disagree
The Internet makes it easier for me to keep in touch with close family or friends
1015 32 46 15 7 1
When I work at home, I miss the office
528 2 12 27 38 22
If I do things online rather than offline, it saves me time
987 15 48 28 8 1
I rely on the Internet as my main source of information
1015 11 28 28 27 6
The Internet makes it easier for me to do my grocery shopping
725 5 11 26 37 21
I am closer to my family or friends because of email
1021 13 31 28 23 4
Grocery shopping online is not as good as grocery shopping in person
817 20 49 23 6 2
Friendships that I have made over the Internet are shallow
550 2 17 50 24 7
If people don’t have email, it is harder for me to keep in touch with them
1002 10 41 22 22 5
The Internet makes it easier for me to work away from the workplace
Satisfaction with current levels of use of email and the web both at home and at work are high – more than three quarters of those using the Internet at these locations would not change their levels of usage. The numbers wishing to use the Internet more and those wishing to use it less at work are fairly evenly balanced. However three times as many home users would like to use the Internet more than would like to use it less.
Respondents were asked to indicate their level of affinity with a series of statements about Internet use (Table 8). The Internet appears to form an important social function, with 78 per cent of relevant respondents suggesting that the Internet makes it easier to keep in touch with family and friends. In addition, 44 per cent believe that they are closer to family and friends because of email (27 per cent disagree). A worrying sign that the digital divide negatively affects the maintenance of social networks is given by the 51 per cent who agree or strongly agree that if people do not have email, it is harder to keep in touch with them. A fifth of those who have made friendships online believe that these friendships are shallow, whilst 31 per cent disagree with this statement.
The Internet appears to make it easier for many people to work away from the workplace. 51 per cent of relevant respondents concurred with this and 60 per cent do not miss the office when working at home. Conversely, only 16 per cent of relevant respondents believe that the Internet makes it easier for them to do their grocery shopping (58 per cent disagree) with a majority believing that grocery shopping online is not as good as grocery shopping in person.
The two activities, in terms of being conducted in the home, are very different. Working from home (and using the Internet) can broadly parallel working in the office (where the Internet (or at least Intranet) is now a common feature of the working environment). The activity itself in both cases will, typically, involve sitting at a desk and communicating by phone and email (and possibly retrieving information via the web). Meanwhile there is a much more noticeable difference in the social function of shopping in person and shopping online at home. The former involves interaction with other people. The latter involves no human contact.
60 per cent of the overall sample consider that doing things online saves them time when compared to the offline activity.
Internet activity into their everyday lives: indeed, a number stated that the Internet has become such an integral part of their lives, they could not imagine how to undertake many activities without it. The Internet would be missed for a number of reasons. The reasons can be divided into two groups. Firstly, those that compare online activities to offline activities and include: cost savings; time savings; convenience; simplicity; reliability; and removal of the need to travel. Secondly, those that describe the generic benefits of Internet use, including: access to new activities, or new people, which was mentioned by many respondents, including but not exclusively those with disabilities and those who cannot travel; because it fills in gaps in people's offline lives, reducing boredom; and because it is seen to broaden the mind.
There are primarily three types of activity that people would miss if they no longer had access to the Internet. Firstly, the Internet as an information source, for general interest, education or entertainment. Indeed, a number of respondents described the Internet as a library, to which they do not have to travel. Secondly, the Internet's social function, enabling more frequent, more reliable and/or more personal contact with friends, family and/or a more diverse population than would ordinarily be accessible to the individual. Finally, respondents described how they would miss the conduct of daily chores, including banking and shopping, online.
The following summarising remarks can be drawn from this look at Internet use:
• Frequency of use of the Internet is high amongst this sample. People’s experience of Internet use and in turn their attitudes is principally derived from access at work but overall most commonly, from home. Few weekly Internet users are gaining experience from other means of access (though past experience of other means of access overall is quite high).
• Most people will talk about travel based upon their experience as car users; accordingly the views of those who do not use the car can be marginalised. Similarly views about the Internet will be dominated by those using it from home and work with views from those reliant upon community centres, Internet cafes, libraries etc. at risk of being marginalised.
• Levels of satisfaction with current amounts of Internet use are high, although where dissatisfaction is expressed, it is in wishing to use both web and email more in the home.
• Across the population of weekly Internet users there is clear evidence that a dependency on Internet use is forming with it serving both as a substitute for offline means of access as well as broadening the set of activities in which individuals engage.
• Much as people have certain preferred modes of transport to access given activities outside of the home, it would appear that the Internet as a mode of access is the preferred mode for some activities (e.g. homeworking) and not for others (e.g. online shopping).
• The majority of weekly Internet users recognise a time saving achieved by undertaking an activity online rather than doing it offline. Given that many users do not consider time spent travelling as a problem, it may be inferred that it is activity
time rather than travel time saving for online activities which has the potential to render them viable substitutes for their offline counterparts. Viability will also be governed by the relative quality of experience attained by conducting an activity online rather than offline.
3.5 Personal travel and Internet use – behaviour
Figure 3 shows the frequency with which key activities are undertaken both offline and online17.
The information presented in the Figure does not allow a judgement to be made concerning whether or not the prevalence, for some activities, of online access is substituting for a proportion of offline access or whether the overall levels of engagement in some activities has been increased – i.e. online access is supplementing offline access. However, the ratio values shown in the Figure do provide an indication of the extent to which the Internet using population consider online access to be a viable alternative to offline access. In other words, were the offline option to become inaccessible, the online option could be turned to instead. For activities principally concerned with written or oral information handling/exchange (news/reading, communicating with family and friends, banking, education, working) use of the online option in relation to use of the offline option is relatively high. For activities where
17 The frequencies are approximations from the frequency categories used in the survey and it should be noted
information handling/exchange is more complex (for the activities shown, this principally concerns grocery and other shopping) there is, as yet, less inclination to make use of the online option.
Figure 3 Approximate mean frequency of participation in key activities online and offline for all respondents (ratio of online to offline shown adjacent to plot)
0 1 2 3 4 5 6 7
paid work in the home formal education related in the home other (non-grocery) shopping personal banking main grocery shopping entertainment communicating remotely with family or friends news, reading, info search etc
times undertaken per week (approximate)
online offline
0.6 0.8
0.2 1.2 0.1
2.4 0.8
0.5
What is remarkable is the extent, overall, to which the Internet is being used as a means of accessing, virtually, a whole range of activities. Much as physical mobility does, the Internet is facilitating access to opportunities, services, social networks and other goods.
Respondents were asked to judge the extent to which they believe that Internet use has
affected their travel, with regard to four key activities (Table 9).
There is a caveat when interpreting the results in Table 9 – the survey question is unable to take account of how conscious of travel changes individuals are or indeed how accurately any degree of change can be recalled. It should also be noted that those that only occasionally
undertaken. This would concur with the view held by some observers that travel substitution and enhancement effects resulting from telecommunications use broadly cancel out in terms of the net effect on the amount of travel. It is important to note again, however, that no net change in amount of travel does not, necessarily, mean that the patterns of travel have not been changed. More people who believe that their online activities have affected their amount of travel believe that their travel has been reduced, rather than increased. Responses differ quite considerably according to activity type. Half of the sample believe that non-grocery shopping online has affected their amount of travel, with 86 per cent of these believing that they have spent less time travelling, because of the online conduct of this activity. 27 per cent believe that shopping for groceries online has affected their amount of travel, with 89 per cent of these stating that they now spend less time travelling. For work, 19 per cent believe that Internet use has affected their amount of travel, 84 per cent of which suggesting that online work means that they spend less time travelling.
Table 9 ‘Would you say that your use of the Internet for each of the following has meant that you spend more, less or about the same amount of time travelling? (N.B. If you don’t do activity online please click NA)’ (per cent of respondents, who did not answer ‘don’t know’ or ‘not applicable’)
Online activity Sub-sample size
A lot less travel
A little less travel
About the same amount of travel
A little more travel
A lot more travel
for work 514 5 11 81 2 1
for grocery shopping 543 6 18 73 3 1
for other shopping 758 13 30 50 5 2
for communicating with family and/or friends
911 5 19 63 9 3
Taking Figure 3 and Table 9 together one can compare, for the population overall, how frequently a given activity is undertaken online with the (perceived) capacity for such online access to reduce travel. 43 per cent of relevant respondents believe other shopping online reduces travel but the frequency of this online activity is very low. Meanwhile over 1 in 5 of all respondents communicate with family and/or friends online (a much more commonly and frequently undertaken activity) and believe it reduces their travel.
3.6 Personal travel and Internet use – attitudes
Respondents were asked whether or not they were happy with how much of five key activities they currently undertake, both online and offline (Table 10). Respondents were not asked if they would like to do more of, for example, their offline paid work, online. Thus, the results do not suggest whether or not they would like to undertake each activity more online or offline in comparison to offline or online respectively.
Table 10 ‘Thinking about your current use, how much of the following activities would you prefer to do?’
(per cent of respondents, who did not answer ‘don’t know’)
A lot or a little less About the same A little or a lot more Activity
Offline Online Offline Online Offline Online
paid work 25 6 52 38 23 56
communicating with family and friends
3 3 57 60 40 37
grocery shopping 20 9 72 68 8 23
formal education 8 7 69 63 22 30
leisure and entertainment
4 8 58 73 39 19
[image:27.595.73.529.449.632.2]Table 11 ‘Please indicate the extent to which you agree or disagree with the following statements about Internet use and travel:’
(per cent of respondents – base: 1028 respondents)
Statement Strongly
agree
Agree Neither agree nor disagree
Disagree Strongly disagree
Don’t know
If the cost of travel increased, I would use the Internet more instead of travelling
5 21 32 31 7 4
If congestion increased, I would use the Internet more instead of
travelling
4 25 30 31 6 4
If the cost of Internet use fell, I would use the Internet more instead of travelling
9 26 30 26 5 3
Most of what I do online is as a substitute for the same activities, offline
2 17 29 38 9 4
The Internet allows me to do things that I cannot do offline
15 56 18 8 2 1
I feel that the Internet adds to my quality of life
14 50 27 6 2 1
Respondents were presented with a series of attitude statements regarding the interaction between personal travel and Internet use (Table 11). 1 in 4 weekly Internet users would anticipate substituting virtual access for physical access if the cost of mobility were increased. By implication they judge the quality of virtual access to be acceptable in the context of a quality/cost trade-off. Many respondents remain undecided in this matter. This may reflect that many people are not consciously aware of relationships between Internet use and personal travel and therefore find it difficult to reflect upon what those relationships might be. Over a third of weekly Internet users do not believe they would use the Internet more instead of travelling if the cost of travel increased. A similar distribution of responses is given for increased congestion rather than increased cost of travel.
[image:28.595.74.525.172.513.2]bigger (travel cost or congestion increased). Once again opinion is mixed, with support for and against the statement concerned in almost equal measure.
Although not unanimous, there is substantial disagreement with the suggestion that online activities are generally substitutes for those same activities offline. This is not surprising. What is more surprising perhaps is that one in five agree with the suggestion (albeit not strongly).
As might be expected the response to the penultimate statement in Table 11 rather duplicates the previous. There is very strong support for the suggestion that the Internet allows things to be done that cannot be done offline. The survey has not, however, extended to the point of being able to determine whether being unable to do certain things offline is because they do not exist (and by implication the online activities are new types of activities) or because they are inaccessible to the individual. Nevertheless, as discussed earlier, the survey did ask respondents to indicate what they would miss if they could no longer use the Internet.
The following summarising remarks can be drawn from this look at (interactions between) personal travel and Internet use:
§ For many commonly undertaken activities, Internet access-enabled forms of the activity which are comparable to the offline equivalent exist. For some activities (particularly those concerned with straightforward information exchange) the online forms of the activities are frequently used.
§ Many people believe that undertaking key activities online which are available to them online and offline such as work and grocery shopping has not affected their amount of travel. This suggests that the choice to do such activities online is not motivated by the disutility of travel associated with accessing the offline equivalent.
§ Grocery shopping and paid work are activities which for the population overall, many would prefer to do less of offline and many would prefer to do more of online. It would appear, therefore (coupled with the observation above) that there is a disutility associated with undertaking certain activities outside the home (which may or may not include the travel to access the activities) and that such activities when accessed virtually have less disutility. Such disutility is likely to include time spent and inconvenience.
These observations together strongly suggest that virtual mobility has and will have an important part to play in the provision of access within society.
§ The Internet is improving access for people and/or broadening the range of opportunities, services, social networks and other goods to which they have access. Accordingly, the majority of weekly Internet users agree that the Internet adds to their quality of life (more than 1 in 10 strongly agree).
4. Discussion
This final section of the paper draws out the key findings, which can be observed at the level of the national Internet population. These findings are discussed with relevant observations from preliminary cross-tabulation of results by key demographics included, where such observations would challenge national generalisations, or suggest niche markets for change in personal travel behaviour or have implications for policy formulation.
4.1 Internet dependence
Out with use of the Internet, car dependence has become a term approaching synonymous with attaining access in modern society. There are certain activity centres, out-of-town supermarkets and shopping centres being prime examples, which for all or most people can only be reached by car. That car dependence is frowned upon is a consequence of its adverse effects – congestion, pollution, impacts on land use patterns and erosion of community and social cohesion. Yet for those who own a car, the access it provides offers them substantial benefit in a world in which high levels of mobility are now the norm.
Like the car, the Internet can provide a means of access. It might well be the case that in the not too distant future the term Internet dependence will be in vogue amongst planners and policymakers.
and improvement of access is a belief by the majority of weekly Internet users that Internet access improves their quality of life.
Those individuals who spend more time each week using the Internet and who consider themselves more expert as Internet users are more likely to feel that the Internet improves their quality of life. 50 per cent of those spending up to 3 hours on the Internet each week agree or strongly agree that the Internet adds to their quality of life. This figure increases to 73 per cent for those spending more than 10 hours per week using the Internet. A similar patterns applies to Internet expertise. 52 per cent of beginners agree or strongly agree compared to 70 per cent of experts. Allied to this there is a marked increase, as expertise and the amount of time spent on the Internet increases, in support of the view that the Internet allows things to be done which cannot be done offline. Equally as Internet expertise increases, disagreement increases with the suggestion that most of what is done online can be done offline. The frequency with which individuals undertake a whole range of activities online increases with expertise and time spent online each week.
It is noteworthy then that as individuals become more familiar with, and regular users of, the Internet their knowledge of what it allows them to reach in terms of opportunities, services, social networks and other goods increases as does the extent to which they make use of this access. Accordingly it seems that their dependence on Internet access is then increased in light of their increasing belief that it improves their quality of life.
Such observations are not meant to suggest, necessarily, that Internet dependence is a bad thing for the individual or society. Much as with car dependence, it is for policymakers to ask whether such dependence has adverse consequences for the natural, built, economic and social environments.
Another important question remains – is Internet dependence substituting for car dependence or coexisting with it?
4.2 Activity time substitution
The minus factor might then be assumed to be related to the lower quality of the online activity that has been reached compared to the offline equivalent (Lyons, 2002). However, findings from this survey cast doubt over such assumptions (always being valid).
Many Internet users have indicated that they have no real concern about the amount of mobility they undertake and indeed some view their travel as a positive thing. Yet most users do nevertheless recognise a time saving achieved by undertaking an activity online rather than offline. Additionally, many users do not believe that undertaking activities online has affected their amount of travel. Taken together, these observations suggest strongly that it is the relative merit of participating in the activity online versus offline that may be a determining factor in decisions leading to substitution of virtual mobility for physical mobility. More particularly it would seem that for some activities it is the convenience or time saving of undertaking the activity online that can be a decisive factor rather than any travel time saving. Grocery shopping and paid work are both examples of activities which many weekly Internet users would prefer to access virtually rather than physically.
At present the attractiveness of some online activities in terms of their convenience and time saving may be tempered by the quality of service provided online. In addition the quality of the connection (modem or broadband) between the user and the service may be a significant factor. However, if developments to date continue then a growing proportion of the population will have an increasing quality of connection to a growing range of services of increasing quality.
That travel time or more particularly travel time saving is not a major consideration in the decision to access activities online is perhaps further reflected by the modest (or presumed modest by many) journey times associated with the majority of regular journeys undertaken. Most if not all regular activities engaged in by Internet users outside the home, can, on average, be reached within 30 minutes travelling time.
4.3 The digital divide
hand we begin making reference to terms such as Internet dependence, we must recognise that not everyone has (or will have for the foreseeable future) the opportunity to use the Internet in order to gain access to the growing wealth of opportunities, services, social networks and others goods that exist.
Internet access itself comes in various forms. Access in the home is most common, while at the other extreme only a minority of Internet users are dependent on public access points such as libraries, community centres and Internet cafés. Accordingly the findings from this survey for the respondent sample as a whole will mask any differences between experiences and opinions of those used to home access versus those dependent on public access points. The temptation or need to generalise from a survey such as this risks marginalising the needs and views of some Internet users.
Lack of knowledge, limited quality of access or limited resources to access and use the Internet effectively can be greater barriers to some than to others within the Internet-using population. For example, in terms of income, fewer survey respondents in higher income households have never undertaken online paid work in the home than those in lower income households. The likelihood of having no experience of online grocery shopping or online shopping for other goods also increases with decreasing income of Internet users’ households.
Concern about the digital divide should not, however, itself overshadow the potential of the Internet to tackle the social exclusion experienced by many in society today – many survey respondents indicated that difficulties with travelling are limiting their level of social participation.
4.4 Confronting car dependence
A fundamental question for transport policymakers is whether the Internet can help reduce or ease society’s dependence on the car.
journeys rather than (or as well as) car journeys. What remains to be seen is whether any bus journeys that ‘convert’ to virtual mobility remain virtual or whether, as car ownership and use is afforded, they convert on to become car journeys.
Stated intentions of a significant minority of the survey sample are that if the cost of travel increased they would substitute Internet access for physical travel. Agreement with this stated intention declines with increasing household income. However, for very low income households the level of agreement also declines. This might imply that travel demand of high income households is inelastic to price where for low income households the (motorised) travel they undertake is already (much) less and is considered essential rather than discretionary.
Overall, evidence from the survey would suggest that the Internet and the access it provides offers a viable alternative to car use if the policy ‘stick’ is sufficient. However, as a contributor to an integrated transport system, virtual mobility is not a viable alternative for all people for accessing all activities all of the time. Rather it can form an important component part. Just as many people have a preferred mode of transport for accessing a given activity outside of the home, it would appear that Internet as a mode of access is the preferred mode for some activities (e.g. homeworking) and less so for others (e.g. online shopping). The survey has also revealed that there is an impact of age upon the propensity to undertake different activities online – it is not simply the case that younger people do more of everything online than older people.
The alternative or complement to the policy ‘stick’ is the carrot. 1 in 3 weekly Internet users would substitute more Internet use for less travel if the cost of Internet use fell. This, at first sight appears encouraging from a transport policy perspective. However agreement with this stated intention is stronger from those with less Internet expertise than those with more and stronger from those with modem access at home than those with broadband access. This suggests that those with more expertise and better Internet access are already in a position of being able to get the best from what the Internet can currently offer. Conversely, those with less experience and lower quality access feel they could get more if it were more affordable.
4.5 Closing remarks
representative of the national population of weekly Internet users. The survey results represent a rare example of directly comparing Internet use and personal travel in terms of attitudes and stated behaviours. It remains for the survey findings and project findings as a whole to be distilled down into more specific advice on the implications for policymakers. Interpretation of the results in this context is crucial – there is ever the temptation to assume the population of interest to be homogeneous which can lead in turn to the temptation to advocate blanket policy approaches. There is the need too, to avoid confusing substantial and significant in the context of interpreting results. For example, although the substantial majority of those with an opinion would not substitute Internet use for travel if the cost of travel increased, the minority who would do so could prove significant in the context of the Internet forming part of an integrated policy approach.
5. References
Adams, J. (2000) Hypermobility. Prospect, accessed via
http://www.prospectmagazine.co.uk/highlights/hypermobility/, viewed 23/02/01. Baym, N.K. (1995) The emergence of community in computer mediated communication, in
Jones, S. (Ed.) Cybersociety: computer mediated communication and community, London: Sage Publications.
Black, W.R. (2001) An Unpopular Essay on Transportation, Journal of Transport Geography, 9, 1-11.
Cornwell, B. and Lundgren, D.C. (2001) Love on the Internet: involvement and
misrepresentation in romantic relationships in cyberspace vs. realspace, Computers in Human Behaviour, 17, 197-211.
DETR (2000a) Transport 2010 – the ten year plan, London: TSO.
DETR (2000b) Transport Statistics Great Britain: 2000 Edition, London: TSO. DTLR (2001) Focus on Personal Travel: 2001 Edition, London: TSO.
DfT (2001) National travel survey: 1999/2001 update, Transport statistics bulletin, London: DfT.
Golob, T.F. and Regan, A.C. (2001) Impacts of information technology on personal travel and commercial vehicle operations: research challenges and opportunities, Transportation Research C, 9, 87-121.
Graham, S. (1998) The end of geography or the explosion of place? Conceptualising space, place and information technology, Progress in Human Geography, 22 (2), 165-185. Graham, S. and Marvin, S. (1999) Planning cyber-cities? Integrating telecommunications
into urban planning, Town Planning Review, January.