A visual analytics technique for exploring gene expression
in the developing mouse embryo
ANDREWS, Simon <http://orcid.org/0000-0003-2094-7456> and MCLEOD, K.
Available from Sheffield Hallam University Research Archive (SHURA) at:
http://shura.shu.ac.uk/21103/
This document is the author deposited version. You are advised to consult the
publisher's version if you wish to cite from it.
Published version
ANDREWS, Simon and MCLEOD, K. (2018). A visual analytics technique for
exploring gene expression in the developing mouse embryo. In: 23rd International
Conference on Conceptual Structures, proceedings. Lecture Notes in Artificial
Intelligence . Springer, 137-151.
Copyright and re-use policy
See
http://shura.shu.ac.uk/information.html
Sheffield Hallam University Research Archive
A Visual Analytics Technique for Exploring
Gene Expression in the Developing Mouse
Embryo
Simon Andrews1 and Kenneth McLeod2
1 Conceptual Structures Research Group
Communication and Computing Research Centre & The Department of Computing Faculty of Arts, Computing, Engineering and Sciences
Sheffield Hallam University, Sheffield, UK
2
School of Mathematical and Computer Sciences, Heriot-Watt University, Edinburgh, UK
Abstract. This paper describes a novel visual analytics technique for exploring gene expression in the developing mouse embryo. The major-ity of existing techniques either visualise a single gene profile or a single tissue profile, whereas the technique presented here combines both - vi-sualising the genes expressed in each tissue in a group of tissues (the components of the developing heart, for example). The technique is pre-sented using data, provided by the Edinburgh Mouse Atlas Project, of gene expression assays conducted on tissues of the developing mouse em-bryo and a corresponding hierarchical graph of tissues defining the mouse anatomy. By specifying a particular tissue, such as the heart, and a par-ticular stage of development, a Formal Context is computed making use of the hierarchical mouse anatomy so that the resulting Formal Concept Lattice visualises the components of the specified tissue and the genes expressed in each component. An algorithm is presented that defines the computation of the Formal Context. Examples of resulting lattices are given to illustrate the technique and show how it can provide useful information to researchers of gene expression and embryo development.
1
Introduction
Understanding the role of genes in the development of an embryo is a major scientific endeavour. Key advances such as the mapping of the human genome3, the identification of specific genes responsible for genetic diseases [1] and the latest gene splicing technologies, such as the CRISPR-cas9 system [2], have led to new methods and treatments for the detection, prevention and correction of many genetic disorders [3]. However, there is still much to be done to gain a complete picture of how the many thousands of genes present in complex organ-isms are responsible for the construction, differentiation and organisation of the
3
many different cells that constitute the organism. By studying the components of a developing embryo, in terms of finding out which genes are responsible for constructing which systems, organs and tissues therein, a fuller picture is emerging.
One major effort in this regard is the e-Mouse Atlas Project [4, 5] where in situ gene expression experiments for the embryonic mouse are aggregated and published. Data is being collected that identifies which, of over 6000 genes, are responsible for the construction of over 4000 different tissues in the developing mouse embryo.
This paper presents a new visual analytics technique to explore this data, allowing the visualisation of the genes expressed in a specified mouse embryo tissue and all of its component parts (such as the heart and its components, comprising atria, ventricles, valves, etc.). The visualisation also enables gene co-expression to be seen, where groups of genes are expressed together in the same tissue.
For this purpose Formal Concept Analysis (FCA) [6] is used to create the visualisation in the form of a Formal Concept Lattice. Whereas the majority of existing techniques tend to focus on either a single gene profile across different tissues, or single tissue profile of genes expressed therein, the Formal Concept Lattice of gene expression combines both in a single diagram (for those not familiar with FCA, these are good introductory texts: [7, 8]).
The structure of the rest of this paper is as follows: Section 2 describes the e-Mouse Atlas Project (EMAP), Section 3 shows how the EMAP data and a corresponding definition of the mouse anatomy can be used to create a Formal Context of gene expression, Section 4 evaluates the results by means of a number of Formal Concept Lattices of gene expression, Section 5 is a review of existing techniques and other related work and Section 6 draws conclusions from the work and suggests further work to be done.
2
The e-Mouse Atlas Project
The e-Mouse Atlas Project (EMAP) provides researchers with two main re-sources: the EMA Mouse Anatomy Atlas and the EMAGE Gene Expression Database [9].
The EMA Mouse Anatomy Atlas uses embryological mouse models to provide a digital atlas of mouse development. It is based on the definitive books of mouse embryonic development by Theiler [10] and Kaufman [11] yet extends these studies by creating a series of three dimensional computer models of mouse embryos at successive stages of development with defined anatomical domains linked by a stage-by-stage ontology of anatomical tissue names.
model. Figure 1 shows part of the anatomy ontology at Theiler Stage 13, where cardiovascular system and heart have been expanded to show their component parts. Each anatomical term is annotated with a unique ID (EMAPA number) and the Theiler Stages in which it is present. Note that, although Figure 1 resembles a taxonomy, it is actually an ontology: a parent tissue can have several child tissues but also a child tissue can have more than one parent.
Fig. 1: Part of the anatomy ontology for Theiler Stage 13. Source: [5].
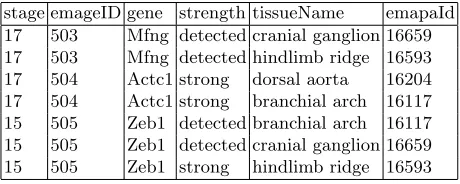
values for Theiler Stage, emageID (a unique assay number) , gene, strength, tissueName and emapaId (a unique tissue ID). Note that several tissues can be examined in the same assay and, that for the purposes of data analysis, all components of the embryo are called tissues, including organs, systems and even the mouse itself.
[image:5.612.193.423.198.290.2]stage emageID gene strength tissueName emapaId 17 503 Mfng detected cranial ganglion 16659 17 503 Mfng detected hindlimb ridge 16593 17 504 Actc1 strong dorsal aorta 16204 17 504 Actc1 strong branchial arch 16117 15 505 Zeb1 detected branchial arch 16117 15 505 Zeb1 detected cranial ganglion 16659 15 505 Zeb1 strong hindlimb ridge 16593
Table 1: A representation of EMAGE data.
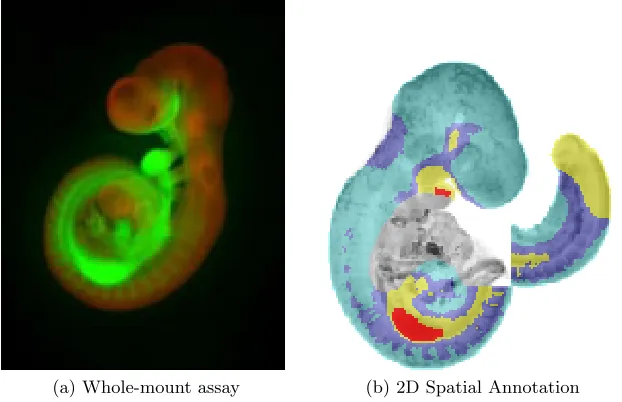
Figure 2 shows an example of a whole-mount assay and the resulting spatial annotation for gene Gpc3 at Theiler Stage 15: The results of the whole-mount assay (a) are mapped onto a corresponding 2D section of the model (b) using a colour-coding to indicate the strength of expression. However, this type of visu-alisation is not particularly useful if we wish to showall the genes expressed in a group of tissues. To do this, one possibility is to use Formal Concept Analy-sis, taking genes to be formal objects and tissues to be formal attributes. This technique is described in the next Section.
3
Creating a Formal Context of Gene Expression
A formal context of gene expression can be created from EMAGE data taking genes to be formal objects and tissues to be formal attributes. If genegis detected in tissue t, for example, the relation (g, t) is added to the context. Of course, this approach loses the detail of strength of expression and is useful only if we are interested in whether a gene has been detected or not. In which case, the strengthsweak,moderated andstrong can all be taken to implydetected.
Taking the EMAGE data in Table 1 as an example, a corresponding formal context is shown in Figure 3(a) and the resulting concept lattice in Figure 3(b)4. Thus gene Actc1 is expressed in the dorsal aorta and the branchial arch,Zeb1 is expressed in the branchial arch, thehindlimb ridge and thecranial ganglion, andMfng is expressed in thehindlimb ridge and thecranial ganglion.
4
(a) Whole-mount assay (b) 2D Spatial Annotation
Fig. 2: Whole mount assay and spatial annotation of gene Gpc3 at TS15. Name: EMAGE 3837. Source: [9].
cranial
ganglion
hindlim
b
ridge
dorsal
aorta
branc
hial
arc
h
Mfng × ×
Actc1 × ×
Zeb1 × × ×
(a)
(b)
[image:6.612.191.424.412.608.2]3.1 Inferred gene expression results
The hierarchical nature of the mouse anatomy ontology means that additional results can be inferred from an assay. If a gene is detected in a tissue then, by definition, it is also expressed in that tissue’s parent tissue, and so on up the anatomy. Taking the part anatomy shown in Figure 1 as an example, if a gene is detected in thebulbus cordis then it can be inferred that the gene is expressed in theheart, thecardiovascular systemand themouse. This is known aspositive propagation of gene expression.
This positive propagation is useful to FCA in producing a gene expression visualisation that corresponds to the hierarchy in the mouse anatomy ontology. For example, in a number of assays let us say that gene1 was detected in the bulbus cordis,gene2 was detected in theheart,gene3 was detected in the cardio-vascular systemandgene4 was detected in themouse. The corresponding formal context is shown in Figure 4a and the resulting lattice in Figure 4b. The lattice clearly visualises the hierarchy of the mouse anatomy ontology thus providing a familiar and sensible structure for researchers to analyse.
mouse cardio
v
ascular
system
heart bulbus
co
rdis
gene1 × × × ×
gene2 × × ×
gene3 × ×
gene4 ×
(a)
[image:7.612.158.453.335.541.2](b)
Fig. 4: Formal context and resulting lattice demonstrating positive propagation of gene expression.
3.2 An algorithm for creating formal contexts of gene expression from EMAGE data
what is proposed here is to create a formal context of gene expression for a particular tissue of interest (such as an organ or system) and all of its compo-nent parts at a given Theiler Stage. The algorithm,FindDetectedGenesInTissue, presented below, automates the construction of such formal contexts.
The algorithm is invoked by passing it the tissue and Theiler Stage of interest and an initially empty set of tissues calledf amily line. This set of tissues is used to store (in line 2 of the algorithm) an ancestral line of tissues from the initial tissue of interest, to a child of that tissue, a grandchild and so on. This family line of tissues provides the means of carrying out positive propagation of gene expression.
In line 3 of the algorithm, the EMAGE database is searched to find results involving the tissue and Theiler Stage of interest. For each such result, if the strength of the result isdetected,strong,moderateorweak, then, in line 6 and 7, for each tissue in the current family line, a relation between each tissue and the gene in the result is added to the formal context being created, thus carrying out positive propagation of the gene’s expression.
The algorithm is then recursive, passing to itself successively each child of the current tissue along with the original Theiler Stage and the current family line of tissues. The mouse anatomy for each Theiler Stage is stored as a data set of (childtissue, parenttissue) pairs. Thus is it simply a case of searching for each instance of a parent tissue to enumerate its children.
FindDetectedGenesInTissue(tissue, tstage, f amily line) begin
1
f amily line←f amily line∪ {tissue} 2
foreachresultinEM AGEdatabasedo
3
if result.tissueN ame=tissueand result.stage=tstageand
4
(result.strength= “detected”orresult.strength= “strong”or
result.strength= “moderate”orresult.strength= “weak”)then remarkpositive propagation of gene expression:
5
foreachT issueinf amily linedo
6
context←context∪ {(result.gene, T issue)} 7
foreachchildof tissuein M ouseAnatomy(tstage)do
8
FindDetectedGenesInTissue(child, tstage, f amily line)
9
end
10
4
Concept Lattices of Gene Expression
and its components at Theiler Stage 16 and the second analysis of the develop-ment of theheart atrium over a number of Theiler Stages.
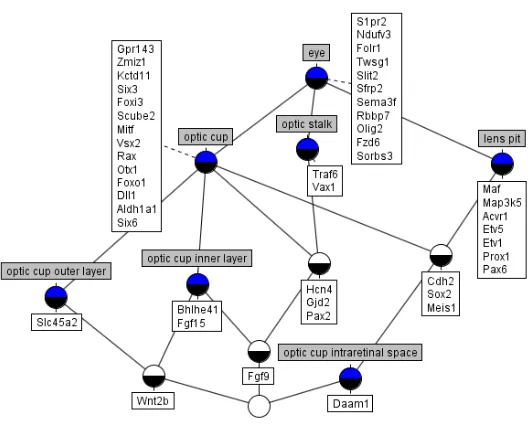
Figure 5 is a lattice showing gene expression in the eye at Theiler Stage 16. The genes expressed in the eye and its various components are clearly seen. In some cases, such as theoptic cup, there appears quite a large number of co-expressed genes. This may indicate that the tissue is composed of many different proteins or may be an example of several genes working together to produce a single protein - sometimes one or more ‘enabler’ genes are required for the ex-pression of the protein making gene [13]: the products of two genes, for example, (calledtranscription factors) work together to influence the expression of another gene and therefore the amount of protein product of that gene.
Other, more specialised tissues, such as theoptic cup intraretinal space, show the expression of a single gene, which may indicate that the tissue is predom-inantly composed of a single protein. There are also interesting cases of genes, such as Cdh2, that are expressed in two or more unrelated tissues (tissues that are not in the same branch in the anatomy ontology), in this case theoptic cup and thelens pit. This may indicate that, although not directly related, the tissues share some similarity in function or structure. It is also interesting to look at gene expression in tissues that clearly, from their names, have some commonality and often share the same parent tissue, such as the optic cup outer layer and theoptic cup inner layer. Here we can see that geneWnt2bis expressed in both layers, but also that each layer has genes specific to it. The shared gene may be responsible for a common function or structure whilst the specific genes may be responsible for the structural or functional differences between the tissues.
Fig. 5: Lattice of gene expression in theeye at Theiler Stage 16.
that it was activated in TS 15 (perhaps by Nppa) and is now being expressed in the specific tissue for which it is responsible. In the course of development, an early, undifferentiated tissue will have many genes activated within it that are then responsible for the development of the subsequent components of that tissue. Thecardiac muscles fail to appear in the TS 16 lattice but then reappear in the TS 17 lattice. Clearly they do not physically disappear and then reappear, so again this may be a case where the data is incomplete. It is also striking by how much gene expression changes over a small time-frame of development and in the same tissues. In fact, very few of the genes in the heart atrium lattices appear more than once and often the genes expressed in a particular tissue at one Theiler Stage are replaced by a completely different set of genes in the next Theiler Stage. At the moment, how much of this is due to rapid changes in tissue development and how much is due to missing data, is not known.
(a) TS 14 (b) TS 15
Fig. 6: Lattices of gene expression in theheart atrium across Theiler Stages 14 and 15.
5
Related Work
The work presented here builds on research carried out in the European CUBIST Project [17], where novel FCA-based analytics were being developed for a number of use-cases, one of which was the EMAP. One strand of CUBIST developed a technique for identifying large gene co-expressions, typically at the system level (e.g., in the skeletal system) [18]. Thus, for example, the work was able to identify all the genes involved with the construction of the skeletal system. Because of the large amount of missing data in EMAGE (simply due to the large number of genes and tissues involved) this technique employed an element of FCA ‘fault tolerance’ [19] to predict possible gene expressions at the system level.
(a) TS 16
[image:12.612.197.419.127.621.2](b) TS 17
saysdetectedbut another result with the same gene, same tissue (or a tissue that the first tissue is a part of) and same Theiler Stage saysnot detected.
FCA appears to be attractive in the study of gene co-expression because formal concepts are natural representations of maximal groups of co-expressed genes. For example, in [23] FCA was used to extract groups of genes with similar expressions profiles from data of the fungusLaccaria bicolor and in [24] human SAGE data provided the example from which clusters of genes with similar prop-erties are visualised. In both approaches the complexity, in terms of the large number of formal concepts present in the raw data, was managed by specifying a concept’s minimum size (the well known idea of minimum support in FCA and frequent itemset mining). In [24], tools were developed to query the set of extracted concepts according to various criteria (e.g., presence of a keyword in a gene description) and then to cluster concepts according to similarity, in terms of the attributes (samples) and objects (genes above a threshold of expres-sion) in them. They called these clustersquasi-synexpression-groups(QSGs). By contrast, in [25, 26], ranges of a measure of gene concentration were used as at-tributes and the genes as objects. Individual concepts that satisfied a specified minimum size were then examined by, for example, plotting the actual measures of concentration of genes together in a line plot.
Of course, non-FCA based visualisations of gene expression have also been used by researchers. A notable example is the heatmap, often used to visualise the results of micro-array gene expression profiling [27]. This is a technique for simultaneously measuring the expression levels of thousands of genes for a single sample on one micro-array chip. The micro-array technique is often used in clinical research where a sample of the same tissue is taken from each patient in the study and each sample placed in its own micro-array chip. In order to visualize the micro-array data of different samples, a colour-coded heatmap is generally used, along with a clustering algorithm, allowing the gene profiles to be compared. Figure 8 is such an example where each row is a cancer tumour sample and each column is a gene [28].
6
Conclusions and Further Work
This paper has demonstrated that FCA can provide a useful and novel visu-alisation of gene expression that combines gene and tissue profiles (i.e., allows both genes and tissues to be displayed together in a single graph. An algorithm called FindDetectedGenesInTissue has been developed that incorporates a de-fined mouse anatomy taxonomy to interrogate the EMAGE database of gene expression for all components of a specified tissue of interest. The algorithm also incorporates positive gene expression propagation to produce a natural hi-erarchical visualisation of gene expression based on the defined mouse anatomy ontology.
Fig. 8: Example of a heat-map of gene expression in cancer tumours. Source: [28].
assays still to be conducted, but once the database is complete, analyses across Theiler Stages should be more fruitful. Indeed it may be useful to develop a sort of ‘Theiler Stage algebra’ whereby, for a specific tissue of interest, one Theiler Stage (formal context) can be subtracted from another, for example, to deter-mine the expressions present in the first Stage but not the second. Alternatively, the intersection of two or more Stages could be carried out to determine the expressions that remain constant over that time.
Although researchers are usually interested in where genes are expressed, they are sometimes interested in finding out where genes are not expressed. The EMAGE database already records thesenot detected results and it would be a simple task to modify the algorithm and software to carry out the query. However, the incorporation of positive gene expression propagation would need to be replaced by its corollary, negative propagation. In this case, if a gene is not detected in a particular tissue, then it can be inferred that it is also not expressed in all the components of that tissue. The algorithm would thus have to be modified accordingly.
Given a complete EMAGE database, a tool can thus be envisaged that in-cludes the not detected query along with a simple set of Theiler Stage algebra and a simple user interface that would provide the researcher a useful technique for gene expression analysis of mouse embryo development.
References
1. Hamosh, A., Scott, A.F., Amberger, J.S., Bocchini, C.A., McKusick, V.A.: Online mendelian inheritance in man (omim), a knowledgebase of human genes and genetic disorders. Nucleic acids research33(2005) D514–D517
2. Ran, F.A., Hsu, P.D., Wright, J., Agarwala, V., Scott, D.A., Zhang, F.: Genome engineering using the CRISPR-Cas9 system. Nature protocols8(2013) 2281 3. Milunsky, A., Milunsky, J.M.: Genetic disorders and the fetus: diagnosis,
preven-tion, and treatment. John Wiley & Sons (2015)
4. Richardson, L., Venkataraman, S., Stevenson, P., Yang, Y., Moss, J., Graham, L., Burton, N., Hill, B., Rao, J., Baldock, R.A., et al.: Emage mouse embryo spatial gene expression database: 2014 update. Nucleic acids research 42 (2013) D835– D844
5. EMAP eMouse Atlas Project:http://www.emouseatlas.org(Accessed December 2017)
6. Ganter, B., Stumme, G., Wille, R., eds.: Formal Concept Analysis: Foundations and Applications. Volume 3626 of LNCS. Springer (2005)
7. Priss, U.: Formal concept analysis in information science. Annual Review of Information Science and Technology (ASIST)40(2008)
8. Wolff, K.E.: A first course in formal concept analysis: How to understand line diagrams. Advances in Statistical Software4(1993) 429–438
9. EMAGE gene expression database: http://www.emouseatlas.org/emage/ (Ac-cessed December 2017)
10. Theiler, K.: The house mouse: atlas of embryonic development. Springer Science & Business Media (2013)
11. Kaufman, M.H.: The atlas of mouse development. Volume 428. Academic press London (1992)
12. Yevtushenko, S.A.: System of data analysis “concept explorer” (in russian). In: Proceedings of the 7th national conference on Artificial Intelligence KII-2000. (2000) 127–134
13. Morgunova, E., Taipale, J.: Structural perspective of cooperative transcription factor binding. Current Opinion in Structural Biology 47(2017) 1–8
14. Boyer, L.A., Lee, T.I., Cole, M.F., Johnstone, S.E., Levine, S.S., Zucker, J.P., Guen-ther, M.G., Kumar, R.M., Murray, H.L., Jenner, R.G., et al.: Core transcriptional regulatory circuitry in human embryonic stem cells. cell122(2005) 947–956 15. Wang, X., Guda, C.: Computational analysis of transcriptional circuitries in human
embryonic stem cells reveals multiple and independent networks. BioMed research international2014(2014)
16. Andrews, S., Hirsch, L.: A tool for creating and visualising formal concept trees. CEUR Workshop Proceedings: Proceedings of the Fifth Conceptual Structures Tools & Interoperability Workshop (CSTIW 2016)1637(2016) 1–9
17. Dau, F., Andrews, S.: Combining business intelligence with semantic technologies: The CUBIST project. In Hernandez, N., J¨aschke, R., Croitoru, M., eds.: Graph-Based Representation and Reasoning: Proceedings of the 21st International Con-ference on Conceptual Structures. Volume 8577 of LNAI., Springer (2014) 281–286 18. Andrews, S., McLeod, K.: Gene co-expression in mouse embryo tissues.
Interna-tional Journal of Intelligent Information Technologies (IJIIT)9(2013) 55–68 19. Pensa, R.G., Boulicaut, J.F.: Towards fault-tolerant formal concept analysis. In
20. Melo, C., Le-Grand, B., Aufaure, M.A., Bezerianos, A.: Extracting and visualising tree-like structures from concept lattices. In: Proceedings of the15th International Conference on Information Visualisation, IEEE (2011) 261–266
21. Taylor, A., McLeod, K., Burger, A.: Semantic visualisation of gene expression infor-mation. In Andrews, S., Dau, F., eds.: Proceedings of the 3rd CUBIST Workshop. Volume 1040 of CEUR Workshop Proceedings., CEUR (2013)
22. Dau, F.: Towards scalingless generation of formal contexts from an ontology in a triple store. International Journal of Conceptual Structures and Smart Applica-tions (IJCSSA)1(2013) 18–38
23. Kaytoue-Uberall, M., Duplessis, S., Napoli, A.: Using formal concept analy-sis for the extraction of groups of co-expressed genes. Volume 14 of CCIS., Berlin/Heidelberg, Springer-Verlag (2008) 439–449
24. Blachona, S., Pensab, R.G., Bessonb, J., Robardetb, C., Boulicautb, J.F., Gan-drillona, O.: Clustering formal concepts to discover biologically relevant knowledge from gene expression data. In Silico Biology7(2007) 476–483
25. Kaytoue, M., Duplessis, S., Kuznetsov, S., Napoli, A.: Two fca-based methods for mining gene expression data. In Ferre, S., Rudolph, S., eds.: ICFCA 2009. Volume 5548 of LNAI., Springer (2009)
26. Kaytoue, M., Kuznetsov, S.O., Napoli, A., Duplessis, S.: Mining gene expression data with pattern structures in formal concept analysis. Information Sciences181
(2011) 1989–2001
27. Tarca, A.L., Romero, R., Draghici, S.: Analysis of microarray experiments of gene expression profiling. American journal of obstetrics and gynecology 195(2006) 373–388
![Fig. 1: Part of the anatomy ontology for Theiler Stage 13. Source: [5].](https://thumb-us.123doks.com/thumbv2/123dok_us/678656.570602/4.612.191.430.215.502/fig-anatomy-ontology-theiler-stage-source.webp)


![Fig. 8: Example of a heat-map of gene expression in cancer tumours. Source: [28].](https://thumb-us.123doks.com/thumbv2/123dok_us/678656.570602/14.612.199.419.116.292/fig-example-heat-gene-expression-cancer-tumours-source.webp)