through formal concept analysis
WATMOUGH, Martin
Available from Sheffield Hallam University Research Archive (SHURA) at:
http://shura.shu.ac.uk/7706/
This document is the author deposited version. You are advised to consult the publisher's version if you wish to cite from it.
Published version
WATMOUGH, Martin (2013). Discovering the hidden knowledge in transaction data through formal concept analysis. Doctoral, Sheffield Hallam Univeresity.
Copyright and re-use policy
See http://shura.shu.ac.uk/information.html
Sheffield Hallam University Research Archive
Martin John Watmough
A thesis submitted in partial fulfilment of the requirements of Sheffield Hallam University
for the degree of Doctor of Philosophy
The aim of this research is to discover if hitherto hidden knowledge exists in transaction data and how it can be exposed through the application of Formal Concept Analysis (FCA).
Enterprise systems capture data in a transaction structure so that they can provide information that seeks to align with the knowledge that decision-makers use to achieve business goals. With the emergence of service-oriented architecture and developments in business intelligence, data in its own right is becoming significant, suggesting that data in itself may be capable of capturing human behaviour and offer novel insights from a ‘bottom-up’ perspective. The constraints of hard-coded top-down analysis can thus be addressed by agile systems that use components based on the discovery of the hidden knowledge in the transaction data.
There is a need to connect the user’s human-oriented approach to problem solving with the formal structures that computer applications need to bring their productivity to bear. FCA offers a natural approach that meets these requirements as it provides a mathematical theory based on concepts, logical relationships that can be represented and understood by humans.
By taking an action research and case study approach an experimental environment was designed along two avenues. The first was a study in an educational setting that would combine the generation of the data with the behaviour of the users (students) at the time, thereby capturing their actions as reflected in the transaction data. To create a representative environment, the students used an industry standard SAP enterprise system with the business simulator ERPsim. This applied study provided an evaluation of FCA and contemporary tools while maintaining a relevant pedagogic outcome for the students.
The second avenue was a discovery experiment based on user activity logs from an actual organisations productive system, applying and developing the methods applied previously. Analysis of user logs from this system using FCA revealed the hitherto hidden knowledge in its transaction data by discovering patterns and relationships made visible through the multi dimensional representation of data.
The evidence gathered by this research supports FCA for exposing and discover-ing hidden knowledge from transactional data, it can contribute towards systems and humans working together more effectively.
fascinating particularly as it embraces both technical and human aspects.
Identifying opportunities for driving holistic improvements is the dominant mo-tivator; these can range from very simple changes and basic education through to introducing new technologies and processes. Frequently the first steps in this process are just to listen, understand and apply knowledge.
My background led to studying for personal improvement and in a small way re-sulted in a contribution to knowledge. Challenging as this was, probably the most rewarding experience through this journey has been gained from the opportunity to teach, share and debate in conjunction with collecting experimental data.
The research drew upon an opportunity to generate experimental data in an educa-tional setting using ERPsim, an enterprise system simulator. This provided a rich set of data in controlled and observable environment. Limitations in the simulator led to a second avenue of experimentation based on user activity using data gathered from an organisation’s productive system. A new version of ERPsim for the 2013/14 academic year includes the capability to capture user activity data but this will have to form a topic for further work.
Chapter 1 introduces the motivation for the research establishes the research aim, to discover if hitherto hidden knowledge exists in transaction data and how it can be exposed through the application of Formal Concept Analysis.
Chapter 2 considers the background, intentions and visions within transactional systems and analysis. The difficulties involved in understanding the dynamics of an organisation are discussed. This is due to many factors including the complexity of applications and technology, increasing data volumes and competition forcing constant change.
Chapter 3 focuses on the application of FCA to transactional data. An introduc-tion to Formal Concept Analysis and a synopsis of alternative semantic technologies contrasted with FCA for discovering knowledge in transactional data. .
Chapter 4 provides an overview of an opportunity to observe and evaluate the appli-cation of FCA and contemporary techniques; a comprehensive description is included in appendix E. Learning, Teaching and Assessment (LTA) involving two degree mod-ules over several years provided the environment for creating an immersive experience for students and generated experimental data in an ethical manner.
Evaluation of the LTA outputs provided an understanding of the findings and insight into the application of FCA. Moderated assessment criteria provided tangible measures
data for analysis.
Chapter 5 draws on user activity data extracted directly from a productive system. This practical application of FCA highlights processes where bottom-up analysis can uncovered useful information and knowledge.
Chapter 6 brings together the results from the LTA and user-activity based experi-ments. A discussion follows with examples of knowledge discovered from transactional data. Suggested and justified requirements for the successful application of FCA are presented and aligned with domains where FCA is potentially justifiable and cost ef-fective.
Chapter 7 concludes and discusses directions for further work required to develop FCA into a practical application integrated into a BI solution.
I am grateful for the ideas and support Dr. Babak Khazaei has given me, spurring me on through some difficult times.
Thanks also to the students at Sheffield Hallam University who supported my re-search. I hope my lecturing, enthusiasm and support has helped in a small way towards your own goals, I certainly enjoyed the experience and time spent with you.
For my darling Angy, family, friends, Cairo and Teetee.
1 Introduction and Motivation for Research 1
1.1 Introduction . . . 1
1.2 Motivation . . . 2
1.3 Research Aim . . . 6
1.4 Research Approach . . . 7
1.4.1 Ethics . . . 14
1.5 Overview of Thesis . . . 15
2 Discovery of Knowledge in Transactional Data 17 2.1 Introduction . . . 17
2.1.1 Overview . . . 18
2.2 Transactional Systems . . . 19
2.2.1 Enterprise Resource Planning . . . 21
2.2.2 Transactions and Relational Databases . . . 26
2.3 Business Intelligence . . . 27
2.3.1 Business Intelligence and Knowledge Management . . . 30
2.3.2 The Need for Business Intelligence . . . 33
2.3.3 Challenges for Business Intelligence . . . 34
2.3.4 Aims of Business Intelligence . . . 34
2.3.5 Data Mining . . . 35
2.5 Discovery Techniques and Applying Knowledge . . . 52
2.5.1 Knowledge and Human Capabilities . . . 52
2.5.2 Conceptual Knowledge Discovery . . . 60
2.5.3 Knowledge Representation Techniques . . . 63
2.6 Conclusion . . . 66
3 Formal Concept Analysis 68 3.1 Introduction . . . 68
3.2 Formal Concept Analysis . . . 69
3.2.1 Origins of FCA . . . 69
3.2.2 Formal Concept and Formal Context . . . 69
3.3 Concept Lattice . . . 71
3.3.1 Minimum Support . . . 74
3.3.2 FCA from a Philosophical Perspectives . . . 75
3.4 FCA Applications . . . 78
3.5 Overview of Analysis . . . 81
3.6 Concluding Summary . . . 84
4 Findings from an LTA Design Experiment 85 4.1 Introduction . . . 85
4.2 Discovery through an LTA Design . . . 86
4.2.1 Pedagogy . . . 88
4.2.2 Discussion . . . 90
4.3 Aims of Empirical Analysis . . . 92
4.3.3 Design of FCA Method . . . 95
4.3.4 Coursework Design and Alignment . . . 97
4.3.5 Working with Data in NVivo . . . 99
4.4 Empricial Anaylsis . . . 105
4.4.1 Word Frequency . . . 105
4.4.2 Choice of Data . . . 110
4.4.3 Choice of Tools and Visualisation . . . 110
4.4.4 Discovered Knowledge . . . 112
4.5 Method Evaluation . . . 114
4.5.1 Assignment: Data . . . 115
4.5.2 Assignment: Discovery Techniques . . . 115
4.5.3 Assignment: Expert Knowledge . . . 117
4.6 Concluding Summary . . . 117
5 Knowledge and Relationship Discovery from User Activity 119 5.1 Introduction . . . 119
5.2 Enterprise System Use Case . . . 120
5.2.1 Rationale . . . 121
5.2.2 Data Preparation . . . 121
5.2.3 Analysing Transactional Activity . . . 123
5.2.4 Analysing Transactional Activity with Descriptions . . . 127
5.2.5 Analysing Transactional Activity with Multiple Attributes . . . 130
5.2.6 Analysing Transactional Activity with Direct Comparison . . . 132
5.2.7 Analysing Transactional Sequence . . . 133
5.3 Evaluation . . . 137
5.3.1 Framework . . . 139
6.4 Cost Effectiveness Analysis . . . 150
6.5 Requirements for Successful FCA . . . 158
6.6 Concluding Summary . . . 159
7 Conclusions and Further Work 161 7.1 Retracing the Events . . . 161
7.2 Lessons Leant from Action Research . . . 163
7.3 Contribution to Knowledge . . . 165
7.4 Conclusion . . . 168
7.5 Limitations and Further Work . . . 168
7.5.1 Word Count . . . 171
References 172 A Ethics Statement Presented to Students 185 B Word Frequency NVivo 186 C Knowledge Discovery 191 C.0.2 Excel/BI Explicitly used for Knowledge Discovery . . . 191
C.0.3 FCA Explicitly used for Discovery . . . 193
D Complete set of Coding Nodes Applied in NVivo 195 E Discovery through an LTA Design 197 E.1 Introduction . . . 197
E.2.2 Pedagogy . . . 200
E.3 Comparing FCA to Contempory BI tools . . . 202
E.3.1 Method . . . 203
E.3.2 Student Results . . . 205
E.3.3 Discussion . . . 206
E.3.4 Review of Learning Outcomes . . . 210
E.4 Incremental Development of LTA . . . 212
E.4.1 Method . . . 212
E.4.2 Case Study Review . . . 213
1.2 Deviation per Section from Student Average Mark . . . 11
1.3 Combination of Biggs’ Constructive Alignment (Andrews, 2011a) (Biggs and Tang, 2011) and Yin’s Case Study Method (Yin, 2009) . . . 12
2.1 Structure of Business Application (Plattner, 2008) . . . 25
2.2 Evolution of Enterprise Application Platforms (Plattner, 2008) . . . 26
2.3 Table Joins in a Database . . . 28
2.4 Business Intelligence Capabilities after Sabherwal and Becerra-Fernandez (2011) . . . 30
2.5 Reporting Consideration . . . 33
2.6 Data Mining (Cios et al., 2007) . . . 36
2.7 Relative Effort Spent of Specific Steps of the KD Process (Pal, 2005) cited in (Cios et al., 2007) . . . 36
2.8 Simple Clustering Example . . . 37
2.9 Decision Tree (Lingras and Akerkar, 2008) . . . 38
2.10 Service-Orientated Architecture (Krafzig et al., 2004) . . . 40
2.11 Current ERP and BI Landscapes (Muller, 2013) . . . 42
2.12 Future Landscapes ERP and BI based on in-Memory (Muller, 2013) . . 42
2.13 Current Supply Chain Data Usage (Watmough et al., 2010) . . . 50
Caas, 2008) . . . 58
2.16 Conceptual and non conceptual activities in a business (Dominque et al., 2011a) . . . 60
2.17 Semantic offering according to area (Dominque et al., 2011a) . . . 61
2.18 Usefulness of Rules and Granularity (Cios et al., 2007) . . . 64
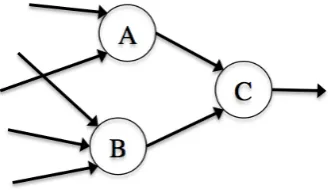
2.19 Example of Graph and Directed Graph . . . 65
2.20 Example of Decision Tree . . . 65
2.21 Example of Network . . . 66
3.1 A Formal Concept - (A,B) . . . 70
3.2 Simple Concept in a Formal Context or Cross Table (Ganter and Wille, 1999) . . . 71
3.3 Formal Context or Cross Table (Ganter and Wille, 1999) . . . 71
3.4 Example Lattice . . . 72
3.5 Conceptual Scaling Examples (Ganter and Wille, 1999) . . . 73
3.6 Before Minimum Support Applied . . . 75
3.7 After Minimum Support Applied . . . 75
3.8 FCABedRock . . . 81
3.9 InClose2 . . . 82
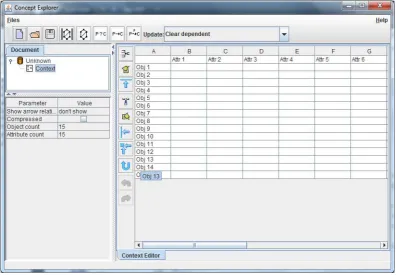
3.10 Concept Explorer . . . 82
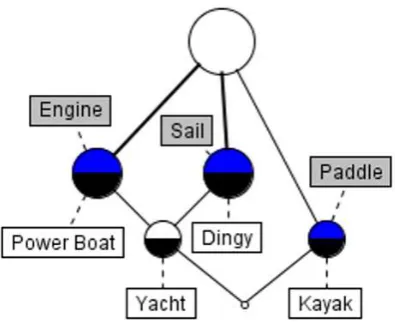
3.11 Simple Lattice . . . 83
3.12 Concept Table for Simple Lattice . . . 84
4.1 Simplified Process and Data Model . . . 95
4.2 SAP ECC Basic Process Flows . . . 100
4.3 Sources in NVivo . . . 100
4.4 Sources in NVivo . . . 102
4.10 Decision Points Mapping Model . . . 109
4.11 Example of Student applying Knowledge . . . 113
5.1 FcaBedrock . . . 124
5.2 Transaction Based Lattice . . . 126
5.3 Concept Table for Transaction Based Lattice . . . 127
5.4 Excel Concept Table with Calculated Values in Excel . . . 128
5.5 Transaction Lattice Represent by Basic Transaction Descriptions . . . . 129
5.6 User Transactions . . . 131
5.7 User Transactions limited to Target Transaction VA01 . . . 133
5.8 User Transactions for User 1257 (left) 468 (right) . . . 134
5.9 Lattice for Transaction Flow for an Individual User . . . 135
5.10 Lattice with VA01 and Related Transactional Areas . . . 136
6.1 Examples of Correlations . . . 144
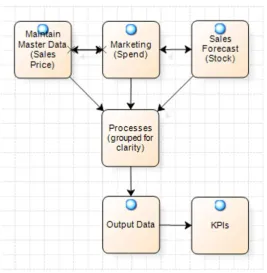
6.2 KPI Relationships . . . 149
6.3 Relationships: Object Count - Extent (left), Own Objects (right) . . . 150
6.4 KPI Relationships: Own Objects . . . 151
6.5 Grouping KPIs and Discrete Values . . . 152
6.6 Process Iteration Cycle . . . 153
6.7 CEA Costs . . . 156
6.8 CEA Benefits . . . 157
D.1 Complete set of Coding Nodes Applied in NVivo . . . 196
degree or diploma in any university, and to my best knowledge and belief, this thesis contains no material published or written by another person, except where due reference is made in the thesis.
AR Action Research BI Business Intelligence
BPM Business Process Modelling BPP Business Process Platform CEA Cost Effective Analysis CEP Complex Event Processing
CKDD Conceptual Knowledge Discovery In Databases CRM Customer Relationship Management
CSV Comma-Separated Values DW Data Warehouse
ERP Enterprise Resource Planning FCA Formal Concept Analysis FOL First Order Logic
IOT Internet of Things IT Information Technology
KDD Knowledge Discovery In Databases KDP Knowledge Discovery Process KM Knowledge Management KPI Key Performance Indicator
LTA Learning, Teaching and Assessment OLAP On-Line Analytical Processing
S&OP Sales and Operations Planning SCM Supply Chain Management SOA Service Orientated Architecture SQL Structured Query Language UI User Interface
WF Work Flow
1.1 Chronology of Teaching Methods and Results . . . 10
2.1 Distinctions between BI and Other Related Technologies (Sabherwal and Becerra-Fernandez, 2011) . . . 32
2.2 Example of S&OP Process, Data Aggregation and Communication (Wat-mough et al., 2010) . . . 49
2.3 Semiotic Ladder, after Liebenau and Backhouse (1990) . . . 57
4.1 Smart Applications 2010-11 (top) and 2011-12 (bottom) . . . 99
4.2 Enterprise Systems 2010/11 (top) and 2011/12 (bottom) . . . 101
4.3 Summary of Sources Coded . . . 104
4.4 Section from FCA Word Frequency . . . 107
4.5 Matched Word Sets between FCA and Excel/BI . . . 108
4.6 Frequency of Coded Applications by Analysis Tools . . . 112
5.1 Example Input File . . . 123
5.2 Example Input File with Descriptions . . . 129
5.3 Example Input File containing Multiple Attributes . . . 132
5.4 Example Input File containing the Sequence of Transaction . . . 134
6.1 Correlation between sections: SA 2010-11 . . . 146
6.2 Correlation between sections: ES 2010-11 (Group) . . . 146
B.2 Words in Excel/BI not in FCA . . . 188 B.3 Matched in FCA . . . 189 B.4 Match in Excel/BI . . . 190 C.1 Sales Forecast . . . 191 C.2 Maintain Master Data (Sales Price) . . . 192 C.3 Marketing . . . 192 C.4 Other . . . 192 C.5 Sales Forecast . . . 193 C.6 Maintain Master Data (Sales Price) . . . 193 C.7 Marketing . . . 193 C.8 FCA: Other . . . 194 C.9 Summary . . . 194 E.1 Methods Applied under BI . . . 205 E.2 Methods Applied under FCA . . . 206 E.3 Pros and Cons for BI . . . 206 E.4 Pros and Cons for FCA . . . 207 E.5 Chronology of Teaching Methods and Results . . . 214
Introduction and Motivation for
Research
1.1
Introduction
The aim of this research is to discover if hitherto hidden knowledge exists in trans-actional data and how it can be exposed through the application of Formal Concept Analysis (FCA).
With the emergence of service-orientated architecture and developments in business intelligence, data in its own right is becoming significant, suggesting that data in itself may be capable of capturing human behaviour and offer novel insights from a bottom up perspective.
Knowledge discovery is considered to be an active cycle of applying understanding and information. The traditional definition of knowledge as belief, trust and justifi-cation and how it is internalised in order to be used is discussed further in section 2.4. This leads onto the application of knowledge; essentially working with knowledge in section 2.5. Discovery is an action or process (Oxford, 2012) and represents the combination of systems and humans. This process uses interaction and visualisation to expose information and knowledge for consumption, reasoning and application in the search for hidden knowledge.
connect the user’s human-orientated approach to problem solving and decision making with the formal structures that computer applications need to bring their productivity to bear.
This chapter introduces the motivation for the research and establishes the research aim. The research approach is outlined, using enterprise systems as an exemplar for transactional data followed by an overview of the thesis. The chapter is completed with a list of prior work contributing towards the research.
1.2
Motivation
The motivation for this research came from observing shortcomings when implement-ing and supportimplement-ing complex systems in modern businesses. Enterprise systems are frequently implemented to meet perceived or current requirements but a lack of flex-ibility hinders change and progress. As a result complexity increases with poorly integrated functions and systems that negatively impact performance. As stated by Plattner (2008) users of enterprise applications should be shielded from complexity. This does not mean that they should be limited in deriving value from systems and data.
While change is inevitable, the demise of transaction based systems such as Enter-prise System is unlikely in anything but the distant future, therefore research in this domain will not become out of date quickly.
Enterprise systems capture data in a transaction structure so that they can provide information that seeks to align with the knowledge that decision-makers use to achieve business goals. Traditionally this has been achieved by a top down approach whereby the business process is designed then the data is set according to that human-oriented model. However with the emergence of service-oriented architecture and developments in business intelligence, data in its own right is becoming significant, suggesting that data in itself may be capable of capturing human behaviour and offer novel insights from a bottom up perspective. The constraints of hard-coded top-down analysis can thus be addressed by agile systems that use components based on the discovery of the hidden knowledge in the transaction data.
Information is a key business resource that most business people do not recognise (Gordon, 2007). Organisations rely on information for decision making. Capture, storage and most importantly the management and analysis of information is often deemed technical and constrained to Information Technology (IT) departments. This makes connecting the right people with the right data in effective formats and contexts a key motivator.
The consumption and generation of data will enable greater capabilities and perfor-mance providing organisations can adapt and benefit from the potential agility offered by these systems. There is a need to connect the user’s human-oriented approach to problem solving with the formal structures that computer applications need to bring their productivity to bear.
knowledge can be static and not reflective of changes or developments.
Data must have unambiguous meaning (Gordon, 2007). Sharing and processing data rapidly fails if the means are not aligned. Semantics is about meaning, a simple definition is “semantics = data + behaviour ” (McComb, 2004), this suggests that if the semantic content can be identified it may be possible to understand or determine behaviour. Organisations generate a large amount of data across multiple systems and organisations therefore this represents a significant challenge.
Initial thoughts suggested that any pre existing structures in the data are lost during the analysis. It is proposed to investigate if pre existing structures can be maintained while supporting the discovery of knowledge from transactional data. Furthermore, can this also include relationships between loosely connected systems.
Many real-world knowledge discovery tasks are both too complex to be accessible by simply applying a single learning or data mining algorithm and too knowledge-intensive to be performed without repeated participation of the domain expert (Hereth et al., 2003). Better support for knowledge discovery requires data that is both universal and based on practical conceptual models.
capabilities that support these functions and is therefore considered worthy of research with a strong emphasis on comparison and evaluation against contemporary techniques. The primary focus of this research is the analysis of the data this, however, depen-dencies on technologies and enterprise systems exist. The hardware side of technology and enterprise architecture are peripheral to the main scope of this research but remain an important consideration.
Devlin (1997) states that humans have tried to represent knowledge and understand the laws of thought for thousands of years and that we are still unable to explain exactly how our minds perform such feats . He argues that “our minds are intimately inter-twined with the world around us, and that our feelings and perceptions, even our social norms, play crucial roles in the marvellous complex dance of human cognition”. The presentation and interactions with data and systems is highly influential and therefore should be a focus of this research.
Transactional systems support organisations in a variety of ways. These include storing and retrieving data, control mechanisms, workflow and reporting to mention a few. If one of the leading vendors is considered they, SAP A.G., consider that 65-70% of the worlds transactions are run on SAP (Clark, 2011). SAP have more than 102,500 customers in 120 countries which is predicted to equate to one billion users by 2015 (Brandt, 2010). To put this in proportion that data acquired and analysed in Chapter 5 represents approximately 35,000 transactions in a one week period for 12 users, considering the anticipated growth in the number of applications and transactions the volume of data will be very large to say the least.
sequence is a process with an aim of meeting the goals of the Enterprise.
Data is created, stored, consumed, transformed, and shared in many ways. A growing proportion is captured electronically however the distribution and range of formats is vast. One projection is that the production of data will grow 44 times by 2020, much of this data being unstructured and an important shift will be towards connecting data to reveal new insights (CSC, 2012). In additional to unstructured data such as audio or visual media, structured data will also expand from traditional relational databases to distributed and integrated systems.
Creating value from data is a fundamental requirements but also a major challenge without new techniques that address the complexity and volumes in a manner that compliments human and systems capabilities. Complimenting humans should be em-phasised as replacing the brain is beyond the scope on this research, in fact it is almost beyond the scope of comprehension. Two significant projects are under way at the Allen Institute for Brain Science and Ecole Polytechnique F’d’rale de Lausanne with the aim of reverse engineering and documenting the brain respectively(Evans-Pughe, 2013). These are long term collaborative projects that are many years from reaching their targets, this is why a discover mechanism capable of deriving knowledge without or minimising human input forms the foundations of the research question.
1.3
Research Aim
The aim of this research is to discover if hitherto hidden knowledge exists in transaction data and how it can be exposed through the application of Formal Concept Analysis. This is valuable to the analysis, design and actual usage within enterprise systems. The following objectives are explored within this research:
to discover hidden knowledge within enterprise systems.
2. To provide an approach for teaching FCA and elicit how FCA could be integrated into BI.
3. To provide an improved application of discovery techniques in transactional data, focussing on FCA and evaluated against alternative analysis techniques.
4. To enable knowledge sharing and reuse in order to deepen the understanding of transactional data and processes within enterprise systems.
5. To provide a understanding of knowledge derivable from transactional data and support a paradigm shift for system design.
1.4
Research Approach
As a strategy Action Research (AR) and Case Studies provide a participative and practical means of researching (McKernan, 1996) by capturing examples suitable for generating and testing hypotheses (Yin, 2009). In combination with individual practi-cal experiments and research AR has been used because of its strengths in educational, social and organisation development to research through Learning, Teaching and As-sessment (LTA).
An action research and case studies strategy iteratively developed an environment for generating experimental data representative of industry standards. Action research formed the overarching methodology that used case studies for specific sections of the research. Case studies formed a useful method for segmenting and structure the creation and collection of experimental data in an educational environment.
studies structure is also illustrated.
The secondly discovery experiment based on user activity logs from a real organ-isation applied and developed the analysis method. This data was not available in ERPsim but from the perspective of understanding human behaviour it was important to explore and develop an understanding of the hidden knowledge available. Building on the methods and techniques developed previously desktop research and experimen-tation applied a structured search for hidden knowledge.
All research has three main purposes (McNiff and Whitehead., 2009), AR has been applied to support these as follows:
1. Creating new knowledge and making claims to knowledge: By the developing an
environment for applying FCA to transactional data in a formal LTA structure methods can be repeated and outcomes documented. Individual research also contributed and combined into this cycle.
2. Testing the validity of knowledge claims: The methods established can be
re-peated and findings compared iteratively as case studies in an educational envi-ronment and by peer review through publications.
3. Generating new theory: A combination of the above coupled with a
action-reflection cycle, see figure 1.1, that is inherent in the AR method provides a strong foundation to improve understanding of events, situations and problems (McKernan, 1996) while provide intellectual rigour.
Figure 1.1: An Action-Research Cycle (McNiff and Whitehead, 2006)
(McKernan, 1996), a facet that LTA in particular will embody through the assessment cycle.
The techniques summarised in table 1.1 progressively develop the teaching and assessment methods, the output of iterative evaluation and reflection within the action research cycle. Techniques included learning in conjunction with ERPsim, a mix of individual and group work approaches and comparisons with alternative approaches. Refer to appendix E for a more detailed account.
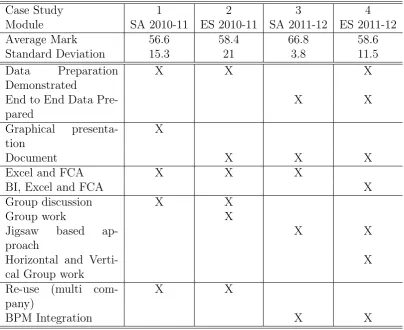
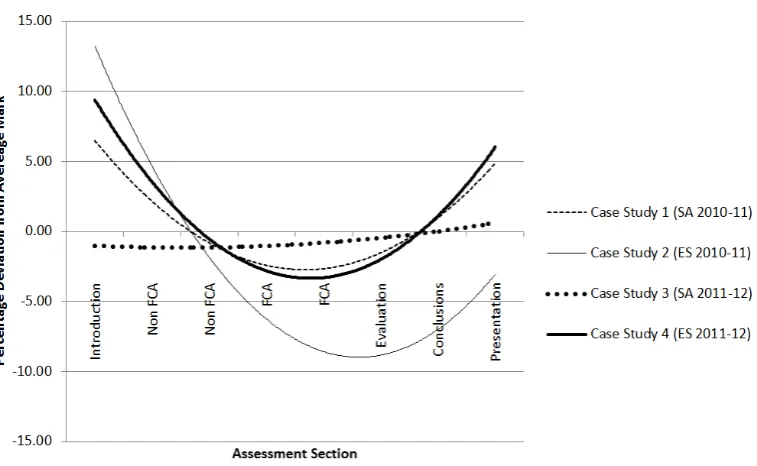
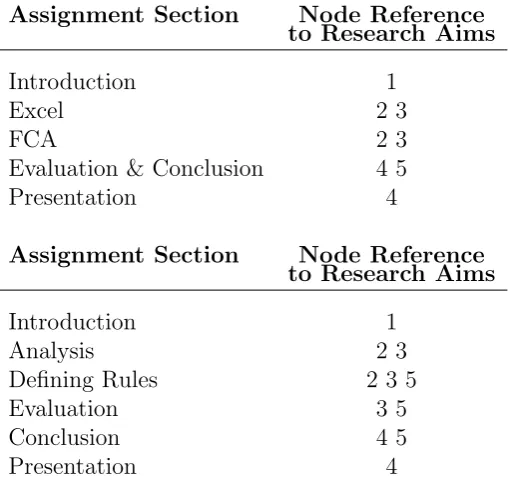
The graph in figure 1.2 indicates how the assignment marks deviated from the average mark for each module for each case study. The changes implemented aimed to improve the overall teaching and paid particular attention to FCA as this featured a negative deviation. Taking case study 4 as an example, the students achieved higher than the average percentages for the introduction and lower for the FCA sections. The perfect line would run through zero with each student achieving the same percentage for each section of the assignment; as this is based on the average the result does not differentiate between high and low achieving students.
LTA has been used and integrated with individual research in order to discover hidden knowledge in transactional data by incorporating FCA into two degree modules
Case Study 1 2 3 4 Module SA 2010-11 ES 2010-11 SA 2011-12 ES 2011-12 Average Mark 56.6 58.4 66.8 58.6 Standard Deviation 15.3 21 3.8 11.5 Data Preparation
Demonstrated
X X X
End to End Data Pre-pared
X X
Graphical presenta-tion
X
Document X X X
Excel and FCA X X X
BI, Excel and FCA X Group discussion X X
Group work X Jigsaw based
ap-proach
X X
Horizontal and Verti-cal Group work
X Re-use (multi
com-pany)
X X
[image:32.595.100.505.251.581.2]Figure 1.2: Deviation per Section from Student Average Mark
at Sheffield Hallam University. This provides a forum for discussion and a source of quantitative and qualitative data for evaluation. Semantic Technologies, graphical concept modelling and contemporary analysis tools are also included in the course content, these have been applied to the same research questions and contrasted with FCA.
The undergraduate ‘Smart Applications’ module applies FCA as a potential smart technology and aims to draw comparisons and integrate FCA within this context. The second module ‘Enterprise Systems’ is postgraduate and aims to forward the research subject area specifically within ERP systems and BI. Enquiry based learning is useful to learning from students who have no previous bias to FCA. An insight into how learning and applying good pedagogic methods was also envisaged for application outside of an educational setting.
of experimental data while supporting a good pedagogic outcome for the students.
Figure 1.3: Combination of Biggs’ Constructive Alignment (Andrews, 2011a) (Biggs and Tang, 2011) and Yin’s Case Study Method (Yin, 2009)
Yin’s method was used to capture and learn from a number of case studies, where each case study represents the respective modules’ assignments. Case study methods can feature a number of disadvantages, McKernan (1996) identified that they are time consuming, suffer from researcher bias who can be ‘taken in’ by respondents as well as a lack of generalisation. Aligning with the degree courses represented a long duration however this suited the time scale of this research and provided rigour and reliable results. Bias and questioning the results had to be considered during the analysis and reflection periods. Generalisation with respect to FCA was considered to be addressed through the inclusion of alternative analysis techniques and challenging students to critically evaluate multiple approaches.
Yin method describes case studies as the preferred method for answering ‘how’ or ‘why’ questions where the investigator has little control over events and the focus is
within a real-life context (Yin, 2009). The assessment sets a goal for the students and targets the research aims while only guiding the actual analysis required. To this end the key themes of the assessment’s design include graphical analysis, mandatory use of FCA and alternative techniques to contrast and explain how the techniques have been applied. Pedagogy also forms a significant proportion of the LTA cycle as it can significantly influence the outcome. In addition to the marks awarded for the assessments the capability of case studies methods to consider multiple sources of evidence is very suitable and therefore qualitative data including feedback, observations and the assignment contents have also been included.
Biggs’ Constructive Alignment has two basic concepts; learners construct meaning from what they do to learn and that the teacher makes an alignment between learning activities and learning outcomes (Biggs and Tang, 2011). The combination of Biggs’ constructive alignment and Yin’s Case Study Method provides an overall method for aligning the learning activities and learning outcomes for the benefit of future students (Yin, 2009). It was also envisaged that an insight into the introduction of FCA into an organisation’s business intelligence capability would be gained.
Siemens and Gasevic (2012) position learning analytics as currently sitting at a crossroads between technical and social learning theory fields . A real life context has been provided by applying ERPsim, this is a large scale business simulation based on Enterprise Resource Planning (ERP) enterprise system by leading provider SAP A.G. (SAP, 2012a), a global business software vendor. There is a technical learning aspect with interaction in competitive teams enforcing social interaction.
modules and the organisation providing production data. This was created follow-ing submission and acceptance of the research approach in accordance with Sheffield Hallam University’s Research Ethics Policy, the statement presented is contained in appendix A .
Explicit permission was granted to use the students assessment data; the students were informed that their work was being used for this research both during lectures and in feedback as part of the module review process. The students attention focused on engaging in a business simulation that gave them the opportunity to experience real-life business decision-making and how data that reflects that experience is generated and its value, as if they were industrial practitioners. This is because the research focuses on how data semantics and knowledge may be applied in industry rather than educational research in its own right.
The students learning was intended to be strengthened from this simulated in-dustrial experience enhancing their employability and future careers. All data was anonymised so that it cannot be traced to individual students.
1.5
Overview of Thesis
Chapter 2 starts by considering some of the intentions and visions within transactional systems and associated analysis. Enterprise systems and business intelligence have been considered as exemplars for transactional data and analysis as they are widely applied in organisations and can be used as a data source and for comparison. Enterprises Sys-tems provide organisations with a capability to capture, process, communication and analyse data in the pursuit of their objectives. System are evolving in both complexity and data volume resulting in an increasing challenge to derive and apply knowledge. There is a need for discovering knowledge though an analysis method capable of dis-covering relationships that enhances human capabilities whilst being congruent with system-based computation
Chapter3 provides an introduction to the theoretical foundations of Formal Concept Analysis (FCA) used in this research for discovering knowledge in transaction data, the core focus being on the application of FCA.
FCA provides a mathematical theory based on concepts; logical relationships that can be represented and understood by humans, essentially information and knowledge. The capability to analyse large data sets and discover relationships through tabular or graphical analysis provides a useful mechanism that can be applied to transaction data. The steps involved in applying FCA are described, starting from source data through to tabular and graphical lattice representation.
generate ideas. Querying, modelling and reporting is described including the theories and conclusions developed. Results include the knowledge discovered from transac-tional data and an assessment of FCA’s ability to explorer complex systems.
Chapter 5 explores how the application of FCA as a discovery mechanism to user trans-action logs offers an insight into the actual patterns of use. User transtrans-action logs are frequently overlooked as a source of data even though they offer a rich but complex source of data. The data set was captured from a real system carrying out its normal operations.
Chapter 6 combines a mixture of qualitative and quantitative analysis to consider and reflect on the research question, the discovery of hidden knowledge in transactional data. This focusses on the discovery process with actual knowledge discovered as sup-porting evidence. Quantitative analysis is used to highlight patterns and answer if FCA is capable of helping in the discovery of hidden knowledge. Cost Effectiveness Analysis (CEA) has been applied to understand how and where FCA can add value. Finally reflection is used to gather and consider the requirements for successfully ap-plying FCA as a method for knowledge discovery.
Discovery of Knowledge in
Transactional Data
2.1
Introduction
This chapter introduces transactional data and analysis techniques in the context of enterprise systems and knowledge representation. The core components of enterprise systems including business intelligence (BI) solutions are discussed and evaluated. The capabilities of enterprise systems are highlighted as are the competitive forces creating demand for increased integration, intelligence and efficiency of use.
Understanding the dynamics of an Enterprise is difficult due to the complexity of applications and technology, increasing data volumes and the fact the competition forces constant change. The relationship between data, information and knowledge in the context of enterprise systems is discussed and consideration given to shielding users from complexity as far as possible (Plattner, 2008).
Enterprise systems capture data in a transaction structure so that they can provide information that seeks to align with the knowledge that decision-makers use to achieve business goals. With the emergence of service-oriented architecture and developments in BI, data in its own right is becoming significant, suggesting that data in itself may be capable of capturing human behaviour and offer novel insights
telligence solutions. Knowledge is a valuable but expensive commodity. It is delicate, easily lost or misunderstood and difficult to gain; moreover it is hard to computerise. Humans exhibit innovation and intelligence but unlike computers are incapable of pro-cessing large volumes of complex data. There is a need for an analysis method capable of discovering relationships that enhances human capabilities whilst being congruent with system-based computation.
2.1.1
Overview
This chapter considers the background, intentions and visions within enterprise sys-tems starting with transactional syssys-tems and approaches to analysis. A review of the differences between data, information and knowledge is conducted before discussing the human aspects of understanding and deriving value from discovered knowledge.
Section 2.2 introduces transactional systems, data and analysis in the context of enterprise systems. These are important business tools that represent the real world. The application of transactional based systems will continue for the foreseeable future as they provide integrity, detailed control and a historical repository. The construc-tion and form of enterprise systems is expected to change as data is captured from an increasing array of sources and competitive forces demand higher performance. Tech-nologies and approaches as described in section 2.3.6 will enhance the capabilities and correspondingly the complexity of transactional systems but consequently making un-derstanding them more difficult.
that can analyse data generated by agile systems and recognise the significance of human behaviour.
Section 2.4 introduces types of data and processes for transforming data into in-formation and knowledge. Through computation, representation, interaction and ul-timately human thought data has an inherent value that can be exploited within the context of complex systems and processes. The challenge and context of this research includes the management and effective analysis of large complex data sets for effi-ciently exposing information and generating knowledge. Knowledge, discussed further in section 2.4, being the ability to internalise [learn] and use information.
Section 2.5 introduces discovery techniques and the importance of knowledge for human and organisational performance. Discovery is an important factor as data is ex-panding in complexity and volume. Approaches that connect the user’s human-oriented approach to problem solving with the formal structures used by computer applications are needed to bring their collective productivity to bear. The final challenge involves reasoning and applying discovered knowledge, making use and deriving value from the effort.
2.2
Transactional Systems
Information systems is a generic term associated with systems that manage data by providing processes and information. They are developed and operated within an environmental context that has a significant effect on them (Avison and Fitzgerald, 2003). Transactions are discrete functions typically used to interact with data and perform calculations, updates, trigger events and many other functions.
environment is important, of particular note is the human element (Avison and Fitzger-ald, 2003). Information Systems are a representation of the real world, an abstract or model of a process. When implemented at the correct level they can provide a simplified and focussed viewpoint without introducing inaccuracies due to insufficient data. Con-versely when implemented incorrectly they lack data or precision leading to incorrect information or misunderstanding.
Enterprise systems are a type of information system typically offering organisations industry specific and best practice functions to support common processes while con-currently reducing the need for technical software and hardware skills. They provide organisations with a capability to capture, process, communication and analyse data in the pursuit of their goals.
Enterprise systems are complex and technology trends suggest that this will con-tinue to grow as the volume of data stored and communicated increases. Systems will need to communicate between themselves, with objects and humans based on loose connections while maintaining the necessary levels of context, trust and reliability.
A significant problem is that market forces make constant change inevitable; sys-tems must be adaptable to meet the information needs of the Enterprise. Mobile devices are now capable of communicating audibly and visually almost on par with any fixed location device. They are also capable of functioning, sensing and communi-cating without human input, therefore, the potential range of information available to an Enterprise is creating significant challenges around handling and more importantly benefiting from this new environment. ERP is one of the main constants as it tradi-tionally represents the core processes of an Enterprise and forms a central repository to support functions such as the financial reporting. Any new method of analysis requires a framework that is equally flexible to these needs.
support as they are both configurable and programmable however there are broad cat-egories. The most common being ERP as discussed above. Similar platforms exist for specific sectors including Customer Relationship Management (CRM), Supply Chain Management (SCM), and Product Life-cycle Management (PLM) that span a range of industries from Aerospace to Wholesale. This is not intended to be exhaustive list but indicative of how products are developed for specific industry sectors and impor-tantly how frequently these are not stand alone systems but integrated to provide an architecture that supports the requirements of an organisation.
Data is one of the fundamental reasons why enterprise systems are deployed. En-terprise systems enables users to share data and information, companies to reduce costs and manage business processes (Aladwani, 2001). The type of data is varied, normalised data in relational database tables is an significant proportion with typi-cal systems running into 100,000 standard tables. These tables contain tens of fields with defined attributes including data type, length, formatting and in some cases links. These links can be to internal long text or external data because, using of SAP ECC as an example, field length is limited to 255 characters. Internal links can represent links to models or documents. External links can integrate with, for example, docu-mentation management systems, URLs or services. Given this flexibility and ability to link date is a complex domain.
Enterprise systems is an umbrella terms for many different types of systems and communication technologies. For consistency Enterprise systems has been used through-out as a general term. Enterprise resource planning (ERP) and business intelligence (BI) are considered sub components, these a discussed in the following sections.
2.2.1
Enterprise Resource Planning
for organisations around the world.
ERP systems have revolutionised business around the globe; processes are leaner and more efficient, costs are minimised, positive customer service is more prevalent, and government compliance is present (Dunaway and Bristow, 2011).
ERP systems are essentially transactional systems that support a vast array of business functions within the majority of organisations that exist today. They are designed to be explicit and accurate in terms of control and data but often lack the analysis tools and communication methods to meet all functional requirements. This is where value can be added by integrating tools and service.
ERP systems support integration and control across various functional areas of a company, therefore supporting the achievement of the company’s plans (Portousal and Dunderam, 2006). ERP is an excellent source of raw data in a relatively well defined format and structure, however the volume and granularity of the data make analysis inefficient or inadequate without the application of BI tools.
Organisations invest significant resources into systems during implementation and through ongoing maintenance and use. These systems are used to control operations, integrate with business partners and should be leveraged to attain any competitive advantage possible.
small organisations to benefit.
Modern Enterprises are complex and rely heavily on people and electronic systems to control and manage their operations. ERP systems are central to many enterprises as they provide an integrated and best-practice set of processes coupled with control and governance. A significant problem is that market forces make constant change inevitable; systems must be adaptable to meet the information needs of the Enterprise. Mobile devices are now capable of communicating audibly and visually almost on par with any fixed location device. They are also capable of functioning, sensing and communicating without human input; the potential range of information available to an enterprise is creating significant challenges in handling and more importantly benefiting from this new environment.
The predominant trend within ERP solutions has been for process experts to design and architect solutions in a top down manner, in the worst cases with a silo viewpoint. This tenancy to design processes and reporting solutions manually makes it difficult to conquer the challenges of increasing data volumes, process diversity and the range of interactions.
ERP systems provide a transactional capability that forms a fundamental platform upon which the majority of today’s organisations operate. ERP provides a detailed and structured mechanism for controlling and capturing operational data and a platform for analysis. ERP is not to be considered as an isolated system, in practice they form part of a complicated architecture communicating and interacting with many other systems. One important system aspect of this is Business Intelligence (BI); by definition this provides decision makers with valuable information and knowledge by leverage a variety of sources of data as well as structured and unstructured information (Sabherwal, 2007).
ries for detailed information. BI solutions typically transform this data so that it is suitable for on-line analytic processes (OLAP) by converting data into a format that is more applicable for fast analytic applications, frequently at a level where granularity is reduced. This focussed and efficient analysis tool comes at a cost in terms of trans-forming the data and maintaining its meaning, particularly when data is consolidated across systems or geographical areas.
ERP offers a relatively rigid set of data in a well-structured format, its operation relies on programmed logic that is not necessarily represented in the data. In addition to documents, objects, statuses and relationships ERP systems also capture a variety of log files including user tasks, time stamps and changes. All these in combination will potentially reveal otherwise latent semantics that can be of benefit to the Enterprise and form part of a successful BI application. ERP systems do not typically incorporate semantics and the stored data represents only a proportion of that available within an organisation. Non-integrated but complementary systems and humans form the repos-itories where the majority of data is stored. Correspondingly the majority of control mechanisms and procedures are not contained directly in the data but encapsulated in programs or dictated by human interaction with the system.
2.2. Application that specialise in and serve specific functions such as Supply Chain or Customer Relationship Management are integrated to provide the platform necessary to support business operations.
Abstraction between layers forms a major factor in the development and application of Enterprise systems. An applications developer does not need to understand how to write to a hard drive in the database, a level of abstraction exists that enables the task to be completed without detailed and expert knowledge.
Figure 2.1: Structure of Business Application (Plattner, 2008)
Enterprise systems have developed from two tier platforms in the 1970s to web ser-vices with exposed functionality via standard access protocols, see figure 2.2. Various drivers and enablers have driven these changes including competition, technology, users and the growth of the Internet. Access to information is faster and more readily avail-able than every before, none more so than for consumer who can use these technologies to compare and select with relative ease. This in turn drives competition and in turn generates forces that drive improvements in speed, cost and performance.
Figure 2.2: Evolution of Enterprise Application Platforms (Plattner, 2008)
2.2.2
Transactions and Relational Databases
Regardless of the form that ERP takes the core function and method of interaction is a transaction. A transaction is a fixed sequence of actions with a well-defined beginning and a well defined ending (Plattner and Zeier, 2011). The use of many transactions in a defined sequence is a process with an aim of achieving the goals of the organisation. The basic method of user or system interaction within an enterprise systems is through processing a transaction. Transactions are a method of starting a program that performs a function such as a running a report, data entry, browsing or virtually any other use. In practical terms many transactions are processed by many users or systems thereby supporting the operations across an entire organisation.
The transaction concept guarantees integrity for all concurrent users (Plattner, 2008). The key properties of a transaction are coined as the acorynm ACID, this stands for Atomicity, Consistency, Isolation, and Durability (Haerder and Reuter, 1983). Transactions defined at this level are detailed but useful from an an analy-sis perspective as they have definite states, changes are limited and because of this
a second transaction is required to reverse or cancel. In order for a transaction to access data it performs a dialogue step, this essentially requests information from the Database Management System. Importantly this is stored and accessible for analysis purposes.
The relational database model was conceived by E. F. Codd in 1969 using the terms relations, attributes and tuples, they are more commonly referred to with the terms tables, columns and rows (Litwin, 1994). Data is organised in tables as rows and columns with relationships between tables. This creates a powerful and efficient structure for storing large amounts of data and importantly with Structured Query Language (SQL), a method of managing data. An example of these relationships is shown in figure 2.3. Table and field relationships are linked, depicted by the black line between boxes. This is only a small example, database frequently utilise 10,000s of standard tables and even more secondary tables. These are used for various storage and performance reasons including indexing, sorting and hashing.
In addition to table relationships data can also be joined through document flows (in SAP terminology) or within the program itself. These work in a similar manner linking one document to another, eventually linking all documents created along a business process. A business process is defined as a set of logically related tasks performed to achieve a defined business outcome (Davenport and Short, 1990).
For detailed control and processing transactional data is highly appropriate, how-ever, aggregating large volumes of transactional data can be problematic and slow. This is where BI solutions have advantages.
2.3
Business Intelligence
Figure 2.3: Table Joins in a Database
analyse data for decision making purposes using computer-based techniques (Dunaway and Bristow, 2011). Another view is that the goal of BI is to make sense of change, to understand and even anticipate it (Soukup and Davidson, 2002).
BI provides decision makers with valuable information and knowledge by leveraging a variety of data sources including structured and unstructured information. The information and data can reside within or outside the organisation, be obtained from multiple sources, structured in different ways, and be either quantitative or qualitative (Sabherwal and Becerra-Fernandez, 2011).
BI is a set of processes (data gathering, data analysis), technologies (data ware-house), and presentation tools (report generator, dashboard) used by organisations to analyse data (either internal or external) in order to gain new insight on their environ-ment (customers, suppliers) and make better decisions (Mireault, 2011).
schema or cubes are used to describe aggregates of raw data against key characteristics, these summary levels represent data at a granularity highly suitable for repetitive and fast analysis hiding the details of thousands or millions raw data inputs.
CUBIST, a programme funded by the European Commission aimed at combining the essential features of Semantic Technologies, Business Intelligence and Visual Ana-lytics, argues that the complexity of BI tools is the biggest barrier to successful analysis, particularly because they do not work with the meaning of data (semantics) and are not capable of effectively handling unstructured and structured data (CUBIST, 2010). Transactional systems provide a core function and support considerable business activity within organisations around the world. They are intrinsically complex and significant effort is required to understand and manage them effectively. Based on the current outlook, system landscapes are evolving and becoming more flexible and agile. Therefore, analysis techniques must follow suit.
Sabherwal and Becerra-Fernandez (2011) describe four key capabilities of BI so-lutions as shown in the left hand side of figure 2.4 . The distinct capabilities build from data and information through analysis before creating new knowledge with the user at the top of the diagram. The right hand side indicates where Formal Concept Analysis and other technologies could fit in this chain of capabilities. It is clear that any analysis of data will share the inherent problems with respect to data, integration, interpretation and knowledge creation.
Figure 2.4: Business Intelligence Capabilities after Sabherwal and Becerra-Fernandez (2011)
2.3.1
Business Intelligence and Knowledge Management
There are a number of technologies that share a similar space but have a number of notable differences in terms of the data, information and knowledge they consume and produce. Table 2.1 describes the attributes of technologies designed to support decision making and aid the management of data, information and knowledge.
Starting on the right hand side with DSS and ADS the target users are highly focussed implying the need for specialist skills and knowledge. Consequently these approaches are limited in scope to a small demographic of the total user population. BI on the left hand side is accessible and useful to a much larger demographic using flexible and interactive tools for converting data and information into further data and explicit knowledge. Explicit knowledge is detailed and clearly stated and typically represents actual values, processes and calculations. Section 2.4 expands on the description of knowledge.
What is apparent is that the lines between all of these technologies are blurring as technologies are converging and blending technologies in order to advance. Herschel and Jones have similar views and argue the BI should be a subset of Knowledge Management
(KM) as it can influence the very nature of BI (Herschel and Jones, 2005). This is because KM includes tacit knowledge that is difficult to represent within BI although they clearly state that BI and KM need to be considered together as integrated and mutually critical components.
information information, knowledge multiple systems) information, knowledge Nature of
In-puts Internal or external, structured or unstructure Internal or external, structured or unstruc-tured Internal structured Internal structured Data, information, knowledge Outputs Information and explicit knowledge Tacit knowledge and explicit knowledge
Data (in a single logical repository) Information Decision recommen-dation (DSS) or automated decisions (ADS) Components Information technologies Information technologies, social mechanisms, structural arrange-ments Information technologies Information technologies Information technologies
Users Across the organisation
Across the organisation
IT personnel IT
[image:54.595.103.558.94.536.2]personnel, others trained in IT Specific, targeted users
Table 2.1: Distinctions between BI and Other Related Technologies (Sabherwal and Becerra-Fernandez, 2011)
To be reliable the architecture must be clearly defined and stable for data ware-houses to function in production environments (Sabherwal and Becerra-Fernandez, 2011). In the new agile world an approach that has a similar degree of agility is required.
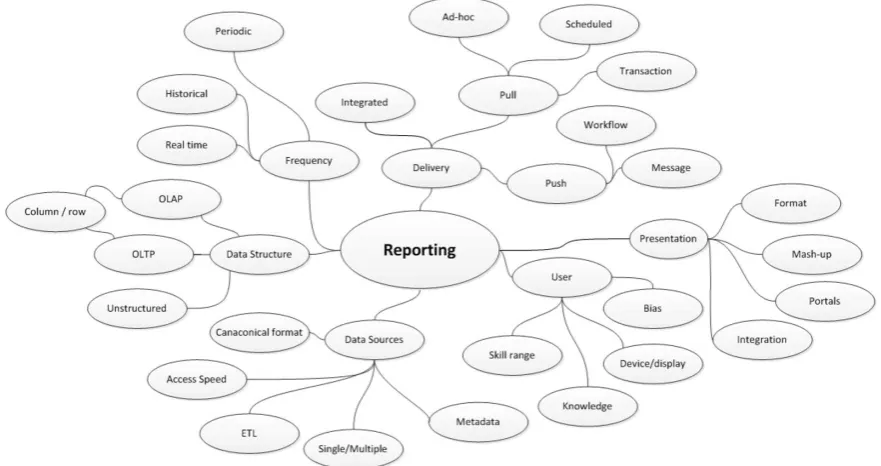
data, applications and technology. Data will inevitably come from external sources therefore augmenting data from sources such as vendors, service providers and envi-ronmental scanning must also be considered under this umbrella. Figure 2.5 contains a number of areas to consider when designing reports. Reports has been used rather than BI or other terms so that there is no predetermination of the technology or appli-cation. Areas range of the target user group, the frequency and delivery method, data structures and data sources. The core message is that a range of factors will determine the requirements and therefore solutions will differ with need.
Figure 2.5: Reporting Consideration
2.3.2
The Need for Business Intelligence
ing dynamics have been present for many years. Porter’s Value Chains illustrates the relationships between primary and supporting activities for achieving competitive advantage (Porter, 1985). BI can support this by targeting the generic sources of competitive advantage including a focus on cost, reconfiguring the value chains and creating differentiation or uniqueness.
Value chains coupled with technical advances emphasis why data volumes, decision complexity and the need for quick reflexes are critical for organisations today. The integration of systems with systems, sensors, mobile devices and the availability of information coupled with powerful analysis can certainly contribute towards achieving competitive advantage.
2.3.3
Challenges for Business Intelligence
BI can be complex, only a proportion of the data is available, intervening variables called tacit knowledge (Herschel and Jones, 2005) such as culture, bias or conflicting goals can render the results inaccurate. It is viewed as being expensive and business events are not consistently defined throughout the organisation which makes it difficult to utilise organisation wide BI (Sabherwal and Becerra-Fernandez, 2011).
Cook and Cook cite BI’s inability to integrate non quantitative data into its data warehouses and relational databases as a major limitation also quoting that up to 80 percent of business information is not quantitative or structured in a way that can be captured in a relational database (Herschel and Jones, 2005) .
2.3.4
Aims of Business Intelligence
several sources of explicit knowledge into new patterns and relationships (Herschel and Jones, 2005).
Perkin’s theory of understanding suggests that a knowledge of the aim, relation-ships and purpose of the analysis is required to convert a new relationship into tacit knowledge (Herschel and Jones, 2005). This tacit knowledge about an organisation in the context of analysis and decision making starts to encroach onto Knowledge Man-agement topics including organisational memory, strategic alignment and architecture.
2.3.5
Data Mining
Data Mining as a term is generally considered a facet of BI along with are artificial intelligence and machine learning although a definitive demarcation is difficult. Visual Data Mining has benefited enormously from the growth in computation power and graphical capabilities. Recent trends include increased availability, dynamic interac-tion, complex data visualisation methods and the role industry standards play in the exchange of data (Soukup and Davidson, 2002).
represent iterative steps in the pursuit of knowledge generation. This high level view is generic and deliberately lacks details that alternative KDP models include, specifi-cally those actually applied and related to practical or industry. These details relate to topics such as business and data understanding in the context of the domain, data preparation and deploying data mining; these practical topics are address as part of the methods discussed in chapters 3 and appendix E.
Figure 2.6: Data Mining (Cios et al., 2007)
Data mining is an umbrella term but the key feature is that it is data driven as opposed to other methods that are often model driven (Cios et al., 2007). Figure 2.7 represents estimates for the relative effort associated with steps in the knowledge discovery process. Data preparation is decidedly the most time consuming activity with all remaining steps representing only a quarter of the relative effort.
Figure 2.7: Relative Effort Spent of Specific Steps of the KD Process (Pal, 2005) cited in (Cios et al., 2007)
Data mining techniques range include classification, clustering, association, and decision trees. These are briefly described as they have been introduced as a comparison
Figure removed for copyright reasons
to FCA. The collection method for this data is discussed in appendix E. FCA can be considered as an association or classification technique and is discussed in more detail in chapter 3.
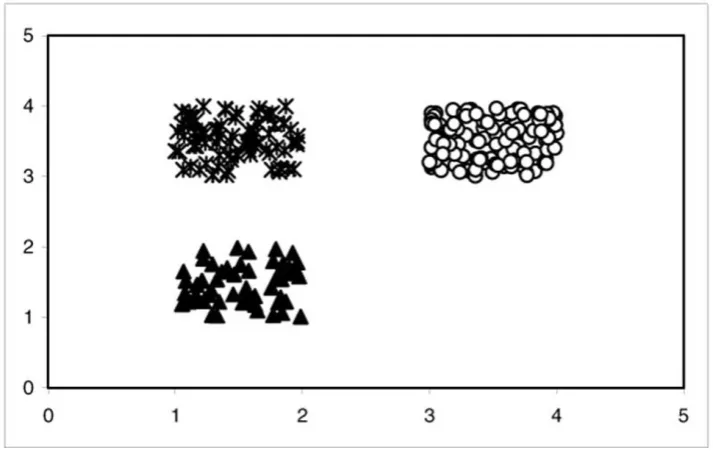
[image:59.595.142.499.275.501.2]Clustering is the process of organising objects into groups whose members are simi-lar in some way (Lingras and Akerkar, 2008). Figure 2.8 shows a simple two dimensional set of data containing three clusters produced by k-means, a heuristic algorithm that converges towards an optimum solution.
Figure 2.8: Simple Clustering Example
Classification is similar to clustering with the distinction being that classification requires the classes defining before the analysis. The goal of classification is to build a concise model (rules) that can be used to predict the class of the records whose class label is not known (Lingras and Akerkar, 2008).
Decision trees are classifiers in the form of a tree structure, see figure 2.9 for a simple example. Each node is either a leaf or a decision node, decisions move between classes towards an end point. In a similar manner to neural networks training sets can be used to create the structure.
Figure 2.9: Decision Tree (Lingras and Akerkar, 2008)
example is a market-basket analysis; finding relationships between several items within baskets (Lingras and Akerkar, 2008). Forming rules is a useful output that represents knowledge derived from the data.
Discovery as a term implies a number of ideas. Primarily in the context of this research it is about the act or process of finding hitherto unknown knowledge from transactional data. This could range from completely automated functions through to application that promotes learning through interaction and interrogation.
Combining these discovery techniques with search, linked data, semantics and meta data on platforms that include integrated views or mobile devices has the potential for creating powerful applications.
2.3.6
Future Directions
This section refers to recent and future directions in enterprise systems. Real organ-isations will actually represent a cross section of states as they develop and apply technologies at different rates.
It is fair to say the humans are dependant on systems and tools, in one form or another this has been true for thousands of years but more recently systems and
communication have grown in prevalence. The Internet has experienced massive growth in the past decade and enterprise systems are starting to share many parallels with web interaction (Plattner and Zeier, 2011).
The challenge is to leverage existing systems and data as well as utilising new technologies in order perform better. This has many dimensions but includes topics such as efficiency, integration, decision making, communication and agility.
Plattner states that many customers do not make substantial changes to structures [Enterprise architectures] because they can’t predict what effect it will have, he even argues that many are not in a position to master their own landscapes in the first place (Plattner, 2008). Approaches to simplify these complex landscapes risk further longer term complications and imposed limitations when trying to consolidate or integration functions.
Some of the most significant domains from the perspective of this research are high-lighted and discussed to the level appropriate for this research. It is beyond the scope of this research to define and document all aspects of these topic. The review ranges from technology, human interaction and decision making, architectural approaches and the representation of data, information and knowledge.
Service-Orientated Architecture (SOA) represents a concept that unites operational business aspects and system architectural aspects thus building a bridge between the business world and IT (Hack and Lindemann, 2008). Business functions are encapsu-lated and linked together using loose coupling of services for mapping business pro-cesses. The significant advantages are flexibility and adaptability where processes can be built by reusing existing encapsulated functions.
understanding these systems remains a significant challenge.
Figure 2.10: Service-Orientated Architecture (Krafzig et al., 2004)
Business Process Platform (BPP) is a model driven development process (Plattner, 2008) and an example of Businesss Process Modelling systems that combines with SOA to form a powerful process design environment. These tools support process design in a flow chart format and the technical capability to create the programs necessary to operate and integrate with other systems.
Business Process Management (BPM) is an approach to modelling processes that can address variations and logic problems. It can accomplish this because it incorpo-rates a mix of metaphors including decisions and events into the model. A metaphor is a way of reducing the dimensions of the descriptions of a process to a more understand-able and visible basis (Debevoise and Geneva, 2008). There is no argument against the need for metaphors, however, determining them and communicating them without loss of or mis-understanding is a difficult tasks as modelling is only an abstraction of a real system.
Approaches such as BPM provide enterprises with more responsiveness through flexible and graphical modelling tools. These tools support process design in a flow chart format and the technical capability to create the programs necessary to operate and integrate with other systems. These approaches have the capability to address the needs of the Enterprise however there is a gap - the ability to understand and analysis highly variable processes. This highlights the need to employ techniques that discover information and semantics in order to gain knowledge, insight and pro-actively apply it.
Robustness is a term applied to transactions as discussion in section 2.2.