* Corresponding author: E-mail: [email protected] DOI: http://dx.doi.org/10.2355/isijinternational.ISIJINT-2016-544 1. Introduction
The development of new hot-rolled high-strength, whilst formable steels, offer the potential for novel lightweight automotive chassis components. This allows an improve-ment of fuel economy while, maintaining high level of passenger safety and manufacturability.1) Hot-rolled Advanced High Strength Steels (AHSS) with high strength and excellent stretch-flange formability are particularly desirable.2) This combination of properties presents a sig-nificant challenge, requiring the optimisation of precipita-tion in hot-rolled AHSS. The steel industry has responded to this challenge by developing single-phase ferritic steels strengthened by interphase precipitation based on various micro-alloying systems.3–6) Interphase precipitation con-sists of periodic rows of carbide precipitates which form simultaneously with the decomposition of austenite and growth of ferrite.7) The periodicity of these carbide pre-cipitate rows and spacing of prepre-cipitates on each respective row strongly influences the mechanical properties through the Ashby-Orowan mechanism.3)
Many models have been proposed in attempt to explain and provide guidance for the exploitation of interphase pre-cipitation.8–16) One branch of models including the studies of Rios,10,11) Lagneborg and Zajac12) proposed ledge based models, using the diffusion of micro-alloying elements such as V to compute the distance when solute concentration enabled nucleation of the precipitates. Okamoto and Ågren built upon these studies incorporating the effect of solute drag in the case of an Nb microalloyed steel.13)
Recent experimental studies have elucidated the
periodic-Interphase Precipitation – An Interfacial Segregation Model
Samuel CLARK,1)* Vit JANIK,1) Yongjun LAN1,2) and Seetharaman SRIDHAR1)
1) Advanced Steel Research Centre, University of Warwick, Coventry, CV4 7AL, United Kingdom. 2) Tata Steel, Coventry Technology Centre, Coventry, CV4 7EZ, United Kingdom.
(Received on September 9, 2016; accepted on November 22, 2016; J-STAGE Advance published date: February 3, 2017)
The size and distribution of interphase precipitates in micro-alloyed steels is a crucial micro-structural feature to control for obtaining the necessary strength in low-cost automotive sheets. In order to optimize both alloy chemistry and thermal processing an enhanced understanding of the interphase precipitation mechanism is required. It is proposed that the evolution of inter-sheet spacing of MC carbides during the
γ→α+MC transformation can be explained considering the interfacial segregation and the corresponding dissipation of Gibbs energy inside the moving interphase boundary. The inter-sheet spacing of interphase precipitates is controlled by a complex interplay between the interfacial energy and interfacial segregation, this is presented in form of an analytical model. It is shown that the general trend of refining inter-sheet spacing with growing ferrite half-thickness can be well predicted by the proposed model.
KEY WORDS: interphase precipitation; super-ledge model; interfacial segregation; HSLA.
ity of interphase precipitates; Murakami et al.14) found that the inter-sheet spacing decreases as the interface velocity reduces during an isothermal transformation at 948 K. Gray and Yeo17) also showed that the inter-sheet spacing decreases with the proceeding of austenite to ferrite transformation during continuous cooling. This decreasing inter-sheet spacing however, is the combined effect of ferrite growth and transformation temperature. Sakuma and Honeycomb18) reported that the inter-sheet spacing was increased when Mn was added to a Nb micro-alloyed steel to slow down the austenite to ferrite transformation. Previous models such as, Lagneborg and Zajac12) have been found to be unable to predict the phenomenon (the decreasing inter-sheet spacing with decreasing ferrite interface velocity) where the inter-sheet spacing is predicted to increase with the root of the distance from the ferrite grain centre.
Additionally, the studies by Law et al.,19) Okamoto et al.20) and, Yen et al.21) and recently the studies of Furuhara and co-workers22–24) have shown that the γ/α interphase boundaries where interphase precipitation was observed most densely occur on α allotriomorphs which exhibit no rational orientation relationship to the parent γ grain into which they are growing. Typically, it is stated that a ledge and therefore presumptively a super-ledge based transfor-mation necessitates a low-energy orientation relationship to be strictly adhered, this would appear to rule out the pos-sibility of a ledge mechanism for interphase precipitation. Okamoto20) however, remarked that although the interface appears to be incoherent the presence of growth ledges should not be dismissed.
the kinetics of the γ→α transformation. However, as Murakamai et al.14) pointed out the pinning force from pre-cipitates as small as 1 nm (in the order of 6 Jmol−1) would be relatively insignificant compared to the driving force for ferrite transformation. The relative insignificance of the pinning force of precipitates during the γ→α+MC transfor-mation by the fortransfor-mation of carbide precipitates is further evidenced by the recent 3D atom probe tomography stud-ies by Mukherjee et al.25,26) Where, in the case of a Ti–Mo micro-alloyed steel, only a few fully developed interphase precipitates were found in the microstructure quenched immediately after the transformation. On the other hand, nano-clusters coherent with ferrite matrix, especially when the interphase boundary mobility is high, were found in significantly higher quantities. Such a finding is pertinent as a nano-cluster will have a negligible interfacial energy with that of the matrix and thus their potential pinning force upon the advancing γ/α interphase boundary is likely to be small.
It is hypothesised that the observed refinements in inter-sheet spacing during the initial stages of the γ→α+MC transformation can be explained by the transition from parequilibrium to negligible partitioning local equilibrium. It is further hypothesized that the nucleation of interphase precipitates plays little role in the determination of ferrite super-ledge height and the interphase precipitates merely mark the super-ledge height in alloys where a strong car-bide forming element is present. The inter-sheet spacing is thought to be a strongly related of the factors of interfacial energy and interfacial segregation. The latter of which can be predicted according to approaches such as that outlined by Purdy and Bréchet.27) It is proposed that interfacial seg-regation has a particularly marked effect on the inter-sheet spacing. Finally, it is hypothesized that the precipitation of carbides will consume sufficient carbon to accelerate the ferrite formation. The purpose of this study is to develop a new model for the prediction of the evolution of inter-sheet-spacing of interphase carbides in multi-component alloys.
2. Materials and Methods
Accurate characterisation of the initial condition, in terms of the prior austenite grain structure is vital for the development of the present model. The prior austenitic grain structure which has important effect on soft impingement of forming ferrite grains, has been characterised in-situ using HT-EBSD. Furthermore, in order to test the validity of the interphase precipitation model experimental data must be collected to test its predictions. In this work the phase transformation model shall be tested against the γ→α trans-formation kinetics measured using dilatometry and the pre-cipitation model against the inter-sheet spacing of interphase carbides, measured a posteriori using TEM.
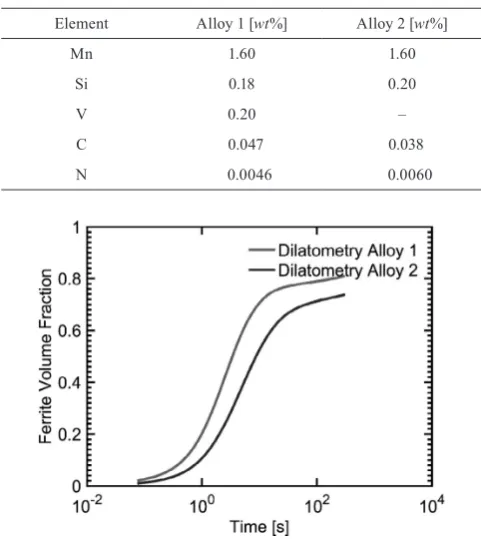
The experimental materials were provided by Tata Steel in the form of forged blocks with the composition according to Table 1. Samples were machined into rods of 4 mm diam-eter, 10 mm length for dilatometry and further analysis by in-situ High-Temperature Electron Backscatter Diffraction (HT-EBSD) and Transmission Electron Microscopy (TEM). Bähr-Thermoanalyse DIL 805A/D/T quenching dilatometer was used to perform all dilatometry experiments operated in vacuum and utilizing a He assisted quench. An itial heat
treatment was followed for all samples an initial heat treat-ment consisted of heating 1 423 K at 5 Ks−1 and isothermal holding for 120 s to dissolve all pre-existing precipitates. The samples were then cooled at a rate in excess of 100 Ks−1 to room temperature.
3. Experiments and Results
a) For dilatometric analysis, the samples quenched from 1 423 K were reheated to 1 173 K at a rate of 5 Ks−1 and isothermally held for 120 s, followed by cooling at a rate in excess of 100 Ks−1 to an isothermal transformation tem-perature of 973 K where the samples were held for 300 s. The dilation of the samples was collected throughout the thermal cycle.
Figure 1 shows the results of dilatometric analysis of the
γ→α transformation at a temperature of 973 K of Alloys 1 and 2. The phase fractions during the isothermal transfor-mation were determined using linear expansion coefficients extracted from segments of the thermal cycle, the dilation from MC precipitates was assumed to be negligible and only a single matrix phase to be present. It can be seen that within the isothermal holding period of 300 s both the final ferritic fraction was greater and the transformation kinetics faster in the case of the alloy where V was present. It is proposed that the most plausible explanation of this effect is the consump-tion of carbon in the form of MC precipitates which would otherwise have been rejected into the residual austenite. This supports the stated hypothesis that carbide precipitation accelerates the ferrite formation. The consequence of the accelerated ferrite formation is in the absence of a strong carbide forming element, the austenite is enriched with C at an earlier stage of ferritic transformation, hastening the stasis of the interphase boundary due to soft impingement.
Table 1. Composition of Experimental Alloys.
Element Alloy 1 [wt%] Alloy 2 [wt%]
Mn 1.60 1.60
Si 0.18 0.20
V 0.20 –
C 0.047 0.038
N 0.0046 0.0060
[image:2.595.309.550.499.769.2]b) The average prior austenitic grain size was measured by in-situ HT-EBSD performed using a Gatan Murano hot stage Model 525 attached to Secondary Electron Microscope (SEM) Carl Zeiss Gemini with ESBD camera Nordlys by Oxford Instruments. The samples were sectioned initial heat treated samples and prepared using standard metallography techniques. The results were correlated with the austenitic grain structure and stability at 1 173 K after continuous heating at a rate of 5 Ks−1 using data acquired from a prior study.28) A posteriori optical microscopy was performed on sectioned samples from the dilatometry samples using standard metallography techniques.
Figure 2(a) shows an image of in-situ HT-EBSD of the austenitic microstructure of Alloy 1 taken at the tem-perature of 1 173 K after 300 s isothermal hold showing a heterogeneous distribution of prior austenite grain sizes with average prior austenite grain size of 12.4±6.5 μm. Figure 2(b) shows optical microscopy of the final microstructure obtained after isothermal hold at 1 173 K for 300 s taken after the dilatometric test with a resultant microstructure consisting of roughly 80% of fine quasi-polygonal ferrite and 20% of untransformed austenite (dark phases)
trans-forming to bainite during quenching after the isothermal hold. The above optical microcopy result shows a strong correspondence with the final ferrite fraction measured using dilatometry in Fig. 1. The distribution of prior austen-ite grain size in alloy 2 using the same HT-EBSD method as alloy 1 was measured to be 15.2±9.6 μm. The prior austen-ite grain size of alloy 2 is slightly coarser and more hetero-geneous than that of alloy 1 leading to increased uncertainty in the interpretation of bulk γ→α transformation kinetics.
c) For a posteriori TEM analysis, five discs per alloy were cut from the samples after the dilatometric tests, thinned to 0.1 mm and then punched and polished down to 50 μm followed by a twin-jet electro-polishing in a Struers TenuPol-5 using a solution of 10 vol% HClO4 mix with 90 vol% CH3COOH (acetic acid) at approximately 258 K. TEM observations were performed using a JEOL 2000FX TEM microscope and JEOL 2100 TEM with Energy Dispersive Spectroscopy (EDS) detector operating at 200 kV.
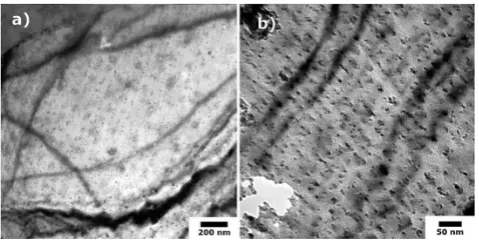
Figure 3 shows TEM Bright field images of Alloy 1 after isothermal holding at 973 K for 300 s; Fig. 3(a) is a lower magnification TEM image showing heterogeneous nature of the distribution of interphase precipitates. Figure 3(b) shows a detailed TEM image demonstrating region where a rela-tively stable distribution of the interphase precipitates with average inter-sheet spacing 19±2 nm is observed.
4. The Proposed Model
For the purposes of this study it will be assumed that all the γ/α interphase boundaries regardless of crystallographic orientation relationships exhibit growth ledges and they agglomerate to form mobile super-ledges of critical height such as those described by Aaronson et al.29) Cahn stated that ‘the mechanism of the motion of an interface in a crys-talline material depends on the driving force rather than on the crystallographic nature of the interface. At sufficiently large driving forces, the interface can move uniformly’. However, at ‘sharp interfaces the necessary driving force is so large that it may be difficult to achieve’.30) More recently the incoherency view has received renewed attention, Massalski et al.31) reviewed the experimental and theoretical nature of interphase boundaries concluding that an incoher-ent boundary may be facetted on various length scales. In particular in context to the perlite transformation in steels Hackney and Shifflet32) observed facets, misfit accommo-dating dislocations and most importantly mobile ledges on the interfaces of both growing phases on interfaces with the parent γ with no rational orientation relationship.
Bhadeshia33) proposed Eq. (1) which states that the criti-cal height for the successful nucleation of a α super-ledge at an γ/α interphase boundary, h* which is assumed to be equal to the inter-sheet spacing λ, is controlled by the interfacial energy of the facet plane of the ledged interphase boundary,
σ, the driving force for the transformation, ∆Gmγ α→
h V
G
m m
*= =
→
λ σγ α
∆ ... (1) here Vm is the molar volume. Bhadeshia argued that ∆Gmγ α→ has approximately constant maximum value for a given temperature as carbon is not enriched in the austenite, γ, the MC carbides consume the vast majority of the carbon Fig. 2. a) in situ HT-EBSD image of the austenitic microstructure
of Alloy 1 taken at the temperature of 1 173 K after 300 s isothermal hold showing heterogeneous distribution of prior austenite grain size; average prior austenite grain 12.4±6.5 μm. b) Optical microscopy of the final micro-structure obtained after isothermal hold at 973 K for 300 s taken after the dilatometric test, 80% of fine quasi-polygonal ferrite and 20% of untransformed austenite (dark phases) transforming to bainite during quenching after the isothermal hold.
[image:3.595.46.286.598.719.2]rejected from the growing ferrite; ∆Gmγ α→ can be therefore calculated assuming parequilibrium conditions (PE). It was assumed that σ in Eq. (1) was a fixed constant and takes the frequently used but not actually known34) value of 0.2 Jm−2 for an interphase boundary obeying a low energy orienta-tion relaorienta-tionship. It is assumed that the lower bound for the inter-sheet spacing of interphase precipitates is equal to the critical step height, since Bhadeshia stated that the inter-sheet spacing could not possibly take a value of significantly larger than the value of h* as a larger super-ledge would degenerate into several smaller super-ledges each of height h*. For the purposes of this study Eq. (1) shall be used to cal-culate the inter-sheet spacing, it will be assumed that λ =h*. Although, this approach33) was found to be able to pre-dict the trend of refining inter-sheet spacing with reducing temperature excellently there was still separation between the expected and predicted curves. It is suggested that all of the experimental and modeled trends can be fitted if the
σ of the facet plane is allowed to vary within an order of magnitude. A model shall be proposed as part of this work with Eq. (1) as basis however, ∆Gmγ α→ and interfacial energy of the interphase boundary σ shall be carefully re-evaluated.
Song and Hoyte,35) using molecular dynamics modelling of the γ/α interphase boundary in pure iron, calculated that the interfacial energy in an interphase boundary with a Kurdjumov-Sachs (K-S) orientation relationship had an interfacial energy of 0.37±0.05 Jm−2 and an incoherent random interphase boundary had an interfacial energy of 1.40±0.2 jm−2. These results were comparable to the work of Nagano and Enomoto.36) The interfacial energy of an interphase boundary is known to vary with bulk alloying content and under equilibrium conditions can be predicted based on the Gibbs-Duham equation.37) Gjostien et al.38) proposed and experimentally fitted a semi-empirical approach. It was shown how the interfacial energy drops significantly with increasing bulk C concentration: whilst an acceptable match was found at low concentrations of C, the modified isotherm failed at high C concentration. At equilibrium in coherent interphase boundaries Dregia and Wynblatt39) modelled segregation and interfacial energy in a multicomponent system, this approach however, is of considerable complexity and again is not applicable beyond the context of systems in equilibrium. The interfacial energy under a dynamic equilibrium incorporating the formation of sharp concentration spikes at the interface is likely to be of considerable additional complexity and as to the best of the authors knowledge has not been explored. The dynamic interfacial energy will be considered as a fitting parameter in this analysis within the following bounds, (0.1 ≤ σ ≤ 2.5) Jm−2.40)
4.1. Prediction of the Dissipation of Gibbs Energy
∆Gmdiff + Gmfrict
(
∆)
in the Interphase BoundaryA recently proposed method for determining the required chemical driving force throughout the austenite to ferrite transformation, ∆Gmγ α→ , is that of the Gibbs Energy Balance (GEB) approach41,42) which built upon the paper by Purdy and Bréchet.27) In this approach the driving force is equal to the energy dissipation in the interphase boundary, which is equal to the combination of a diffusional dissipation of substitutional solutes in the interface and an interphase
boundary friction term related to the intrinsic interphase boundary mobility, (Eq. (2)).
∆Gmγ α→ =∆Gmdiff +∆Gmfrict ... (2) Such an approach allows a gradual transition between transformation modes traditionally thought quite distinct. At a relatively high interfacial velocity there is little inter-facial segregation, consistent with a transformation under pareqilibrium (quasi-PE) like conditions, whereas, there is significant segregation when the interphase boundary is moving much slower, consistent with a transformation under negligible partitioning local equilibrium (N-PLE) like, (quasi-N-PLE) conditions.
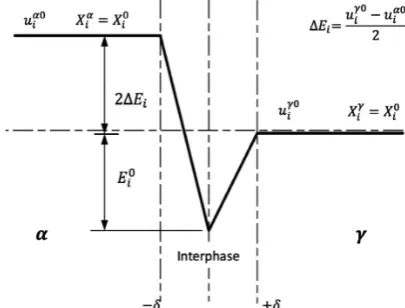
It has been proposed that the segregation in an interphase boundary can be described by a triangular potential well,27) as shown in Fig. 4, where δ is half the interphase boundary thickness and taken in this study to be equal to 0.25 nm, X is the solute concentration, x is the distance from the center of the interphase boundary, Ei0 is the binding energy of the solute element, Di is the interfacial diffusivity of the solute
element i and v is the velocity of the interphase boundary. The magnitude of ∆Ei=ui −ui
γ0 α0
2 , where ui
γ0
and uiα0 are the chemical potentials of a component i in austenite and ferrite respectively, and can be calculated for each respec-tive component using thermodynamic software, in this case Matcalc. The dissipation of Gibbs free energy due to the diffusion of alloying elements inside the interphase bound-ary can be determined using Cahn’s equation, (Eq. (3)),43) where, P is the solute drag force. Hillert and Sundman sug-gested an alternative equation,44) Hillert later reviewed both equations45) concluding both were fundamentally the same although applicable in subtly different conditions.
∆G PV X X dE
dx dx
mdiff = m=
(
i− i)
i
−
∫
δ δ0 ... (3)
The concentration profile, Xi, of segregating elements
within a moving interphase boundary can be described by the governing equation, Eq. (4).
∂ ∂
∂ ∂ +
∂ ∂ +
=
x D X
x D X
RT E
x vX
i i i i i i 0 ... (4)
The interfacial diffusivity remains a source of
[image:4.595.327.530.612.766.2]nificant uncertainty, for this analysis we shall adopt a similar geometric mean methodology as Chen et al.,41,42)
Di= D D D Diα iαα iγγ iy
2 2
6 , where, D
iα, Diαα, Diγγ, Diy are the diffusion coefficients of each component i in a ferrite matrix, at ferrite-ferrite grain boundary, austenite grain boundary, and within an austenite matrix respectively, each readily accessible within the computational package Mat-calc using an appropriate mobility database. Additionally, the molar volume, Vm, can be predicted using Matcalc using
an appropriate property database.
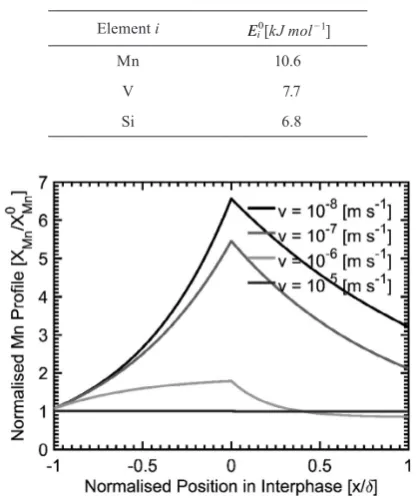
The binding energy Ei0 has been calculated using first principles Density Functional Theory (DFT) calculations for a ferrite Σ5 tilt grain boundaries.46) It will be assumed that similar values will hold true for the segregation energy in the interphase boundary. This would appear to be reasonable given the close correspondence of the values fitted in the work of Chen et al.41,42) The average binding listed in (Fig. 3) the ab-initio study of Jin et al.46) are adopted in this work and are shown in Table 2.
Figure 5 shows exemplary Mn Profiles of Alloy 1 with an interphase boundary moving at different velocities at a temperature of 973 K.
The dissipation of Gibbs free energy due to interphase boundary friction can be determined by Eq. (5), where Mmint is the intrinsic mobility of the interphase boundary. As of yet there is no fundamental evaluation of the intrinsic mobility of the γ/α interphase boundary in iron. Hillert assumed the upper bound of the pre-exponential of a α/α
grain boundary was equal to the intrinsic mobility of the
γ/α interphase boundary, which is calculated according to the following relationship: Mmint = 4 800×exp − ×
147 103
RT
[mol s kg−1 m−1]47) when an average molar volume of
7.3×10⁻⁶ [m3mol−1] is considered. A high mobility yields extremely low dissipation under quasi-parequilibrium condi-tions unless the interphase boundary is moving at exception-ally high velocities. Hillert later reviewed the topic conclud-ing that the mobility of the interphase boundary was much lower especially within the temperature range considered in this study.48) Therefore, the lower bound of the lower apparent mobility of Gamsjäger et al.49) shall be adopted in this work using the following Arrhenius relationship
Mmint = (6 ≤ M0 ≤ 15)×exp
RT
− ×
140 103
[molskg−1m−1].
G v
M
mfrict m
= int ... (5)
Combining Eqs. (2), (4) and (5) and assuming that the total dissipation of n substitutional alloying component can be predicted by summing together their individual contribu-tions, i.e. assuming there is no interactions between each respective element.
∆G ∆G v
M X X
dE dx dx
mdiff mfrict
mint i n
i i i
+ = −
(
−)
= −
∑ ∫
0
0
δ δ
... (6)
4.2. Prediction of the Chemical Driving Force
The chemical driving force can be predicted as proposed by Chen et al.41,42) by the following equation:
∆Gm X u X u X
i n
i i i i i
γ α→ γα γα αγ αγ
=
=
∑
(
−)
0
0 ... (7)
where uiγα and uiαγ are chemical potentials of element i at austenite and ferrite sides of the interface. In a similar manner to that of Chen,41,42) X
iαγand Xiγα for substitutional alloying elements are set to the be equal to the nominal concentration Xi0, consistent with negligible partitioning of substitutional solute elements between the two matrix phases. This is apart from that of the carbide forming sub-stitutional alloying element XMαγ, which is consumed during the formation of interphase precipitates. This is consistent with the 3D atom probe tomography study of Nöhrer et al.50) which mapped the concentration spikes in the γ/α interphase boundary, finding by far the largest substitutional element spike was that of Mn with relativity smaller spikes for that of Si and V. Furthermore, Nöhrer et al.50) found no enrichment of N at the interphase boundary, which may in part explain why it is commonly found that interphase precipitates are predominantly carbides. It is assumed that
XMγα locally takes the value corresponding to the equilibrium solubility of M (KMC) in respect to an austenitic matrix i.e.:
X
A K
A A X
M Fe
y MC
M Cy C
y
γα =
+
100
1
0 ( )
... (8)
Where, y, is the interstitial to substitutional ratio in the precipitate, AFe, AM, Ac are the atomic masses of the
respective elements and XM0, XC0 are the bulk mole frac-tions. In this work, prior Small Angle Neutron Scattering studies on Alloy 1 to be presented at an upcoming con-ference, suggested that the composition of the interphase precipitates was consistent with the precipitates being V4C351) which is consistent with the findings from another Fig. 5. Extemporary Mn profiles of Alloy 1 with an interphase
boundaries moving at different velocities at a temperature of 973 K.
Table 2. Binding Energies Adopted for Segregation Calculations for elements relevant in this study.
Element i Ei0[kJmol−1]
Mn 10.6
V 7.7
[image:5.595.61.270.509.760.2]V micro-alloyed steel.52) The austenite solubility product
log K .
T
V C4 3 7 06
10 800
(
)
= −
could therefore be used from Gladman.3) More generally, and implemented in this work, the solubility of M in austenite for a given alloy composition can be determined using thermodynamic software with the appropriate thermodynamic database.
Two transformation modes are derived as part of this study. The γ→α transformation with no consumption of carbon from carbide precipitates at the interphase boundary where, XCαγ is the equilibrium carbon concentration on the ferrite side of the interphase boundary, XCαγ.
X =XCαγ ... (9) For the γ→α+MC with consumption of carbon from carbide precipitates, the consumed carbon consists of two parts: Carbon in the ferrite XCαγ and the carbon in the form-ing carbides y X
(
M0 −XMγα)
.X=
(
XCαγ +y X(
M0 −XMγα)
)
... (10) The interface velocity under non-soft impinging condi-tions can be calculated by the following equation where,v n D X X L X X
C C C
C
=
(
−)
(
−)
−(
)
1 γ γα 0
γα ... (11)
XCγα is the carbon mole fraction on the austenite side of the interphase boundary. The parameter n determines whether a linear (n = 2) or quadratic diffusion field (n = 3) is considered, DCγ is the diffusivity of carbon in austenite. L is the diffusion length, which can be calculated in turn by Eq. (12).53)
L nS X X X X
C
C C
= −
−
( )
( )
0
0
γα ... (12)
where, S, is the half thickness of the growing ferrite allot-riomorph. Substituting Eq. (12) into (11) and rearranging yields,
X
X X nSv nD D nSv X D X nSX nSvX n
C
C C C C C C
γα
γ γ γ
= −
(
)
− + + − + −−
(
)
0 4 4 2 0 2 0 2
2 1DDCγ
... (13) Similarly under conditions where soft impingement is triggered i.e. L > L0−S where, L0 is half the original aus-tenite grain size a similar set of equations can be derived.53)
v n D X X L S X X
C C Cm
C =
(
−)
(
−)
−
(
)
(
−)
1
0
γ γα
γα ... (14)
X n
nS X X
L S nX X
Cm
C
C C =
−
(
)
−
(
)
− + −
1 1
0
0
0 γα ... (15)
Where, XCm is the mole fraction of carbon at the center of the austenite grain. Substituting Eq. (15) into (14) and rearranging yields,
X nSD X nL D X L vX L SvX S vX L S L v nD Sv
C C C
C
C
γα γ γ
γ
= − + − +
−
(
)
(
− −)
0 0 02 0 2
0 0
2
... (16)
Through combining Eqs. (7), (13) and (16) and the use of an appropriate computational thermodynamics pack-age the chemical driving force, ∆Gmγ α→ , can be calculated. Finally through post processing the computed data, finding the intersect between the ∆Gmγ α→ and ΔGDissTotal = ΔGmdiff+
ΔGmfrict curves, as shown in Fig. 6, the inter-sheet spacing (using Eq. (1)) and the transformation kinetics in terms of interface velocity, ferrite thickness can be calculated. Simple processing allows the volume fraction of ferrite and the transformation time to be calculated.
5. Discussion
The kinetics of the γ→α+MC transformation in Alloy 1 are calculated using the carbon consumption model. Figure 7 shows the correlation between the modeled volume frac-tion and dilatometric analysis of Alloy 1 during isothermal holding at 973 K for different values of initial half austenite grain size, L0. The initial mismatch between the predicted and experimental transformation rates could be attributed to a combination of numerous factors, namely: a) an overes-timation of the intrinsic interphase boundary mobility; b) a spherical growth mode rather than the planar mode assumed
Fig. 6. Extemporary dissipation and driving force curves for Alloy 1 at a temperature of 973 K.
[image:6.595.326.531.404.559.2] [image:6.595.84.284.644.727.2]in this analysis; c) the effect of a transient nucleation rate of quasi-polygonal ferrite and d) the effect of the heterogene-ity of the prior austenite grain-size. The mismatch between the modelled and experimental final ferrite phase fraction is similarly attributable to many of the aforementioned reasons. Although, the uncertainty in the boundary diffu-sivities of substitutional alloying elements will significantly dominate over intrinsic interphase boundary mobility in a slow moving interphase boundary. Additionally, inherent inaccuracies and subjective interpretation in the assessments used for the creation of the multicomponent thermodynamic database used may be influential. Furthermore, as explained by the atom probe study of Mukherjee et al.25,26) the forma-tion of interphase precipitates becomes more significant as the interphase boundary slows. Therefore, a pinning force exerted by the precipitates upon the interphase boundary may become increasingly significant in the latter stages of the transformation. Finally, as nano-clusters are by far richer in metallic elements rather than interstitial elements the carbon consumption at the interphase boundary is likely to have been significantly overestimated. As such, more carbon would in reality have been rejected into the residual austen-ite hastening the soft impingement of the interphase bound-ary. As the onset of soft impingement cannot be accurately predicted an accurate correlation of inter-sheet spacing and
γ→α transformation kinetics under soft impingement condi-tions remains elusive.
As shown in Fig. 8(a) reasonable qualitative correlation between the experimental results in Fig. 3 and the modelled prediction can be achieved after the transformation mode transitions from quasi-PE to quasi-N-PLE with a fitted γ/α
interfacial energy of σ = 0.55 Jm−2.
[image:7.595.325.533.63.227.2]Further analysis of the performance of the proposed model has been performed using literature data. In par-ticular, the model has been tested using the experimental finding that inter-sheet spacing initially refines. This finding is contradictory to the results of many models previously proposed.12)
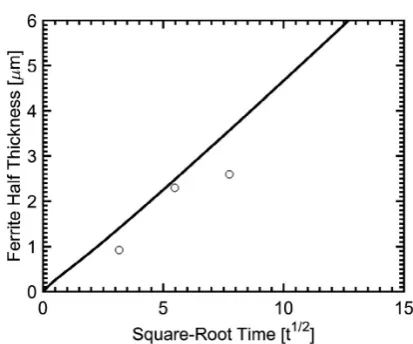
Figure 9 shows the correlation between the proposed model and the experimental results of Murakami et al.,14) it is shown how the model is capable of predicting the experimentally observed refinement of inter-sheet spacing. The interfacial energy was found to best match the experi-mental results when σ = 0.17 Jm−2, however, the model under-predicts the majority of the measurements close to the ferrite center. An interfacial energy of σ ≈ 0.20 Jm−2 produces a good fit of the results near the ferrite center and over-predicts measurements further into the ferritic grain, where an interfacial energy of σ ≈ 0.14 Jm−2 yields a good fit. This mismatch is to be expected as the interfacial energy is known to be reduced with increasing segregation to the interphase boundary. It is clear that the ability to predict the interfacial energy during a dynamic phase transforma-tion would further improve the predictive capability of the model. Figure 10 shows the correlation between the pre-dicted ferrite growth rate and the experimentally measured ferrite half thickness, a slightly improved match from the original Fig. 8 in Murakami et al.14)
The significantly larger interfacial energy required in Alloy 1 (0.55 Jm−2) compared to that (0.17 Jm−2) when fit-ting the literature experimental results of Murakami et al.14)
as reducing the bulk C alloying in an alloy is well known to increase the interfacial energy of the incoherent interphase boundary.38)
Manganese is an austenite stabilizing element intrinsi-cally reducing the driving force, ΔGγ→α, for ferrite growth at
a given transformation temperature. As the driving force is Fig. 8. Modelled evolution of inter-sheet spacing for Alloy 1
dur-ing isothermal holddur-ing at 973 K for an half austenite grain-size of L0 = 7.5 μm with fitted σ = 0.55 Jm−2 using the Inter-sheet spacing in the stable region (19±2 nm) in Fig. 3(b) as an error band.
Fig. 9. Correlation between this model and measured inter-sheet spacing for an Fe-0.75Mn-0.43C-0.25Si alloy transformed at 948 K14) with fitted σ= 0.17 Jm−2.
[image:7.595.323.534.66.469.2] [image:7.595.325.532.499.671.2]reduced through Eq. (1) the inter-sheet spacing of interphase carbide precipitates would be expected to increase if the interfacial energy, σ, is assumed to vary little. It is suggested that this mechanism could explain the results reported by Sakuma and Honeycombe.18) The effect of precipitate pin-ning could also be important which would be effected by the increased solubility of niobium carbide with increasing manganese alloying.18)
In order to develop this study further an improved under-standing of the following is prerequisite:
• An accurate means of determination and prediction of the interfacial energy of the γ/α interphase boundary is required.
• Further theoretical work is required towards under-standing the formation of nan-clusters and their com-position.
• Additional experimental studies are required where both the crystallography and transformation kinet-ics are extracted simultaneously coupled with site specific a posteriori and site specific TEM analysis, using Focused Ion Beam lift-out and 3D Atom Probe Tomography in order to directly relate interphase boundary and interphase precipitation parameters. This work is currently being undertaken and shall be published in a subsequent paper.
6. Conclusions
A model is presented using the solute drag model of Purdy and Bréchet, the GEB concept, and the theory of the diffusional formation of super-ledges by Bhadeshia. Unlike the majority of previous models, the actual nucleation of interphase precipitates is considered to play little role in the determination of super-ledge height. Rather the inter-sheet spacing is controlled by a complex interplay between the factors of interfacial energy and interfacial segregation. It is shown that the general trend of refining inter-sheet spacing with the distance to ferrite grain center can be well predicted by the proposed model.
To take the observed accelerated kinetics of γ→α trans-formation in the vanadium micro-alloyed steel into consid-eration, the consumption of carbon at γ/α interface due to the formation of interphase carbides has been incorporated into the γ→α transformation model. The developed model has been used to elucidate the mechanism for interphase precipitation of vanadium carbides in a vanadium micro-alloyed low carbon steel subjected to an isothermal phase transformation at 973 K. Furthermore, the model has also been tested on simulating the interphase precipitation in a medium carbon steel transformed at 948 K using the experi-mental data found in.14) The conclusions are as follows:
(1) The sheet spacing of interphase precipitation in the vanadium micro-alloyed low carbon steel isothermally transformed at 973 K is simulated to be about 20 nm in the distance 2 to 6.6 μm to the center of ferrite grains. This is similar to the value (19±2 nm) measured using TEM.
(2) The inter-sheet spacing of interphase precipitation formed at 948 K in the medium carbon steel is simulated to decrease with the distance to ferrite grain center (from 25 nm to 10 nm from ferrite grain center to a distance 1 μm). This is consistent with the measured values in14) (from 18
nm to 8 nm from ferrite center to a distance 1 μm).
(3) At a transformed distance above 1 μm from ferrite grain center, the inter-sheet spacing is simulated to be stable, i.e., a constant of 10 nm. This is because a constant chemical driving force is maintained at γ/α interface in this distance due to the segregation of substitutional alloying elements Mn, Si and V (Fig. 6). The above simulated stable inter-sheet pacing is observed in.14)
(4) The ferrite fraction transformed at 973 K in the vanadium micro-alloyed low carbon steel is simulated to increase from 0 to about 90% within 25 s, which is in gen-eral agreement with the measured values (80%). Although the calculated final ferrite fraction is slightly higher than the measured one. The above results indicate that the velocity of
γ/α interface used in the model of interphase precipitation is correct at least in terms of magnitude.
Acknowledgement
Authors are thankful to Dr Arjan Rijkenberg from Tata Steel for providing the experimental material. Financial support from the EPSRC grant EP/L018632/1 “Micro-structuring micro-alloyed steels via non-metallic precipi-tate formation” and financial assistance from the WMG Centre High Value Manufacturing Catapult are gratefully acknowledged. Authors would like to acknowledge Dr Yiqiang Wang and Professor Peter Lee from University of Manchester for providing the salt bath treated samples and for fruitful discussions through this project. Finally, SC and VJ would like to thank Dr Hao Chen from Tsinghua Uni-versity, China, for invaluable discussion in the early stages of the development of the model.
Nomenclature
ΔEi: Half chemical potential difference of element i over the γ/α interphase boundary
AC: Atomic mass of carbon AFe: Atomic mass of iron
AM: Atomic mass of the carbide forming element M in an MC carbide
DCγ: Diffusion coefficient of carbon in γ
Dαi: Diffusion coefficient of element i in α
Dααi : Diffusion coefficient of element i in an α/α grain
boundary
Diγ: Diffusion coefficient of element i in γ
Diγγ: Diffusion coefficient of element i in an γ/γ grain
boundary
Di: Effective γ/α interphase boundary diffusion coef-ficient for element i
Ei0: Binding energy of the solute element i to the γ/α
interphase boundary
h*: Critical height of a successfully nucleated α
super-ledge
KMC: Solubility product for an MC carbide in γ L0: Half prior γ grain size
M0: Pre-exponential γ/α interphase boundary mobility factor
Mmint: Intrinsic γ/α interphase boundary mobility
uαi0: Chemical potential of element i with a mole
frac-tion of Xαi in α
uαγi : Chemical potential of element i on the α side of
uγi0: Chemical potential of element i with a mole
frac-tion of Xγi in γ
uiγα: Chemical potential of element i on the γ side of
the γ/α interphase boundary Vm: Molar volume of iron
XC0: Bulk carbon mole fraction
XCm: Mole fraction of carbon in the center of the γ
grain
XαγC: Mole fraction of carbon on the α side of the γ/α
interphase boundary
XCγα: Mole fraction of carbon on the γ side of the γ/α
interphase boundary
Xi0: Bulk mole fraction of alloying element i
Xαi: Mole fraction of element i in forming α
Xαγi : Mole fraction of element i on the α side of the γ/α interphase boundary
Xiγ: Mole fraction of element i in forming γ
Xγαi : Mole fraction of element i on the γ side of the γ/α
interphase boundary
Xi(x): Mole fraction of element i in the interphase with respect to distance from the center of the inter-phase boundary x
XM0: Bulk mole fraction of the carbide forming
ele-ment M in an MC carbide
XMγα: Mole fraction of the carbide forming element M
in an MC carbide on the γ side of the γ/α inter-phase boundary
ΔGDissTotal: Total dissipation of Gibbs energy in the γ/α inter-phase boundary
ΔGmdiff: Dissipation of Gibbs Energy due to the diffusion of substitutional alloying elements in the inter-phase boundary
ΔGmfrict: Dissipation of Gibbs Energy in the interphase due to intrinsic interphase mobility
∆Gmγ α→ : Molar driving force for the γ→α transformation
i: Alloying element i.e. Mn, Si, V, ect….
L: Diffusion length of carbon ahead of the γ/α inter-phase boundary
n: Total number of alloying elements in the alloy P: Solute drag force
R: Universal gas constant S: Half α grain thickness
t: Time
T: Absolute temperature v: Interface velocity
x: Distance from γ/α interphase boundary center X: Carbon consumption parameter
y: C/M ratio in an MC carbide precipitate
δ: Half interphase boundary thickness
λ: Inter-sheet spacing of interphase precipitates
σ: Interfacial energy of the γ/α interphase boundary
REFERENCES
1) C. M. Sonsino: Materwiss. Werksttech., 38 (2007), 9.
2) R. A. Rijkenberg, A. Blowey, P. Bellina and C. Wooffindin: 4th Int. Conf. Steels Cars Truck, Verl. Stalheisen, Dusseldorf, (2014), 426. 3) T. Gladman: The Physical Metallurgy of Microalloyed Steels,
Insti-tute of Materials, London, (2002).
4) Y. Funakawa, T. Shiozaki, K. Tomita, T. Yamamoto and E. Maeda:
ISIJ Int., 44 (2004), 1945.
5) T. N. Baker: Mater. Sci. Technol., 25 (2009), 1083.
6) R. Lagneborg, B. Hutchinson, T. Siwecki and S. Zajac: The Role of Vanadium in Microalloyed Steels, 2nd ed., Swerea KIMAB, Stockholm, (2014).
7) R. W. K. Honeycombe: Metall. Trans. A, 7 (1976), 915. 8) P. Li and J. A. Todd: Metall. Trans. A, 19 (1988), 2139. 9) W. J. Liu: Metall. Trans. A, 24 (1993), 2195.
10) P. R. Rios: J. Mater. Sci. Lett., 10 (1991), 981. 11) P. R. Rios: J. Mater. Sci., 30 (1995), 1872.
12) R. Lagneborg and S. Zajac: Metall. Mater. Trans. A, 31 (2001), 1. 13) R. Okamoto and J. Agren: Acta Mater., 58 (2010), 4791.
14) T. Murakami, H. Hatano, G. Miyamoto and T. Furuhara: ISIJ Int., 52 (2012), 616.
15) M-Y. Chen, M. Gourne, M. Militzer, Y. Brechet and J.-R. Yang:
Metall. Mater. Trans. A, 45 (2014), 5351.
16) M-Y. Chen, M. Gourne, M. Verdier, Y. Brechet and J.-R. Yang: Acta Mater., 64 (2014), 78.
17) J. M. Gray and R. B. G. Yeo: Trans. ASM. Q., 61 (1968), 255. 18) T. Sakuma and R. W. K. Honeycombe: Mater. Sci. Technol., 1
(1985), 351.
19) N. C. Law, S. A. Parsons, P. R. Howell and D. V. Edmonds: Mater. Sci. Technol., 3 (1987), 642.
20) R. Okamoto, A. Borgenstam and J. Ågren: Acta Mater., 58 (2010), 4783.
21) H-W. Yen, P-Y. Chen, C-Y. Huang and J.-R. Yang: Acta Mater., 59 (2011), 6264.
22) G. Miyamoto, R. Hori, B. Poorganji and T. Furuhara: Metall. Mater. Trans. A, 44 (2013), 3436.
23) Y-J. Zhang, G. Miyamoto, K. Shinbo and T. Furuhara: Scr. Mater., 69 (2013), 17.
24) Y. Zhang, G. Miyamoto, K. Shinbo, T. Furuhara, T. Ohmura, T. Suzuki and K. Tsuzaki: Acta Mater., 84 (2015), 375.
25) S. Mukherjee, I. B. Timokhina, C. Zhu, S. P. Ringer and P. D. Hodgson: Acta Mater., 61 (2013), 2521.
26) S. Mukherjee, I. B. Timokhina, C. Zhu, S. P. Ringer and P. D. Hodgson: J. Alloys Compd., 690 (2017), 621.
27) G. R. Purdy and Y. J. M. Brechet: Acta Metall. Mater., 43 (1995), 3763.
28) S. J. Clark, V. Janik, R. A. Rijkenberg and S. Sridhar: Mater. Char-act., 115 (2016), 83.
29) H. I. Aaronson, T. Furuhara, M. G. Hall, J. P. Hirth, J. F. Nie, G. R. Purdy and W. T. Reynolds: Acta Mater., 54 (2006), 1227.
30) J. W. Cahn: Acta Metall., 8 (1960), 554.
31) T. B. Massalski, D. E. Laughlin and W. A. Soffa: Metall. Mater. Trans. A, 37 (2006), 825.
32) S. A. Hackney and G. J. Shiflet: Acta Metall., 35 (1987), 1007. 33) H. K. D. H. Bhadeshia: Phys. Status Solidi a-Appl. Res., 69 (1982),
745.
34) J. Lee, H. Aaronson and M. Enomoto: Mechanism of Diffusional Phase Transformations in Metals and Alloys, CRC Press, Boca Raton, (2010).
35) H. Song and J. J. Hoyt: Comput. Mater. Sci., 117 (2016), 151. 36) T. Nagano and M. Enomoto: Metall. Mater. Trans. A, 37 (2006), 929. 37) J. W. Cahn: Interfacial Segregation, ed by W. C. Johnson and J. M.
Blakely, American Society for Metals, Metals Park, OH, (1979), 3. 38) N. A. Gjostein, H. A. Domian, H. I. Aaronson and E. Eichen: Acta
Metall., 14 (1966), 1637.
39) S. A. Dregia and P. Wynblatt: Acta Metall. Mater., 39 (1991), 771. 40) J. M. Howe: Interfaces in Materials: Atomic Structure,
Thermodynamics and Kinetics of Solid-Vapor, Solid-Liquid and Solid-Solid Interfaces, John Wiley & Sons, New York, (1997). 41) H. Chen, K. Zhu, L. Zhao and S. van der Zwaag: Acta Mater., 61
(2013), 5458.
42) H. Chen and S. van der Zwaag: Acta Mater., 72 (2014), 1. 43) J. W. Cahn: Acta Metall., 10 (1962), 789.
44) M. Hillert and B. Sundman: Acta Metall., 24 (1976), 731. 45) M. Hillert: Acta Mater., 47 (1999), 4481.
46) H. Jin, I. Elfimov and M. Militzer: J. Appl. Phys., 115 (2014), 115. 47) M. Hillert: Metall. Trans. A, 6 (1975), 5.
48) M. Hillert and L. Hoglund: Scr. Mater., 54 (2006), 1259.
49) E. Gamsjager, M. Militzer, F. Fazeli, J. Svoboda and F. D. Fischer:
Comput. Mater. Sci., 37 (2006), 94.
50) M. Nöhrer, S. Zamberger, S. Primig and H. Leitner: Micron, 54–55 (2013), 57.
51) Y. Q. Wang, S. J. Clark, V. Janik, H. R. Heenan, Y. Kun, S. Sridhar and P. D. Lee: Quantitative Analysis of the Precipitate Coarsening in HSLA Steels, 146th TMS, Annual Meeting, TMS, Pittsburgh, PA, (2017), Presentation.