1
Lithium Conductivity and Ions Dynamics in LiBH
4/SiO
2Solid-Electrolytes Studied by Solid-State NMR and
Quasi Elastic Neutron Scattering and Applied in
Lithium-Sulfur Batteries.
Jessica Lefevr
1, Luca Cervini
2, John M. Griffin
2, Didier Blanchard
1*1 Department of Energy Conversion and Storage, Technical University of Denmark,
Frederiksborgvej 399, DK-4000 Roskilde, Denmark.
2Department of Chemistry, Lancaster University, Lancaster LA1 4YB, United Kingdom
2 Abstract
Composite solid-state electrolytes based on ball-milled LiBH4/SiO2 aerogel exhibit high lithium conductivities and we have found an optimal weight ratio, 30/70 wt% LiBH4/SiO2, with a conductivity of 0.1 mS/cm-1 at room temperature. We have studied the Li+ and BH
3 1. INTRODUCTION
During the last two decades, lithium-ion batteries have become a common type of rechargeable batteries due to their higher energy densities than lead-acid, nickel–metal hydride and nickel-cadmium batteries.1 Growing energy demands require further increase in electricity storage capacities however this is difficult to achieve with the current Li-ion technologies as, despite large research efforts, only marginal improvements in the capacities of the electrodes materials are expected. Instead, new battery chemistries have to be developed and lithium-air and lithium-sulfur (Li-S) are some of the most promising, offering very high theoretical energy densities.2,3
Lithium-sulfur batteries are forecasted as next generation batteries for mobile and automotive applications due to their high gravimetric energy density (1675 mAhg-1 sulfur at 2.15 V),4–10 up to 5 times higher than the theoretical capacities of the state-of-the-art lithium-ion batteries, such as lithium iron phosphate ( “LFP”, 170 mAhg-1 at 3.4 V),10 lithium ion manganese oxide (“LMO”, 148 mAhg-1 at 4.1V)11 and lithium nickel manganese cobalt oxide ( “NMC”, 170 mAhg-1 at 4.4 V).10 Advantageously, and apart from this high theoretical capacity, Li-S batteries use sulfur in the positive electrode. Sulfur is one of the most abundant, and therefore cheap, elements in the earth’s crust,1 and furthermore it is benign and environmentally friendly. The overall electrochemical reaction in a Li-S battery can be written as:
S8 + 16Li ⇄ 8Li2S; E0= 2.15V vs Li/Li+ Eq. 1
4
the polysulfides.17 Each of these methods, while showing good improvements, is still at early stages of research and might induce large cost increases in the cell manufacturing. Therefore another strategy would be to replace the liquid electrolytes by fast ion-conducting solids.18–23
A number of different materials have been investigated as potential electrolytes for solid-state lithium batteries, including oxide and oxinitride glasses, such as LiPON,24 LiGePS and LISICON.25 LISICON and LiGePS compounds are good Li+ conductors (10-2-10-3 Scm-1 at room temperature)26,27 but are unstable against Li metal and their stoichiometry is difficult to control during the synthesis.27 Complex metal hydrides are also considered as possible electrolytes in solid-state batteries.28,29 Lithium borohydride (LiBH4) is a complex metal hydride, which has been widely studied as a solid-state hydrogen storage material 30–32 and more recently as an electrolyte for solid-state batteries.33–37 LiBH4 has two known polymorphs: a room temperature orthorhombic (Pnma) phase with a low ionic conductivity and above 393 K a hexagonal phase (P63mc), with a high ionic conductivity (~1 mS.cm-1).38
Stabilization of the hexagonal phase, at room temperature, is possible via the formation of solid solutions with lithium halides, such as LiI, LiBr and LiCl.39–42 The solid solutions with LiI have high Li+ conductivity (1 mScm-1 at 333 K) 34,39 and performances of the lithium borohydride / lithium halide solid solutions as solid electrolytes have been studied in Li-ion batteries.41
5
and fumed silica and more recently studied LiBH4/Al2O3 composites 46 and reported conductivities comparable to the one we measured for nanoconfined LiBH4 in MCM-41. They also proposed, however without any direct method of investigations but using a percolation model that the high Li+ conductivity originates from the LiBH4/SiO2 interfacial layers formed during ball milling. One advantage of the synthesis method of Choi et al. is its simplicity. Indeed, nanoconfinement via melt infiltration requires high hydrogen pressure (up to 100 bar H2 during heating) 43 and high temperature (568 K), while ball milling can be performed, under inert atmosphere, at ambient pressure and temperature.
6 2. EXPERIMENTAL METHODS
Preparation of Electrodes
For all electrochemical measurements, the negative electrodes were prepared using lithium foil (Sigma Aldrich, 99.9%, thickness 40 µm). The positive electrodes were prepared from sulfur and carbon composites as described by Das, et al44 combining ball milling and melt-diffusion of S. Ketjen Black EC-600JD (total surface area 1400 m2/g with pore volume of 4.80-5.10 m3/g, Shanghai Tengmin Industry Co. Ltd.) and activated carbon Maxsorb MCS-30 (surface area 3000 m2/g, Maxsorb, Japan) were mixed in weight ratio 1:1. Elemental sulfur (Sigma Aldrich, 99.9%) was mixed with the carbon blend (S:C weight ratio 45:55) by ball milling for 30 min (400 rpm, BRP 125:1) using a Fritsch Pulverisette P7 planetary ball mill. Tungsten carbide balls and stainless steel vials were used. After ball milling, the mixture was heated for 6 hours at 428 K with slow heating and cooling rates (0.2 K/min.) in a sealed vessel with Ar atmosphere. When the C/S composite cooled to room temperature, it was mixed with 15% polyvinylidene fluoride (PVDF) and the resulting mixture was dispersed in N-methylpyrrolidinone (NMP) and left for stirring overnight. The resulting slurry was tap casted on 0.2 mm thick aluminum foil and dried at 55˚ C for 24 hours. After that the foil with casted C/S composites was punched out as disks of 10 mm in diameter (resulting thickness of C/S layer 15 µm evaluated from FIB-SEM micrographs). The thickness of the electrode is small and there is no need to incorporate lithium ion conducting phase. Good interface and contact is established between the electrode and the electrolyte when pressing the cell during its assembly; this was proven by the charge/discharge cycling of the tested cells both herein and in reference 44 in which the same methodology was used.
Preparation of Solid Electrolyte
7
(Büchi, Switzerland). Mixtures of the two components were ball milled using a Fritsch Pulverisette P7 rotating at 500 rpm for 5 hours. 1.0 g of LiBH4 /SiO2 composites together with 5 tungsten carbide balls were loaded in stainless steel vials under Ar atmosphere.
Batteries Assembly
The batteries were manufactured using specially developed cells described by Das, et al44. The cell assemblies were performed in a glovebox under Ar atmosphere and from the top of the piston in layers, starting with lithium discs cut with a diameter of 10 mm at the negative electrode side, followed by 65 mg of solid electrolyte and a disc with C/S composite on the positive electrode side. After assembling the cell was pressed with 1.5 ton.cm-2.
Electrochemical Measurements
Once the batteries were assembled, they were placed into a climate chamber at 55oC, connected to a potentiostat (VMP3 - Bio-Logic SAS, France) and the Open Circuit Voltage (OCV) was measured for 1 hour. Thereafter, electrochemical impedance spectroscopy measurements (EIS) were performed before and after each charge/discharge cycle. EIS measurements were performed in the frequency range from 1 Hz to 1 MHz. The batteries were charged/discharged in the galvanostatic regime with current of 5 μA corresponding to a C-rate of 0.03 Cbased on the theoretical capacity of 1675 mAh.g-1 sulfur. The cutoff voltages were 1.0 V for discharge and 3.5 V for charge.
8
from 100 mHz to 1 MHz. The pellets were cycled in temperature from 303 K to 413 K. Before each measurement point, a 60 minutes dwell time was used for the pellet temperature to equilibrate.
Nuclear Magnetic Resonance Measurements
The magic angle spinning nuclear magnetic resonance (MAS-NMR) spectra were recorded using a Bruker Avance III spectrometer with a 16.4 T magnet and using a 2.5 mm probe with a MAS frequency of 15 kHz. MAS-NMR spectra were recorded using a 7Li and 11B pulse powers of 130 kHz and 100 kHz, respectively. Low power 1H continuous wave decoupling was used, where the decoupling power was optimized for best spectral resolution. 1H MAS-NMR spectra were recorded using the “Depth” pulse sequence47 to minimize background signals associated with the probe and rotor components. In these experiments a 1H pulse power of 110 kHz was used. The temperature in variable temperature experiments was calibrated using lead nitrate.48
Quasielastic Neutron Scattering
9 3. Results and Discussions
LiBH4/SiO2 composites Li+ conductivity
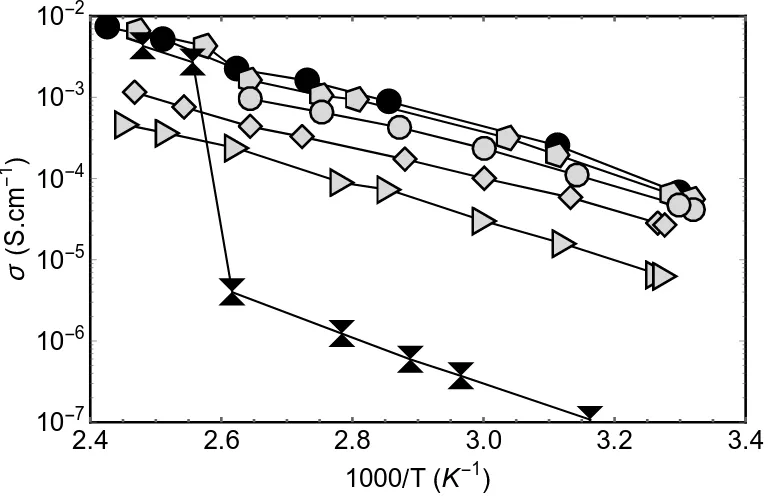
[image:9.595.101.486.466.714.2]Electrochemical Impedance Spectroscopy (EIS) measurements performed on the composite electrolytes yield Nyquist plots consisting of single, slightly depressed semi-circles (See Figure S1 for a representative example). Although it suggests that only one process contributes to the ionic conduction, we cannot exclude that concurrent processes like bulk, grain boundary or conduction at the interface between LiBH4 and SiO2 exist but overlap in the Nyquist plots, as in this case it is not possible to separate these different contributions using only impedance spectroscopy.50,51 The Nyquist plots are fitted using (R-CPE) equivalent circuit models, i.e. a resistor and a constant phase element in parallel. The intersection of the semicircle with the Z’ axis in the low-frequency limit gives the pellet resistance, R, from which the electrolyte conductivity is calculated. Figure 1 summarizes, with Arrhenius plots, the evolution with the temperature of the conductivities of composites with different stoichiometries.
Figure 1. Arrhenius plots of the Li+ conductivities obtained from EIS measurements on composites of different stoichiometry. Triangle ( ) 15/85wt% LiBH4/SiO2, diamond ( ) 25/75wt%, black
2.4 2.6 2.8 3.0 3.2 3.4
10 7
10 6
10 5
10 4
10 3
10 2
1000 T K 1
S
.cm
10
circles( ) 30/70 wt%, pentagons ( )40/60 wt%, gray circles( ) 50/50 wt%, black doubled triangles ( ) 90/10 wt%.
All stoichiometry exhibit enhanced conductivity when compared to the conductivity of LiBH4, and the highest values, at any temperature below the phase transition of LiBH4, are obtained for the 30/70wt% LiBH4/SiO2 composite (Figure 2). In a first approximation, the plots are considered as straight lines to extract apparent activation energies for the lithium conductivities however, for the larger LiBH4 contents, jumps in the conductivity at the phase transition (383 K) exist and in that case only the points before the jumps are considered. The jumps in the conduction, at the temperature of the phase transition of LiBH4, clearly illustrate that for lithium borohydrides rich composites, most of the LiBH4 is not modified by the presence of SiO2. For the middle range compositions the plot shows slight curvatures, ignored during the fitting, this is discussed in the text below, in the light of the NMR and QENS results. Choi et al. 45 have obtained similar results as the ones depicted in Figure 1 and Figure 2.
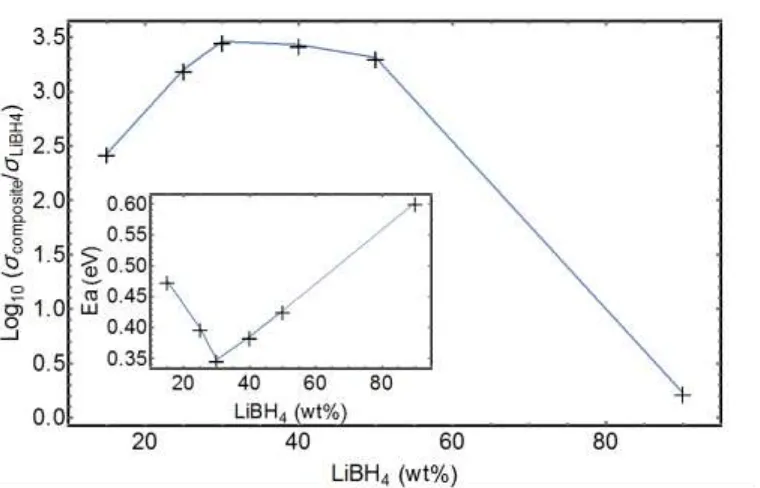
[image:10.595.109.489.450.694.2]11
of different stoichiometries. Insert: activation energies for Li+ conduction extracted from the slopes of the Arrhenius plots of Figure 1.
They reported the highest conductivity (10-4 Scm-1 at room temperature) for a composite with 55 vol.% of SiO2 corresponding to our 30/70 wt% LiBH4/SiO2 ratio. We have obtained slightly lower conductivities, but also lower activation energies, ca. 0.35 eV for the 30/70wt% LiBH4/SiO2 composition compared to the 0.43 eV reported by Choi et al. for an equivalent LiBH4/SiO2 stoichiometry. The difference in the reported conductivities might be due to differences in the preparation of the composites and /or difference in the preparation of the pellets (pressure and method of preparation). It could also be due to the different silica used, presenting different particle sizes, surface areas and the presence of pores within the particles in the present study. The difference in the activation energy is not easy to understand.
Quasielastic Neutron Scattering
xxxxxxxxxxxxxxxxxxxxxxxxxxxxxxxxxxxxxxxxxxxxxxxxxxxxxxxxxxxxxxxxxxxxxxxxxxxxxxxxxxxxxxxxxxxxxxxxxxxxxxxxxx xxxxxxxxxxxxxxxxxx xxxxxxxxxx xxxxxx xxxx xxxx xxxx xxxx xxxx xxxx xxxx xxxxx
xxxxxxxxxxxxxxxxxxxxxxxxxxxxx xxxxxxxxxxxxxxxxxxxxxxxxx xx xx x xx x x x xx xx xxxxxxx
50 100 150 200 250 300
12
Figure 3. Normalized intensities at the energy transfer of ±2 μeV for 30/70 wt% LiBH4/SiO2 during heating from 3K to 280K. The red crosses are the experimental data, the blue line results from the fit using Eq.2 with four Lorentzian (green, purple, dashed red and orange lines).
In Figure 3, a plot of an inelastic fixed window scan (IFWS) is shown. It displays the sum over all accessible scattering vector, from 0.50 to 1.96 Å−1 of the intensities recorded at the energy transfer of ±2 μeV while the temperature was increased from 3 to 280 K. Similarly to IFWS measurements performed for unmodified LiBH4,52the intensity increases to a maximum around 210 K and then decreases; however below that temperature two new local maxima are observed, at around 100 K and 140 K and above 210 K, the shoulder on the right of the main peak is better resolved. The better resolution of the shoulder compared to the published data52 could be due to different experimental conditions, heating ramp, amount of sample into the neutron beam or to the sample itself.
13
distinct dynamics in the low temperature orthorhombic phase of LiBH4 has been reported in two NMR studies.53,67 Two motions with different activation energies were observed and assumed to be due to rotations around the C2 and C3 axes of the BH4- tetrahedron. Our measurements corroborate these findings (see text below) and together with the results published by Remhof et al.52 are the first reports of such observation using QENS. In Figure 3, assuming that the observed quasielastic components would result in Lorentzian in the QENS spectra, as expected from BH4- reorientational dynamics, the data have been fitted using the following expression:
𝐼(𝑇) = ∑4𝑛=12 × 𝐼𝑛 × 𝐿(2, 𝛤𝑛(𝑇)) Eq. 2
where 𝐼𝑛are the respective scaling parameters of the four Lorentzian and 𝐿(2, 𝛤𝑛(𝑇)) are their values at ±2 eV. 𝛤𝑛(𝑇), the full widths at half maximum of the Lorentzian are assumed to follow Arrhenius behaviors as expected for thermally activated atomic motions i.e:
𝛤𝑛(𝑇) = 𝛤𝑛,0× 𝐸𝑥𝑝(− 𝐸𝑛
𝑘𝐵.𝑇) Eq. 3
where 𝐸𝑛is the activation energy for the observed dynamics, 𝑘𝐵the Boltzmann constant.
[image:13.595.104.492.678.740.2]In total 12 parameters were to fit and the starting graphically guessed values were set manually. A good fit was obtained with the values displayed in Table 1.
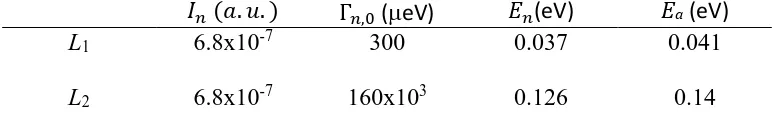
Table 1. Obtained values for the fitting parameters of the ±2 μeV temperature scan (Figure 3) using Eq. 2 and 3. Last column: activation energy from fits of the Arrhenius plot in Figure 6.
𝐼𝑛 (𝑎. 𝑢. ) Γ𝑛,0 (eV) 𝐸𝑛(eV) Ea (eV)
L1 6.8x10⁻⁷ 300 0.037 0.041
14
L3 1.13x10⁻⁵ 13x103 0.144 0.15
L4 1.9x10⁻⁶ 2x10⁵ 0.55 -
15
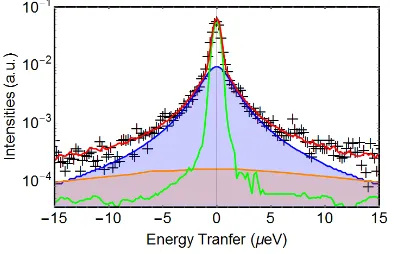
Figure 4. QENS Spectra for 30/70wt% LiBH4/SiO2, at Q=1.7239 Å-1 with a set energy transfer window of ±5 μeV and at, blue crosses: 80 K, Red triangles: 130 K, Green circles: 160 K, orange squares:200 K, Brown diamonds: 250 K.
Figure 5. Fitted QENS spectrum for 30/70wt% LiBH4/SiO2, at Q=1.8466 Å-1 with a set energy transfer window of ±30 μeV. Black crosses: experimental data, green curve: resolution function (QENS at 3K), blue curve: first Lorentzian, orange curve: second Lorentzian.
4
2
0
2
4
10
410
310
210
1Energy Tranfer
eV
In
te
n
si
ti
e
s
a
.u
[image:15.595.109.488.82.325.2] [image:15.595.102.496.416.670.2]16
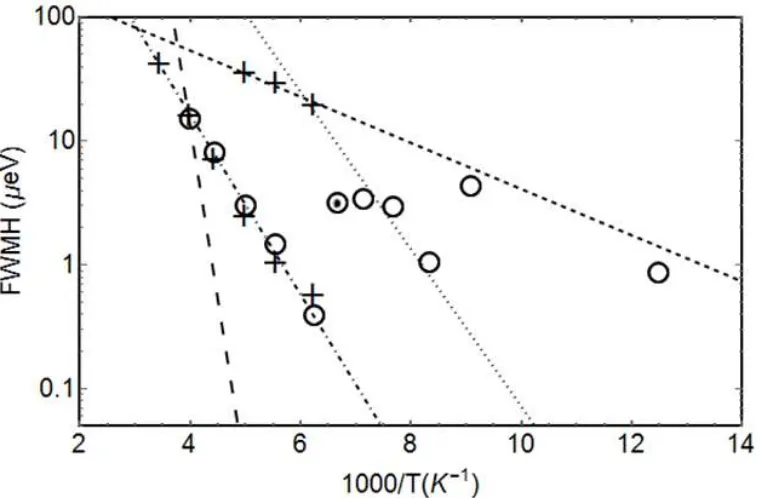
Figure 6. Arrhenius plots of the full width at half maximum of the QENS broadening. Crosses: from the spectra measured with the 30 energy window, circles with the 5 eV energy window. The lines are the expected broadening obtained from the fit performed on the temperature scan (IFWS) displayed in Figure 3 and using the parameters presented in Table 1
The Figure 5 exemplifies a fit with two Lorentzian for a spectrum taken at 160K, energy window of ±30 μeV and Q=1.481 Å-1.
The Figure 6 presents Arrhenius plots of the full width at half maximum (FWHM) of the quasielastic broadenings. The value, for a given temperature, is the average of the values obtained for all the detectors. Indeed the values were found to be Q-independent, as expected for localized dynamics (See Figure S3-S5 for the detailed values). They were obtained after the fits of the QENS spectra at different temperatures and for the two different energy transfer windows (5 and 30
eV). For the low temperature spectra (80K to 140K and 5eV), the fits at low Q values (Q<0.7
[image:16.595.110.489.86.335.2]17
quasielastic broadenings and for example the dotted circle point seems to fall out of the series probably because the fit captured an average value between two quasielastic components. The lines on Figure 6 represent the expected values of the Lorentzian FWHM calculated from the fits of IFWS (Figure 3 and Table 1). One should note here the very good agreement between the Lorentzian widths obtained via the two approaches. It illustrates the importance to develop linear motor Doppler drives to perform such IFWS.68 In Table 1, the Activation energies extracted from the Arrhenius plots are also shown (the actual fitting lines are not shown in Figure 6 for clarity). The dotted circle was removed from the fits, otherwise all other points were kept and the three activation energies obtained are similar to the ones obtained from the fit of the temperature scan for L1, L2 and L3. L4 is not visible in the QENS spectra as it would give either a narrow component, included in the elastic line, or a broad component overlapping with L1 or L3.
18
[image:18.595.116.483.194.445.2]Another possibility could be that L1 and L2 correspond to two different species dynamics, BH4- as expected, but also BH3 (See text below on the possible existence of BH3). In such a case BH4- could follow C2, C3 or isotropic diffusion resulting in L1 or L2, while BH3 would follow C3 rotation.
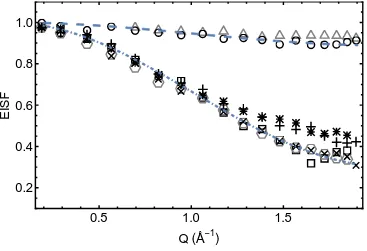
Figure 7. EISF of 30/70wt% LiBH4/SiO2 at selected temperatures. Open symbols, from the fits of the QENS spectra obtained with the 5 eV energy window (triangles: 140, circles: 150, squares 225, hexagons: 250 K). Other symbols from the fits of the QENS spectra obtained with the with the
30 eV energy window (plus: 225, asterisks: 250K, X: 290K). The dashed lines represent models for the BH4- rotational diffusion, uniaxial jumps about the C2 or C3 axis (Equ.4). The upper line is for p=0.16, the lower line for p=1.
The elastic incoherent structure factor (EISF) is the fraction of the total quasielastic intensity contained in the purely elastic peak. It is a measurable quantity evaluated as function of Q from the ratio of the integrated elastic intensity over the total scattered intensities. It may reveal the geometry of the observed dynamics. The Figure 7 displays some of the experimental EISFs, fitted with the models for C2/C3 hindered rotation as expressed in the following equation (the EISFs have the same expression for both rotation axis):
0.5 1.0 1.5
0.2 0.4 0.6 0.8 1.0
Q Å 1
E
IS
19
𝐸𝐼𝑆𝐹 = 1 − 𝑝 +1
2𝑝(1 + 𝑗0(2 √2
√3𝑄𝑑)) Eq. 4
With j0 the zeroth order Bessel function, d the B-H bond length and p the fraction of BHx (x=3 or 4) participating to the observed quasielastic signals.
Fits for isotropic rotational diffusion (Eq.5),69 were also performed for the low temperature EISFs (T<150 K), not apply for the higher temperatures as it would give EISFs values below 0.2 for Q>1.5 Å-1and such low values have never been observed for LiBH4 in the temperature range used in this study.
𝐸𝐼𝑆𝐹 = 1 − 𝑝 +1
2𝑝(1 + 𝑗0(2 √2
√3𝑄𝑑)) Eq. 5
20 NMR Measurements
Figure 8 shows single-pulse excitation spectra of 7Li nuclei in 30/70wt% LiBH4/SiO2 electrolyte in the temperature range from 245 to 341 K. While for macrocrystalline LiBH4, the spectrum comprises a single Lorentzian peak,71 two peaks are observed for the composite. These two peaks can be fitted with Lorentzian functions as exemplified for the measurement performed at 341 K. The narrower component becomes even sharper with the increasing temperature (Figure 8 - right insert) as previously reported by Verkuijlen et al. for LiBH4 nanoconfined in mesoporous silica.71 The broad component with a shift similar to the one for macrocrystalline LiBH4 is attributed to Li+ motions in unmodified bulk-like LiBH4, while the narrower component is attributed to more mobile Li+ cations from some modification of LiBH
21
Figure 8. 7Li single pulse excitation spectra for 30/70 wt% LiBH4/SiO2 without 1H decoupling in temperature range from 245 to 341 K (top to bottom: 245, 265, 283, 320, 341 K). The orange and green dashed lines illustrate the fit (red dashed line) to spectrum recorded at 341 K – The blue dashed line shows the difference between fit and data. Left insert: relative intensities of two spectral components (orange: broad, green: narrow component). Right insert: line width of the two spectral components (orange: broad, green: narrow component).
[image:21.595.130.463.82.321.2]
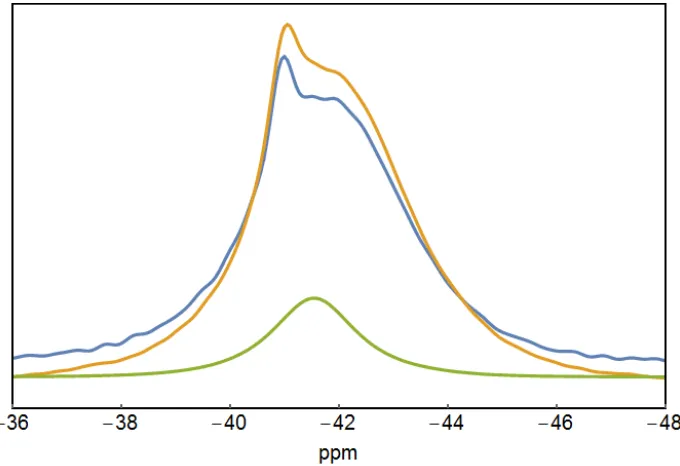
Figure 9. 11B single pulse excitation spectra for pure LiBH
[image:21.595.128.468.459.692.2]22
Figure 9 shows 11B single pulse excitation spectra for pure LiBH4 and 30/70% wt% LiBH4/SiO2 at 294 K and 341 K with 1H decoupling. The 11B resonance for the 30/70 wt% LiBH4/SiO2 composite is clearly different than for pure LiBH4. At 341 K, two components are seen at 40.97 ppm and -41.93 ppm for the composite while the spectrum for LiBH4 (at 294 K) shows a single resonance at -41.50 ppm. Hwang et al.73 have observed the splitting of the central resonance in the 11B spectrum for LiBH4 in mesoporous silicates at temperatures above 373 K, i.e., when LiBH4 is in the hexagonal crystal structure. Verkuijlen et al. 71 have also observed a similar splitting for the 11B resonance, both with and without 1H decoupling, for LiBH4 nanoconfined in mesoporous silica but at lower temperatures, as low as 283 K. Their presented pattern without 1H decoupling is similar to the one given by Shane at al.74 for molten LiBH
23
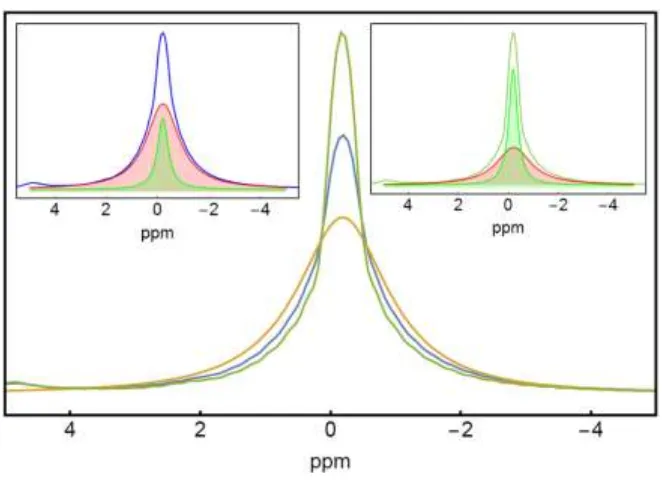
Figure 10. 1H+ single pulse excitation spectra for pure LiBH
4 (orange) and 30/70 wt% LiBH4/SiO2 at 294 K (blue) and 341 K (green). Inserts, left: 30/70 wt% LiBH4/SiO2 at 294 K and fit with two Lorentzian, right: at 341 K with two Lorentzian.
Figure 10 shows H+ single pulse excitation spectra for pure LiBH4 and 30/70 wt% LiBH4/SiO2 at 294 and 341 K. While the 1H+ spectrum for pure LiBH
4 shows a single peak at -0.2 ppm, the spectra for the composites show a superposition of a narrow central component and a broad component (See insert). This is similar to results from measurements reported by Verkuijlen et al. and Shane at al. who observed two components in the spectra for LiBH4 in mesoporous silica or carbon aerogel, respectively.71,72 They attributed the narrow component to more mobile hydrogen species than the one present in macrocrystalline LiBH4 resulting in the broader component. This suggests that in 30/70 wt% LiBH4/SiO2, already at room temperature, a fraction of the H atoms move faster in the composite than in bulk LiBH4. For the composite, a peak at 4.2 ppm is observed. Such a peak has been attributed to impurities75 or to H2 gas trapped inside of solid LiBH4 as similar peak was observed in the case of H2 trapped in AlH3.76 Hwang et al.,73 performing NMR measurements while heating a mixture of LiBH4 and SiO2, observed this ”H2 peak” and proposed a reaction ( Eq. 6) between the hydroxyl groups present at the surface of SiO2 and LiBH4, releasing hydrogen and occurring at about 373 K.
SiOH + [BH4]- →SiO- BH3 +H2 Eq. 6
24
Al2O3. Catalytic activity of the hydroxyl group in forming mobile species for NaAlH4 or NaH has also been reported,77 and similar reaction can be expected for LiBH4. In a recent work on LiBH4:P2S5 systems, Unemoto et al 78 suggested, from QENS measurements, that BH species could form from BH4- anions, not only as BH3, but also BH2 and possibly BH. The difference between mobility of BH4- (seen as mobile) and BH2 (seen as immobile) could explain the presence of the different populations in their QENS measurements. Explanation on the origin for these species was not given.
Herein, QENS and NMR measurements give strong evidences of the existence of a phase with highly mobile species (Li+ and H),accounting for example to up to 10 (NMR) or 16% (QENS) of the LiBH4 content in the 30/70 wt% composite at temperature below or close to room temperature. Undoubtedly this phase is at the origin of the high ionic lithium conductivity since the rest of the LiBH4 is found to be, both from NMR and QENS but also from differential scanning calorimetry and X-Ray diffraction measurements (see Figures S8 and S9 in the supplementary information), in the low temperature crystal structure. The phase with highly mobile H/Li+, might originate from the interfacial layer formed between LiBH4 and SiO2 as previously stated.43 In agreement with Choi et al.,45 we find an optimal LiBH4/SiO2 composition with an optimal conductivity as a result of the competition between increasing the fraction of the interfacial layer, i.e. increasing the surface area of SiO2 by increasing its content and the necessity to have percolation network with a percolation threshold.
25
might exist. LiBH4 is a Frenkel disordered ionic crystal,80 surface interactions between this ionic conductor and SiO2 would stabilize or destabilize the mobile ions on the surface sites, increasing the concentration of charge carriers, vacancies or interstitials ions in the space charge region. Surface interactions might lead to SiO-BH3 species, as depicted in Eq.6, and therefore contributes to increased conductivity of LiBH4/SiO2 composites. Choi et al. 46 report a larger density of B-O bonds in LiBH4/Al2O3 and showthat the conductivity in thiscomposite is twice as high the one of LiBH4/SiO2 which could be explain by the fact that Al2O3 has higher density of OH surface groups than SiO2 81and to a lesser extent by the difference in particle size (5 nm and 7 nm respectively) and surface area. Surface charge density has an important role in formation of B-O bonds and increased Li ion mobility and therefore surface engineering of oxides, to increase the surface charge density, should improve the conductivity of the LiBH4 – oxide composites.
26
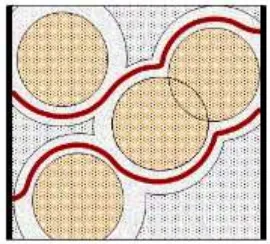
Figure 11. Macroscopic model for LiBH4/SiO2 conduction pathways. The spheres are SiO2 particles surrounded by interfacial layers of high conductivity, embedded in porous LiBH4 matrix. The red lines can represent Li+ paths. Adapted from Roman.82
Choi et al. obtained slightly higher conductivity for their composite electrolyte LiBH4/SiO2, using a different silica source, non-porous fumed silica vs porous aerogel, in this study. They measured the specific surface area, before milling, to be 362 m2.g-1, for 7 nm particles while for our purchased gel the surface area is given to be of 550 m2.g-1 but including the inner surface area of the pores. The pore volume is given to be 0.8 cm3.g-1 and of size 6 nm. Assuming spherical pores, we estimate the external surface area of silica gel to be of 150 m2.g-1. Thus, it is reasonable to assume that the fraction of interfacial LiBH4, in contact with SiO2 might be larger for fumed silica than for the gel and it results the observed conductivity difference. Here we assume that no or only a very small fraction of LiBH4 is confined in the pores of the silica gel, this is confirmed by the DSC and X-ray diffraction measurements (Figure S8 and S9). If a fraction of LiBH4 was nanoconfined one should observed a thermal event, corresponding the structural transition at lower temperature.43 Therefore we can conclude that the dominant effect, leading to high conductivities does not result from the effect of nanoconfinement, like size reduction of the crystallites or resulting strain but originates from interaction of the ionic conductor with the insulating phase.
[image:26.595.226.361.87.209.2]27
assumes that the temperature during ball-milling is high enough and that all the surface groups get in contact with unreacted LiBH4, however it indicates that the number of SiO-BH3 is not negligible, as illustrated by the possible third intermediate boron population found in the NMR spectra and the QENS results obtained at low temperature (T<150K) where L1 or L2 would be attributed to BH3 dynamics.
Charge-discharge cycling of solid-state Li-S batteries
28
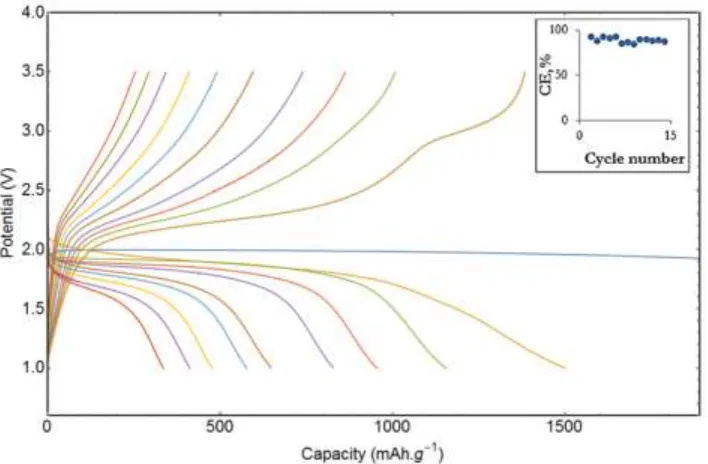
Figure 12. Discharge-charge cycles for a Li-S battery with 30/70 wt% LiBH4/SiO2 electrolyte at a rate 0.03 C and 328 K. The insert shows evolution of the coulombic efficiency (CE) with increasing cycle number
The high coulombic efficiency of 88.8% ± 2.7% (calculated average capacity loss) during the first 10 cycles proves the reversibility of the electrochemical reaction induced during the charge/discharge cycles and since the voltage plateaus are very close to the theoretical one (1675 mAhg-1 sulfur at 2.15 V) 4–10, we can exclude the existence of non-reversible electrochemical reaction (except for the first discharge). In fact, the fading capacity could be due to loss of contact as the electrolyte/electrode interface due to swelling of the positive electrode during cycling.
Impedance of solid state Li-S batteries
29
[image:29.595.70.526.145.306.2](W) models the finite-length diffusion of Li ions in the positive electrode.41 The minima point in the Nyquist plot gives the value of the overall cell resistivity (i.e. Rc = R1+R2).
Figure 13. Left: Nyquist plot of EIS measurement of a newly assembled Li-S cell with 30/70 wt% LiBH4/SiO2 electrolyte. The measurement was performed before first discharge. Circles: experimental data, continuous line: fit. Middle: Nyquist plots of EIS measurements of a Li-S cell with 30/70 wt% LiBH4+SiO2 electrolyte. Right: Development of cell resistivity during cycling of a Li-S cell with 30/70 wt% LiBH4/SiO2 electrolyte.
The portion of arc in the high frequency region (left of the minima) is the typical contribution from the electrolyte. It is possible that the arc consists of two or more overlapping components (bulk and grain boundary Li+ diffusion for example), 34 however they are not possible to separate with the current setup. Figure 13 (middle) shows the Nyquist plot for EIS measurements performed on a Li-S battery with 30/70 wt% LiBH4/SiO2 electrolyte acquired after each of discharge and Figure 13 (right) shows the evolution of the cell resistivity (Rc) with the cycles number read from Figure 13 (middle).
30
work is needed to explain the origin of the high capacity during the first discharge of a Li-S cell. The steadily increase of the cell resistivity could originate from the loss of contact between the solid electrolyte and the electrodes because of the mechanical stresses imposed to the different components. On the negative electrode side there is the stripping and plating of metallic lithium while on the cathode side the redox of S gives large volume changes (a 289 % increase in molar volume due to conversion of S to Li2S).6 The increase in the cell resistivity, however, does not lead to a large Ohmic drop through the cell, calculated to be of about 1 mV after the last cycle, and therefore cannot explain fully the fading capacity. The charge and discharge curves in Figure 12 exhibit sloppy plateaus instead of the expected flat plateaus. The ends of the discharge have steeper slopes than the charge curves and the slopes are getting stepper and stepper with the cycle numbers. This can probably be explained by contact issues between the sulfur electrode and the composite electrolyte and by the more and more difficult access for lithium to react with sulfur. The increased slope toward the end of the discharge curves probably arises because it would be natural for Li+ to first reacts with area where S is in good contact with the electrolyte and as the discharge proceeds, the sulfur reduction would take place in areas with ever less contact, resulting in an ever-greater overvoltage and consequently a steeper slope of the discharge curve. At the end, the fading capacity could be due to loss of contact at the electrolyte/electrode interface with less and less sulfur being available to react.
4. Conclusions
31
LiBH4 exists despite the absence of nanoconfinement and might result from the interaction with the silica surface via the reaction with the silanol groups. To further increase the conductivity it is clear that one should aim at maximizing the contact area between LiBH4 and SiO2, i.e use silica of larger surface area and optimizing the ratio between the borohydride and silica. A second and complementary strategy will be to functionalize and structured the surface of the insulating material to increase the density and nature of the active surface groups.
The batteries have been cycled and show reasonable capacity retention (coulombic efficiency of 88.8% ± 2.7% and average capacity loss of 7.2% during the first 10 cycles). Further work is needed to explain the origin of the high capacity during the first discharge of a Li-S cell, however the presumably formed CEI layer does not seem to be a major limiting factor during second and onward cycles.
5. Supporting Information
Example of an EIS - Nyquist plot obtained at 333 K for 30/70 wt % LiBH4/SiO2 and its fit.
QENS Spectra at different temperatures (160, 200, 250K), for 30/70wt% LiBH4/SiO2, at Q=1.7239 Å-1 with a set energy transfer window of ±30μeV.
QENS spectra FWHM temperature dependency obtained from the fit of QENs Spectra for the two energy transfer window (±5 and ±30μeV) and at different temperatures.
32 6. Acknowledgements
The authors would like to acknowledge Bernhard Frick, beamline IN16b at ILL Grenoble, France for helping with measurements and discussions around the analysis of the data. Furthermore, we acknowledge Otto Mønsteds Fonds for the financial support of NMR measurements and Danish Research Council (DANSCATT) for the financial support of neutron measurements.
7. References
(1) Manthiram, A.; Fu, Y.; Chung, S.; Zu, C.; Su, Y. Rechargeable Lithium - Sulfur Batteries. Chem. Rev. 2014, 114, 11751–11787.
(2) Bruce, P. G.; Freunberger, S. A.; Hardwick, L. J.; Tarascon, J.-M. Li–O2 and Li–S Batteries with High Energy Storage. Nat. Mater. 2011, 11, 172–172.
(3) Younesi, R.; Veith, G. M.; Johansson, P.; Edstrom, K.; Vegge, T. Lithium Salts for Advanced Lithium Batteries: Li-Metal, Li-O2, and Li-S. Energy Environ. Sci. 2015, 8, 1905–1922. (4) Kim, J.; Lee, D. J.; Jung, H. G.; Sun, Y. K.; Hassoun, J.; Scrosati, B. An Advanced Lithium-Sulfur Battery. Adv. Funct. Mater. 2013, 23, 1076–1080.
(5) Song, M.-K.; Cairns, E. J.; Zhang, Y. Lithium/sulfur Batteries with High Specific Energy: Old Challenges and New Opportunities. Nanoscale 2013, 5, 2186–2204.
(6) Kobayashi, T.; Imade, Y.; Shishihara, D.; Homma, K.; Nagao, M.; Watanabe, R.; Yokoi, T.; Yamada, A.; Kanno, R.; Tatsumi, T. All Solid-State Battery with Sulfur Electrode and Thio-LISICON Electrolyte. J. Power Sources 2008, 182, 621–625.
33
(8) Lin, Z.; Liang, C. Lithium-Sulfur Batteries: From Liquid to Solid Cells. J. Mater. Chem. A 2015, 3, 936–958.
(9) Manthiram, A.; Chung, S.-H.; Zu, C. Lithium–Sulfur Batteries: Progress and Prospects. Adv. Mater. 2015, 27, 1980–2006.
(10) Kim, T. H.; Park, J. S.; Chang, S. K.; Choi, S.; Ryu, J. H.; Song, H. K. The Current Move of Lithium Ion Batteries towards the next Phase. Adv. Energy Mater. 2012, 2, 860–872. (11) Nitta, N.; Wu, F.; Lee, J. T.; Yushin, G. Li-Ion Battery Materials: Present and Future. Mater. Today 2015, 18, 252–264.
(12) Zheng, S.; Han, P.; Han, Z.; Zhang, H.; Tang, Z.; Yang, J. High Performance C/S Composite Cathodes with Conventional Carbonate-Based Electrolytes in Li-S Battery. Sci. Rep. 2014, 4, 4842.
(13) Li, M.; Zhang, Y.; Wang, X.; Ahn, W.; Jiang, G.; Feng, K.; Lui, G.; Chen, Z. Gas Pickering Emulsion Templated Hollow Carbon for High Rate Performance Lithium Sulfur Batteries. Adv. Funct. Mater. 2016, 8408–8417.
(14) Hoffmann, C.; Thieme, S.; Brückner, J.; Oschatz, M.; Biemelt, T.; Mondin, G.; Althues, H.; Kaskel, S. Nanocasting Hierarchical Carbide-Derived Carbons in Nanostructured Opal Assemblies for High-Performance Cathodes in Lithium-Sulfur Batteries. ACS Nano 2014, 8, 12130–12140.
(15) Yuan, Y.; Guihua, Y.; Judy J., C.; Hui, W.; Michael, V.; Yan, Y.; Zhenan, B.; Yi, C. Improving the Performance of Lithium-Sulfur Batteries by Conductive Polymer Coating. ACS Nano 2011, 5, 9187–9193.
34
(17) Liu, X.; Shan, Z.; Zhu, K.; Du, J.; Tang, Q.; Tian, J. Sulfur Electrode Modified by Bifunctional Nafion/γ-Al2O3 Membrane for High Performance Lithium-Sulfur Batteries. J. Power Sources 2015, 274, 85–93.
(18) Hayashi, A.; Ohtomo, T.; Mizuno, F.; Tadanaga, K.; Tatsumisago, M. All-Solid-State Li/S Batteries with Highly Conductive Glass–ceramic Electrolytes. Electrochem. commun. 2003, 5, 701–705.
(19) Jeon, B. H.; Yeon, J. H.; Kim, K. M.; Chung, I. J. Preparation and Electrochemical Properties of Lithium-Sulfur Polymer Batteries. J. Power Sources 2002, 109, 89–97.
(20) Yu, X.; Xie, J.; Yang, J.; Wang, K. All Solid-State Rechargeable Lithium Cells Based on Nano-Sulfur Composite Cathodes. J. Power Sources 2004, 132, 181–186.
(21) Hayashi, A.; Ohtomo, T.; Mizuno, F.; Tadanaga, K.; Tatsumisago, M. Rechargeable Lithium Batteries, Using Sulfur-Based Cathode Materials and Li2S–P2S5 Glass-Ceramic Electrolytes. Electrochim. Acta 2004, 50, 893–897.
(22) Belous, A. G.; Novitskaya, G. N.; Polyanetskaya, S. V.; Gornikov, Y. I. Study of Complex Oxides with the Composition LA2/3-XLI3XTIO3. Inorg. Mater. 1987, 23, 412–415.
(23) Inaguma, Y.; Liquan, C.; Itoh, M. High Ionic Conductivity in Lithium Lanthanum Titanate. Solid State Commun. 1993, 86, 689–693.
(24) Seo, I.; Martin, S. W. New Developments in Solid Electrolytes for Thin-Film Lithium Batteries. Lithium Ion Batter. New Dev. 2012, 1, 101–144.
(25) Bruce, P. G.; West, A. R. The A-C Conductivity of Polycrystalline LISICON, Li2+2x Zn1-X GeO4, and a Model for Intergranular Constriction Resistances. J. Electrochem. Soc. 1983,
35
(26) Kamaya, N.; Homma, K.; Yamakawa, Y.; Hirayama, M.; Kanno, R.; Yonemura, M.; Kamiyama, T.; Kato, Y.; Hama, S.; Kawamoto, K.; et al. A Lithium Superionic Conductor. Nat. Mater. 2011, 10, 682–686.
(27) Bachman, J. C.; Muy, S.; Grimaud, A.; Chang, H. H.; Pour, N.; Lux, S. F.; Paschos, O.; Maglia, F.; Lupart, S.; Lamp, P.; et al. Inorganic Solid-State Electrolytes for Lithium Batteries: Mechanisms and Properties Governing Ion Conduction. Chem. Rev. 2016, 116, 140–162.
(28) Unemoto, A.; Matsuo, M.; Orimo, S. Complex Hydrides for Electrochemical Energy Storage. Adv. Funct. Mater. 2014, 24, 2267–2279.
(29) de Jongh, P. E.; Blanchard, D.; Matsuo, M.; Udovic, T. J.; Orimo, S. Complex Hydrides as Room-Temperature Solid Electrolytes for Rechargeable Batteries. Appl. Phys. A 2016,
122, 251.
(30) Züttel, A.; Wenger, P.; Rentsch, S.; Sudan, P.; Mauron, P.; Emmenegger, C. LiBH4 a New Hydrogen Storage Material. al., J. Power Sources, 118, 1, 2003.
(31) Lodziana, Z.; Vegge, T. Structural Stability of Complex Hydrides: LiBH4 Revisited. Phys. Rev. Lett. 2004, 93, 145501.
(32) Blanchard, D.; Shi, Q.; Boothroyd, C. B.; Vegge, T. Reversibility of Al/Ti Modified LiBH4. J. Phys. Chem. C 2009, 113, 14059–14066.
(33) Matsuo, M.; Nakamori, Y.; Orimo, S.; Maekawa, H.; Takamura, H. Lithium Superionic Conduction in Lithium Borohydride Accompanied by Structural Transition. Appl. Phys. Lett. 2007, 91, 224103.
36
(35) Epp, V.; Wilkening, M. Fast Li Diffusion in Crystalline LiBH4 due to Reduced Dimensionality: Frequency-Dependent NMR Spectroscopy. Phys. Rev. B 2010, 82, 20301.
(36) Mohtadi, R.; Orimo, S. The Renaissance of Hydrides as Energy. Nat. Publ. Gr. 2016,
2, 1–16.
(37) Unemoto, A.; Yasaku, S.; Nogami, G.; Tazawa, M.; Taniguchi, M.; Matsuo, M.; Ikeshoji, T.; Orimo, S. Development of Bulk-Type All-Solid-State Lithium-Sulfur Battery Using LiBH4 Electrolyte. Appl. Phys. Lett. 2014, 105, 83901.
(38) Aeberhard, P.C., Refson, K.; David, W. I. F. Molecular Dynamics Investigation of the Disordered Crystal Structure of Hexagonal LiBH4. Phys. Chem. Chem. Phys. 2013, 15, 8081–8087. (39) Maekawa, H.; Matsuo, M.; Takamura, H.; Ando, M.; Noda, Y.; Karahashi, T.; Orimo, S. Halide-Stabilized LiBH4, a Room-Temperature Lithium Fast-Ion Conductor. J. Am. Chem. Soc. 2009, 131, 894–895.
(40) Oguchi, H.; Matsuo, M.; Hummelshøj, J. S.; Vegge, T.; Nørskov, J. K.; Sato, T.; Miura, Y.; Takamura, H.; Maekawa, H.; Orimo, S. Experimental and Computational Studies on Structural Transitions in the LiBH4-LiI Pseudobinary System. Appl. Phys. Lett. 2009, 94, 141912. (41) Sveinbjörnsson, D.; Christiansen, A. S.; Viskinde, R.; Norby, P.; Vegge, T. The LiBH4-LiI Solid Solution as an Electrolyte in an All-Solid-State Battery. J. Electrochem. Soc. 2014,
161, A1432–A1439.
(42) Unemoto, A.; Chen, C.; Wang, Z.; Matsuo, M.; Ikeshoji, T.; Orimo, S. Pseudo-Binary Electrolyte, LiBH4 –LiCl, for Bulk-Type All-Solid-State Lithium-Sulfur Battery. Nanotechnology 2015, 26, 254001.
37
(44) Das, S.; Ngene, P.; Norby, P.; Vegge, T.; Jongh, P. E. De; Blanchard, D. All-Solid-State Lithium-Sulfur Battery Based on a Nanoconfined LiBH4 Electrolyte. J. Electrochem. Soc. 2016, 163, 2029–2034.
(45) Choi, Y. S.; Lee, Y.-S.; Oh, K. H.; Cho, Y. W. Interface-Enhanced Li Ion Conduction in a LiBH4 –SiO2 Solid Electrolyte. Phys. Chem. Chem. Phys. 2016, 18, 22540–22547.
(46) Choi, Y. S.; Lee, Y.-S.; Choi, D.-J.; Chae, K. H.; Oh, K. H.; Cho, Y. W. Enhanced Li Ion Conductivity in LiBH4 –Al2O3 Mixture via Interface Engineering. J. Phys. Chem. C 2017, 121, 26209–26215.
(47) Robin Bendall, M.; Gordon, R. E. Depth and Refocusing Pulses Designed for Multipulse NMR with Surface Coils. J. Magn. Reson. 1983, 53, 365–385.
(48) Bielecki, A.; Burum, D. P. Temperature Dependence of 207Pb MAS Spectra of Solid Lead Nitrate. An Accurate, Sensitive Thermometer for Variable-Temperature MAS. J. Magn. Reson. Ser. A 1995, 116, 215–220.
(49) Azuah, R. T.; Kneller, L. R.; Qiu, Y.; Brown, C. M.; Copley, J. R. D.; Dimeo, R. M. DAVE?: A Comprehensive Software Suite. J. Res. Natl. Inst. Stand. Technol. 2009, 114, 341–358. (50) Beekmans, N. M.; Heyne, L. Correlation between Impedance, Microstructure and Composition of Calcia-Stabilized Zirconia. Electrochim. Acta 1976, 21, 303–310.
(51) Haile, S. M.; West, D. L.; Campbell, J. The Role of Microstructure and Processing on the Proton Conducting Properties of Gadolinium-Doped Barium Cerate. J. Mater. Res. 1998, 13, 1576–1595.
38
(53) Skripov, A. V.; Soloninin, A. V.; Filinchuk, Y.; Chernyshov, D. Nuclear Magnetic Resonance Study of the Rotational Motion and the Phase Transition in LiBH4. J. Phys. Chem. C 2008, 112, 18701–18705.
(54) Buchter, F.; Lodziana, Z.; Mauron, P.; Remhof, a.; Friedrichs, O.; Borgschulte, a.; Züttel, a.; Sheptyakov, D.; Strässle, T.; Ramirez-Cuesta, a. Dynamical Properties and Temperature Induced Molecular Disordering of LiBH4 and LiBD4. Phys. Rev. B 2008, 78, 1–9.
(55) Soloninin, A. V.; Skripov, A. V.; Buzlukov, A. L.; Stepanov, A. P. Nuclear Magnetic Resonance Study of Li and H Diffusion in the High-Temperature Solid Phase of LiBH4. J. Solid State Chem. 2009, 182, 2357–2361.
(56) Blanchard, D.; Riktor, M. D.; Maronsson, J. B.; Jacobsen, H. S.; Kehres, J.; Sveinbjo, D.; Bardaji, E. G.; Le, A.; Juranyi, F.; Wuttke, J.; et al. Hydrogen Rotational and Translational Diffusion in Calcium Borohydride from Quasielastic Neutron Scattering and DFT Calculations. Jounal Phys. Chemitry C 2010, 114, 20249–20257.
(57) Remhof, A.; Lodziana, Z.; Martelli, P.; Friedrichs, O.; Züttel, A.; Skripov, A.; Embs, J.; Strässle, T. Rotational Motion of BH4 Units in MBH4 (M=Li,Na,K) from Quasielastic Neutron Scattering and Density Functional Calculations. Phys. Rev. B 2010, 81, 1–9.
(58) Martelli, P.; Remhof, A.; Borgschulte, A.; Ackermann, R.; Strässle, T.; Embs, J. P.; Ernst, M.; Matsuo, M.; Orimo, S.-I.; Züttel, A. Rotational Motion in LiBH4/LiI Solid Solutions. J. Phys. Chem. A 2011, 115, 5329–5334.
39
Barriers of BH4- Tetrahedra in Beta-Mg(BH4)2 from Quasielastic Neutron Scattering and DFT Calculations. J. Phys. Chem. C 2012, 116, 2013.
(61) Verdal, N.; Udovic, T. J.; Rush, J. J.; Wu, H.; Skripov, A. V. Evolution of the Reorientational Motions of the Tetrahydroborate Anions in Hexagonal LiBH4-LiI Solid Solution by High-Q Quasielastic Neutron Scattering. J. Phys. Chem. C 2013, 117, 12010–12018.
(62) Udovic, T. J.; Verdal, N.; Rush, J. J.; De Vries, D. J.; Hartman, M. R.; Vajo, J. J.; Gross, A. F.; Skripov, A. V. Mapping Trends in the Reorientational Mobilities of Tetrahydroborate Anions via Neutron-Scattering Fixed-Window Scans. J. Alloys Compd. 2013, 580, S47–S50.
(63) Remhof, A.; Yan, Y.; Embs, J. P.; Sakai, V. G.; Nale, A.; De Jongh, P. E.; Lodziana, Z.; Züttel, A. Rotational Disorder in Lithium Borohydride. EPJ Web Conf. 2015, 83, 2014.
(64) Remhof, A.; Mauron, P.; Züttel, A.; Embs, J. P.; Lodziana, Z.; Ramirez-Cuesta, A. J.; Ngene, P.; De Jongh, P. Hydrogen Dynamics in Nanoconfined Lithiumborohydride. J. Phys. Chem. C 2013, 117, 3789–3798.
(65) Verdal, N.; Udovic, T. J.; Rush, J. J.; Liu, X.; Majzoub, E. H.; Vajo, J. J.; Gross, A. F. Dynamical Perturbations of Tetrahydroborate Anions in LiBH4 due to Nanoconfinement in Controlled-Pore Carbon Scaffolds. J. Phys. Chem. C 2013, 117, 17983.
(66) Suwarno; Ngene, P.; Nale, A.; Eggenhuisen, T. M.; Oschatz, M.; Embs, J. P.; Remhof, A.; De Jongh, P. E. Confinement Effects for Lithium Borohydride: Comparing Silica and Carbon Scaffolds. J. Phys. Chem. C 2017, 121, 4197–4205.
(67) Tsang, T.; Farrar, T. C. Nuclear Magnetic Relaxation Studies of Internal Rotations and Phase Transitions in Borohydrides of Lithium, Sodium, and Potassium. J. Chem. Phys. 1969,
50, 3498–3502.
40
Nucl. Instruments Methods Phys. Res. Sect. A Accel. Spectrometers, Detect. Assoc. Equip. 2012,
669, 7–13.
(69) Bée, M. Quasielastic Neutron Scattering; Hilger, A., Ed.; Bristol and Philadelphia, PA, 1988.
(70) Filinchuk, Y.; Chernyshov, D.; Cerny, R. Lightest Borohydride Probed by Synchrotron X-Ray Diffraction?: Experiment Calls for a New Theoretical Revision. Jounal Phys. Chemitry C 2008, 112, 10579–10584.
(71) Verkuijlen, M. H. W.; Ngene, P.; De Kort, D. W.; Barré, C.; Nale, A.; Van Eck, E. R. H.; Van Bentum, P. J. M.; De Jongh, P. E.; Kentgens, A. P. M. Nanoconfined LiBH4 and Enhanced Mobility of Li+ and BH
4- Studied by Solid-State NMR. J. Phys. Chem. C 2012, 116, 22169–22178. (72) Shane, D. T.; Corey, R. L.; McIntosh, C.; Rayhel, L. H.; Bowman, R. C.; Vajo, J. J.; Gross, A. F.; Conradi, M. S. LiBH4 in Carbon Aerogel Nanoscaffolds: An NMR Study of Atomic Motions. J. Phys. Chem. C 2010, 114, 4008–4014.
(73) Hwang, S.; Lee, H.; To, M.; Lee, Y.; Whan, Y.; Choi, H.; Kim, C. Probing Molecular Dynamics of Metal Borohydrides on the Surface of Mesoporous Scaffolds by Multinuclear High Resolution Solid State NMR. J. Alloys Compd. 2015, 645, S316–S319.
(74) Shane, D. T.; Bowman, R. C.; Conradi, M. S. Exchange of Hydrogen Atoms Between BH4 in LiBH4. J. Phys. Chem. C 2009, 113, 5039–5042.
(75) Shane, D. NMR Study of Borohydrides for Hydrogen Storage Applications. All Theses Diss. 2011, 320.
(76) Senadheera, L.; Carl, E. M.; Ivancic, T. M.; Conradi, M. S.; Bowman, R. C.; Hwang, S. J.; Udovic, T. J. Molecular H2 Trapped in AlH3 Solid. J. Alloys Compd. 2008, 463, 1–5.
41
(78) Unemoto, A.; Wu, H.; Udovic, T. J.; Matsuo, M.; Ikeshoji, T.; Orimo, S. Fast Lithium-Ionic Conduction in a New Complex Hydride–sulphide Crystalline Phase. Chem. Commun. 2016, 52, 564–566.
(79) Liang, C. C. Conduction Characteristics of the Lithium Iodide-Aluminum Oxide Solid Electrolytes. J. Electrochem. Soc. 1973, 120, 1289.
(80) Myrdal, J. S. G.; Blanchard, D.; Sveinbjörnsson, D.; Vegge, T. Li-Ion Conduction in the LiBH4:LiI System from Density Functional Theory Calculations and Quasi-Elastic Neutron Scattering. J. Phys. Chem. C 2013, 117, 9084–9091.
(81) Gunko, V. M.; Turov, V. V; Chuiko, A. A. Fundamentals of Nanosilica Applications for Human Protection. In Surface Chemistry in Biomedical and Environmental Science.; Blitz J.P., G. V. M., Ed.; Springer: Dordrecht, 2006; 177–190.
(82) Roman, H. E. A Continuum Percolation Model for Dispersed Ionic Conductors. J. Phys. Condens. Matter 1990, 2, 3909–3917.
(83) Binder, A.; Heel, A.; Kasper, G. Deposition of Palladium Nanodots of Controlled Size and Density onto Surface-Modified SiO2 Particles by an Atmospheric Pressure CVS/MOCVD Process. Chem. Vap. Depos. 2007, 13, 48–54.
(84) Ji, X.; Lee, K. T.; Nazar, L. F. A Highly Ordered Nanostructured Carbon-Sulphur Cathode for Lithium-Sulphur Batteries. Nat. Mater. 2009, 8, 500–506.