© 2019, IRJET | Impact Factor value: 7.211 | ISO 9001:2008 Certified Journal
| Page 5164
Probability based Missing Value Imputation Method and its Analysis
Anaswara R
1, Sruthy S
21
M. Tech. Student, Computer Science and Engineering, Sree Buddha College of Engineering, Kerala, India.
2
Assistant Professor, Computer Science and Engineering, Sree Buddha College of Engineering, Kerala, India.
---***---Abstract -
Missing data is one of the major problems in datasets which reduce the integrity and deviate data mining. Processing of missing data is an important step in the process of data pre-processing. Imputation technique is used to fill the missing data, which give the complete knowledge of the dataset. The missing data imputation technique is applied in the phase of data pre-processing. Here uses probability based method for imputing missing data. This will help to reduce the data missing due to human caused errors. The imputed data set are more efficient. Map-reduce programming model is applied with this method for large-scale data processing. After the imputation process the filled dataset and the missing data set are analyzed using clustering method. This work uses K-Means and DBSCAN clustering algorithms. The analysis shows that the instances in clusters are changed after imputation.Key Words: Imputation, Map-Reduce, Attribute
combination, Possible value, Marked dataset, Data pre-processing.
1. INTRODUCTION
Missing data in a dataset will damage the integrity of data. This will deviate from data mining and analysis. Missing data means in a dataset some tuples has no entry for some attributes. The main reasons for missing data are error in manual data entry, equipment error, and incorrect measure. This missing data will leads to some problems like, loss of efficiency, complication in handling and analyzing the data and the actual result of data mining is different from the current result. If the dataset containing large amount of missing data the missing data treatment will improve the mining process quality. Here uses imputation process for missing data treatment. Missing data imputation is used to complete an incomplete dataset. Missing data can harm the integrity of the data as well as lead to the deviation of the data mining and analysis. Therefore, it is necessary to implement the imputation of missing value in the phase of data pre-processing to reduce the possibility of data missing as a result of human error and operations.Imputation will improve the accuracy and efficiency of the dataset.
The issue of missing (or fragmented) data is generally common in numerous fields of research, and it might have diverse causes, for example, equipment malfunctions, unavailability of equipment, refusal of respondents to answer certain questions and so forth. These sorts of missing data are unintended and uncontrolled by the scientists; however the general outcome is that the observed
information can't be analyzed in view of the incompleteness of the dataset. Various scientists over most recent quite a few years have researched strategies for managing missing data. Imputation is the significant step in data pre-processing. During the past decade the researchers, practitioners, and academic communities have been proposing different methods for the area of missing data handling.
In this work missing data imputation is performed using a probability method. Data mining based missing data imputation system is considered and analyzed. The analysis shows the importance of missing data imputation. The main objective of this project is to develop an application capable of identifying the presence of missing data and perform possible replacement for the missing data.
Imputation is the way of replacing missing data with substituted values. It is necessary to implement the imputation of missing value in the phase of data pre-processing to reduce the possibility of data missing as a result of human error and operations. The main objective of the project is to develop a framework that estimate the presence of missing data and apply possible correction on dataset.
• Develop an application is that can capture industrial data from a set of sensors used with chemical process.
• In this application a control panel is used, that can activate/ deactivate the sensors periodically. The sequence of sensor operations causes missing data.
• The sensor output is used to create dataset.
• DBSCAN and K-Means clustering are used to analysis of sensor data tuples. The result displays the collective characteristics of tuples generated at different time.
2. SYSTEM OVERVIEW
Now a day there is a need for processing large amount of data. The incomplete data will reduce the quality of data analysis. The objective of this project is to impute missing data in the dataset. There exist numerous different techniques for missing data filling. Here use a probability based imputation method for missing data filling.
© 2019, IRJET | Impact Factor value: 7.211 | ISO 9001:2008 Certified Journal
| Page 5165
Another imputation method is missing value imputation algorithm based on evidence chain [1]. In list wise deletion, if a case has missing data for any of the variables, then simply delete that case from the analysis. But this method will exclude a large fraction of the original sample. This is not an efficient method, often reduces sample size and statistical power when many variables have missing data. Because it discards some valid data, complete case analysis generally is not efficient. In pair wise deletion method considers every feature independently. For each feature, all recorded values in each observation are considered and missing data are ignored. Utilizing every single accessible data between pair of variables to ascertain covariance; just delete “pairs" with explicit missing data (not the entire case is deleted). Its disadvantages are: mathematical problems: Covariances have different sample sizes; different parts of the model have different degrees of freedom and not efficient, and could create problems in estimation, since the observed correlation matrix may not be positive definite. Mean imputation is one of the most frequently used techniques to treat missing data. The variable’s mean value of all known values of that attribute is substituted where the instance with missing attribute belongs. In hot deck imputation missing data are replaced with values form input data vector that is nearest in terms of the attributes that are known in both patterns. By substituting different observed values for each missing value it attempts to protect the distribution. In KNN the Nearest Neighbors for the missing record are identified by calculating the distance between missing instance and other complete instances in the dataset. Drawbacks of existing system are Time consumption: Some methods requires more time for imputation if the number of records are more, less efficient, data size: If the size of the data is too large, it is very difficult to process all the data. Number of missing rate: If the missing rate is large the result of existing systems are not efficient. The existing system uses classification method like Naive Bayes, KNN and Mode for analysis.
This proposed system is designed to identify the missing data, fill the missing data and perform a cluster based analysis [4]. This system use probability of possible value for imputation. Then the resultant dataset is analyzed using clustering algorithms K-Means and DBSCAN. The proposed system’s dataset is real time. So every time it will generate different number of records and it has different amount of missing data rate. This method takes less time to find the missing data and find the possible value for imputation. For finding the value for missing data the large dataset is represented in different ways.
The existing system generates an application to create numerical dataset. In this project develop an application that creates dataset and missing data fields also generated. This is used as the input for the missing data imputation. The application generated data are stored in a database. The proposed probability method will scan the entire table and find the position of missing data. This missing field’s row and
column are storing in another table. Similarly all missing data positions are storing in this table. This will help to quick finding of missing data. Then compute the value for possible value. The possible values are the values present in the same column number of missing value. Similarly compute possible values for each missing value. These results will store in another table. At the time of imputation this will reduce time to compute possible value for each missing value the main table. Because possible value for every the missing values are already calculated. Therefore there is no need to search large table every time. In next step compute the combination attribute from the input table. Combination attributes are the values coming with missing data. The time, dates are not considered. This also stored in a table. Then compute the count of each combination attribute. Calculate the probability for every possible value. This process reduces the time for searching the dataset and reduces the size of input table. This is called map-reduce operation.
At the time of imputation the possible value corresponding to the missing data that has greater probability value is used to impute missing data. Some times more than one possible value has same probability. This time the count of combination attribute also considered. For example if two possible values has greatest probability at this time take the count of combination attribute coming with the possible value. The possible value that has greatest count for the combination attribute is taken as the value for missing data imputation. Finally create a complete dataset that has no missing data.
Clustering algorithms DBSCAN and K-Means are used for the analysis. The completed and missing datasets are converted to csv and arff format and given to the clustering algorithms input. The clustering algorithm generates clusters. This result is used for the analysis. The analysis shows that cluster instances changes cluster group before imputation and after imputation.
3. SYSTEM DESIGN
The missing data imputation system consists of six modules:
1. Configuration
2. Data capturing
3. Dataset management
4. Map-Reduce
5. Missing data imputation
© 2019, IRJET | Impact Factor value: 7.211 | ISO 9001:2008 Certified Journal
| Page 5166
3.1 Configuration
The function of configuration module is the application needs simulator data that comes as part of sensor output. Each sensor has its own functions like sensing temperature, pressure and humidity values. The function of each sensor is configured in this section. Also a limit of values bound to each sensor. The output of the sensors is numerical values. In between the generation of data some missing fields are also generated. The value for each sensor, time and date is stored is in a table. This is used to create the dataset for missing data imputation. In this module the admin add new sensors. At this time specify the range of values for each sensors, its cut-off value, and type of sensors (temperature/pressure/humidity). In this module new sensors can added and can edit the values of sensors that are previously registered. The admin can add the sensors, update or delete the sensors in this module. The registered sensors are shown in a grid.
3.2 Data capturing
The second module is data capturing this module includes a control panel that can activate/ deactivate the sensors periodically. The control panel will display all the sensors and an on and off button. The admin will turn on the sensor. The process operator will on/off the sensors. The sequence of sensor operations causes missing data. The captured data undergo a Map-Reduce algorithm for handling efficient storage and quick retrieval.
3.3 Dataset management
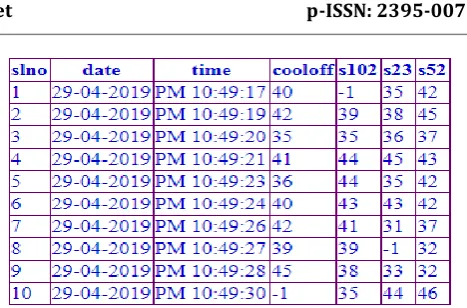
Third module is dataset management. Dataset management is a major step in this system. The dataset is the output from configuration module. The missing data fields in the dataset is represented with “-1”. The dataset contain date, time, sensor type, and the numerical value for each sensor. Here the mapped data can be converted to a CSV file. CSV stands for “Comma-Separated Values”. Its data fields are regularly isolated, or delimited, by a comma. CSV is a simple file format used to store tabular data like a spreadsheet or database. Then the csv file is converted to arff file. A standard way of representing datasets that consists of independent, unordered instances and do not involve relationships among instances, called an ARFF file. The conversion of dataset to csv and arff format is for clustering in weka.
Fig-1: Dataset for missing data imputation. The missing data fields are represented with “-1”.
3.4 Map-Reduce
Map-Reduce parallelization consist a Map-Reduce framework ensures efficient storage of dataset by dividing it into a number of small files. Each node performs a map calculation and the results are stored. A reduce mechanism minimize the data by representing tuple index and attribute. The position of missing data from the table is identified. The missing data is represented as row and column in another table. Then compute the attribute combination from the input table, attribute combination is the associated value of missing data. That means the value of the other sensors generated at the same time of missing data. This is also stored in a table. Next compute all the possible value for the missing data. The possible value is the filled data in the same column of the missing data. This will reduce the time to compute the value for finding missing data every time. These operations are done by admin.
3.5 Missing data imputation
[image:3.595.319.553.66.220.2]© 2019, IRJET | Impact Factor value: 7.211 | ISO 9001:2008 Certified Journal
| Page 5167
Fig-2: Attribute combination for all missing values.
Similarly finding all the attribute combination for every missing value and store it in a table. Stage 3 find each possible value associate with the missing data. In this stage counts the number of attribute value combinations
The stage 1 to stage 3 will performed in previous modules. Stage 4 find the probability value for each possible value this will stored in a table. The possible value with maximum probability is taken as the value for imputation. Equation for probability is:
The module calculates the probability P(p)of the possible values of the missing values p in each missing tuple from the complete data tuple. In the above formula K() represents the count and K(p )denotes the possible value of the missing value p the number of occurrences of the same missing location in each data tuple, and m denotes the number of data tuples.
If more than one value has same probability, at this time the attribute combination also considered. For example if two possible values has same probability then take their combination attribute. The possible value that has highest repeated attribute combination is taken as the value for imputation. Stage 5 missing data is updated by imputed data.
Fig-3: Imputed dataset.
3.6 Evaluation
Last module is evaluation which finds the accuracy of imputed dataset. The evaluation is performed using clustering algorithm DBSCAN. Apply K-Means clustering algorithm in the imputed and non imputed dataset. Similarly apply DBSCAN in the imputed and non imputed dataset. Then computed the precision values for the imputation and non imputation. The precision value is computed by comparing the clustering result of K-Means and DBSCAN. The equation for precision is given:
The TP (True Positive) value is computed if the instance in one cluster is changed to another. Otherwise the value became FP (False Positive). A TP decision assigns two similar documents to the same cluster; a true negative TN decision assigns two dissimilar documents to different clusters. A cluster analysis will be performed to compare data simulations at different conditions. Then draw the graph to evaluate the imputation. Calculate the time complexity for imputed and non imputed data clustering. Find the percentage of cluster instance in each cluster of two clustering algorithms DBSCAN and K-Means. Then compare the each cluster of K-Means before imputation and K-Means after imputation. Similarly compare DBSCAN clustering. The clustering analysis shows that the instance allocation in cluster before and after imputation is different.
4. RESULTS AND ANALYSIS
The experimental results of the missing data imputation based on probability. The system that uses the operating system for windows 7 and windows platforms here is c# .net. And the database created is a SQL server. The proposed system uses real time data. The proposed system runs a missing data database on real time data.
© 2019, IRJET | Impact Factor value: 7.211 | ISO 9001:2008 Certified Journal
| Page 5168
The proposed system is implemented using six modules. The dataset used for the missing data is real time dataset. This system uses numerical data. This is generated by creating an application. Here the simulated data are comes as the output of set of sensors. Each sensor bounded with a range of values. The input dataset contains missing data. Here the imputation is performed based on the available data in the input dataset. A probability based method is used for missing data imputation. The imputation steps are considered as different modules. After the completion of six modules get a filled dataset. Then the analysis of the imputation is performed using clustering. The result of imputed dataset and the missing dataset is given to two clustering algorithms DBSCAN and K-Means. These two algorithms cluster the data in the datasets. The analysis shows that cluster instances changes cluster group before imputation and after imputation. Then compute the precision values for both the clustering algorithms.
ANALYSIS: This system shows imputation system in data mining. The imputation is performed using the available data in the dataset and by using a probability based method. Then an analysis is performed using clustering algorithms. The two clustering algorithms used are K-Means and DBSCAN.
Analysis: Algorithm analysis against non imputed data
The dataset before the imputation is converted to csv and arff for clustering. Clustering algorithms K-Means and DBSCAN make clusters for the non imputed data. Both the clustering algorithms generate ten clusters of the data. The cluster assignment for the two algorithms is different. Each cluster has different percentage of instances. Cluster assignments for both the algorithms are somewhat similar.
Fig-4: Clustering algorithms against non-imputed data.
Analysis: Algorithm analysis against imputed data
This analysis is similar to the clustering analysis against imputed data. The dataset after the imputation is converted to csv and arff for clustering. Clustering algorithms K-Means
and DBSCAN make clusters for the imputed data. Both the clustering algorithms generate ten clusters of the data. The cluster assignment for the two algorithms is different. Each cluster has different percentage of instances. Cluster assignments for both the algorithms are somewhat similar.
Fig-5: Clustering algorithms against imputed data.
5. CONCLUSION AND FUTURE WORK
The proposed system is a probability based missing data imputation system. The main goal of this system is to fill missing data fields in a dataset and analyze the imputed dataset using clustering algorithm DBSCAN and K-Means. Proposed system introduced probability based imputation. It will impute missing data using possible value with highest probability. DBSCAN and K-Means clustering algorithm is used to compare the imputed and non imputed datasets. This system also opens new possibilities for future work, including:
1. Generate a system for text data imputation. 2. To introduce another method for imputation.
REFERENCES
[1] X. Xu, W. Chong, S. Li, A. Arabo and J. Xiao, “MIAEC:
Missing Data Imputation Based on the Evidence Chain,” Science, vol. 6, 2018, pp. 12983-12992.
[2] Shylaja B and Dr. R. Saravana Kumar, “Traditional versus
modern missing data handling techniques: an overview,” International Journal of Pure and Applied Mathematics, 2018, Volume 118, No. 14.
[3] T. Le, T. Altman and K. J. Gardiner, “Probability-based
Imputation Method for Fuzzy Cluster Analysis of Gene Expression Microarray Data,” in Ninth International Conference on Information Technology - New Generations, 2012, pp. 42-47.
[4] Weiqing Yu, Wendong Zhu, Guangyi Liu, Bowen Kan, San
© 2019, IRJET | Impact Factor value: 7.211 | ISO 9001:2008 Certified Journal
| Page 5169
and Communications, 2017, DOI 10.1109/BIGCOM.2017.48.
BIOGRAPHIES
Anaswara R, she is currently pursing Master’s Degree in Computer Science and Engineering from Sree Buddha college of Engineering, Elavumthitta, India. Her research area of interest includes the field Data mining.