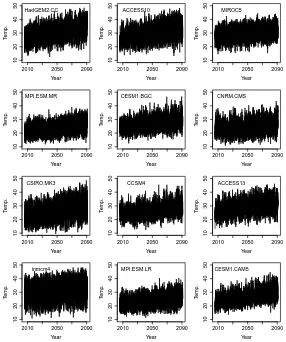
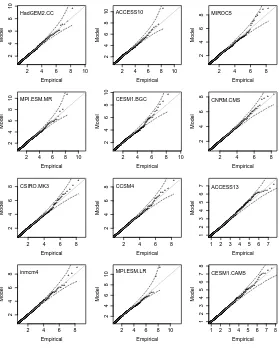
Characterising the changing behaviour of heatwaves with climate change
Full text
Figure


Related documents
Citrix EdgeSight 2.5 training is available through selected Citrix Certified Instructors as part of a combined EdgeSight for Load Testing, EdgeSight for Presentation Server
Effective demand building requires effort throughout the supply chain – from the farm, mill, brand, retailer to consumer. PRESENTATION TITLE | PAGE PRESENTATION TITLE |
Although formal hunting status is found significant when individually entered, the variation it explains is not significant enough (or unique enough) to be included in the
RGDP refers to euro area GDP growth, HICP refers to consumer prices inflation, KRIP refers to relative monetary policy rates for the euro area and the US as of Krippner (2013), FX
Consequently, due to the commonality of values shared by the right to communicate and Web 2.0 -- interactive communication, user participation, collaboration -- Web 2.0
Rather than focusing exclusively on incentives and expectations about the base rate of errors, the field interview study examines payoffs of error detection more broadly by
In theory, FRET is a radiationless energy transfer process, so ideally, a single emission spectrum of the output fluorophore should be observed, as illustrated in Fig.2.7
