warwick.ac.uk/lib-publications
Manuscript version: Author’s Accepted Manuscript
The version presented in WRAP is the author’s accepted manuscript and may differ from the
published version or Version of Record.
Persistent WRAP URL:
http://wrap.warwick.ac.uk/130173
How to cite:
Please refer to published version for the most recent bibliographic citation information.
If a published version is known of, the repository item page linked to above, will contain
details on accessing it.
Copyright and reuse:
The Warwick Research Archive Portal (WRAP) makes this work by researchers of the
University of Warwick available open access under the following conditions.
Copyright © and all moral rights to the version of the paper presented here belong to the
individual author(s) and/or other copyright owners. To the extent reasonable and
practicable the material made available in WRAP has been checked for eligibility before
being made available.
Copies of full items can be used for personal research or study, educational, or not-for-profit
purposes without prior permission or charge. Provided that the authors, title and full
bibliographic details are credited, a hyperlink and/or URL is given for the original metadata
page and the content is not changed in any way.
Publisher’s statement:
Please refer to the repository item page, publisher’s statement section, for further
information.
Shallow Feature Based Dense Attention Network for Crowd Counting
Yunqi Miao,
1Zijia Lin,
2Guiguang Ding,
3Jungong Han
1∗1University of Warwick, Coventry, UK 2Microsoft Research, Beijing, China 3Tsinghua University, Beijing, China 1{Yunqi.Miao.1, Jungong.Han}@warwick.ac.uk
2[email protected] 3[email protected]
Abstract
While the performance of crowd counting via deep learning has been improved dramatically in the recent years, it re-mains an ingrained problem due to cluttered backgrounds and varying scales of people within an image. In this paper, we propose aShallow feature based DenseAttentionNetwork (SDANet) for crowd counting from still images, which dimin-ishes the impact of backgrounds via involving a shallow fea-ture based attention model, and meanwhile, capfea-tures multi-scale information via densely connecting hierarchical image features. Specifically, inspired by the observation that back-grounds and human crowds generally have noticeably differ-ent responses in shallow features, we decide to build our at-tention model upon shallow-feature maps, which results in accurate background-pixel detection. Moreover, considering that the most representative features of people across differ-ent scales can appear in differdiffer-ent layers of a feature extraction network, to better keep them all, we propose to densely con-nect hierarchical image features of different layers and sub-sequently encode them for estimating crowd density. Exper-imental results on three benchmark datasets clearly demon-strate the superiority of SDANet when dealing with differ-ent scenarios. Particularly, on the challenging UCF CC 50 dataset, our method outperforms other existing methods by a large margin, as is evident from a remarkable 11.9%Mean Absolute Error (MAE) drop of our SDANet.
Introduction
Crowd counting aims to count the number of people by means of estimating the density distribution of the crowd in a single image. It is a very useful computer vision tech-nique to facilitate a variety of applications, including crowd control, disaster management and public safety monitoring. However, it is not a trivial task due to great challenges in real-world situations caused by cluttered backgrounds and non-uniform people scale within an image.
Tremendous algorithms (Zhang et al. 2016; Li, Zhang, and Chen 2018; Jiang et al. 2019) have been proposed in the literature for estimating the crowd density distribution. The majority of them focused on addressing two problems when
∗
Corresponding Author
Copyright c2020, Association for the Advancement of Artificial Intelligence (www.aaai.org). All rights reserved.
[image:2.612.325.558.233.304.2](a) Background noise (b) Scale variation
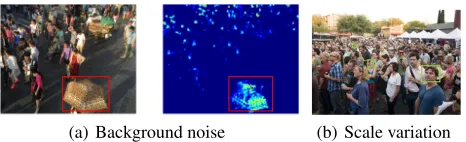
Figure 1: Illustrations of the problems of cluttered back-grounds and varying scales of people. In (a), the right picture depicts the estimated density map of the left image, where backgrounds like the umbrella (in red box) could be mis-takenly regarded as people in the density map and thus de-crease the estimation accuracy. In (b), sizes of human heads (in green boxes) vary greatly within the image due to their different distances from the camera.
learning the mappings from image features to density dis-tribution maps,i.e., 1) how to eliminate the impacts of clut-tered backgrounds, and 2) how to deal with varying scales of people within an image. Figure 1 illustrates both mentioned problems. Specifically, in Figure 1(a), the right picture de-picts the estimated density map of the left image, derived by the MCNN model (Zhang et al. 2016). It can be noticed that backgrounds,e.g., umbrellas, could be mistakenly regarded as people on the density map, thus decreasing the estimation accuracy. Meanwhile, as illustrated in Figure 1(b), sizes of human heads can vary greatly within an image, because of their different distances from the camera.
By exploring the relationship between images and their corresponding normalized shallow feature maps generated by several baselines (Zhang et al. 2016; Boominathan, Kruthiventi, and Babu 2016; Li, Zhang, and Chen 2018) (Figure 2), we observe, for the first time, that backgrounds like stairs, trees and buildings, tend to have significantly dif-ferent responses from those of the human crowds. For exam-ple, the backgrounds have stronger responses in Figure 2(a) but weaker ones in Figure 2(b), whereas human crowds’ re-actions are opposite (weaker responses in Figure 2(a) but stronger ones in Figure 2(b)). This tells us that backgrounds and human crowds are more separable on shallow-layer fea-ture maps. An attention model based on shallow feafea-tures has potential to generate more accurate attention maps. There-fore, instead of involving a sophisticated standalone atten-tion model as previous works, we incorporate an attenatten-tion module in our feature extraction networks, which effectively reuses the shallow features and enjoys less complex struc-tures to diminish background noises.
Regarding the problem of varying scales of people within an image, some works (Zhang et al. 2016; Deb and Ven-tura 2018) adopted “multi-column” frameworks to extract multi-scale information from images, where each branch ex-tracts features of a specific scale by adopting filters with a certain size. Others exploit some convolutional operations, like dilated (Li, Zhang, and Chen 2018; Deb and Ventura 2018) and deformable convolution kernels (Liu et al. 2019; Zou et al. 2018), to capture multi-scale information by panding the receptive field of filters. Yet most of them ex-tracted features layer by layer, and thus the features of the current layer may lose information of features in some pre-ceding layers.
Actually, the most representative features of people across different scales can appear in different layers of the feature extraction networks. For example, the most representative features of people in a smaller scale can probably be ex-tracted in an earlier layer, while those of people in a larger scale can be extracted in a later layer. Thus, it is vital to keep information of features in all different layers. There-fore, densely-connected structure that enables each layer to process features from all preceding layers seems like an ap-propriate structure, on which features corresponding to all scales can be well preserved and better encoded to facilitate the estimation of the crowd density.
Based on the observations above, we propose a new method for crowd counting, termedShallow feature based
DenseAttention Network (SDANet). SDANet consists of three components,i.e., low-level feature extractor, high-level feature encoder, and attention map generator. As mentioned above, the attention map generator reduces the noises caused by backgrounds via re-weighing specific regions with atten-tion maps generated with shallow features. Moreover, multi-scale information is well preserved via densely connecting the features of different layers in the high-level feature en-coder. Extensive experiments on benchmark datasets also clearly demonstrate the superiority of SDANet.
Contributions of our work are summarized as follows: • We observe, for the first time, that shallow features
con-tain distinguishable information between backgrounds
(a)
[image:3.612.339.541.53.236.2](b)
Figure 2: Images and their corresponding shallow feature maps from several baselines. The shallow feature maps are linearly normalized to [0,255] by their maximums, which are shown as heat maps. It can be seen that the backgrounds and the human crowds have significantly different responses in (a) and (b).
and human crowds, which allows us to utilize a lightweight network to generate even more accurate at-tention maps.
• We propose to employ densely connected structures in feature extraction/encoding networks, such that multi-scale information in different layers can be well kept to facilitate the estimation of the crowd density.
• We propose a novel crowd counting method termed SDANet. And experiments conducted on three bench-mark datasets show that SDANet achieves the state-of-the-art performance for crowd counting.
Related Works
Over the last few years, researchers have attempted to ad-dress the issue of crowd counting by density estimation with a variety of approaches (Sindagi and Patel 2018), where a mapping from image features to crowd density is learned and then the counted number is the summation over an es-timated density map. Existing density estimation methods can be generally categorized as hand-crafted feature based ones and deep feature based ones, where latter ones tend to incorporate attention mechanism recently.
Hand-Crafted Feature based Methods
!"
!#$ !#%
!&''
⊗
!)$ !)% !*+,
-./
0&'' 01&2
0344
5 .-6
(a) SDANet
High-level Feature Encoder
⊕ "#$
"%& "%' "%(
"#$)&
(b) HFE
!"## Attention Map Module
!$%
(c) AMG
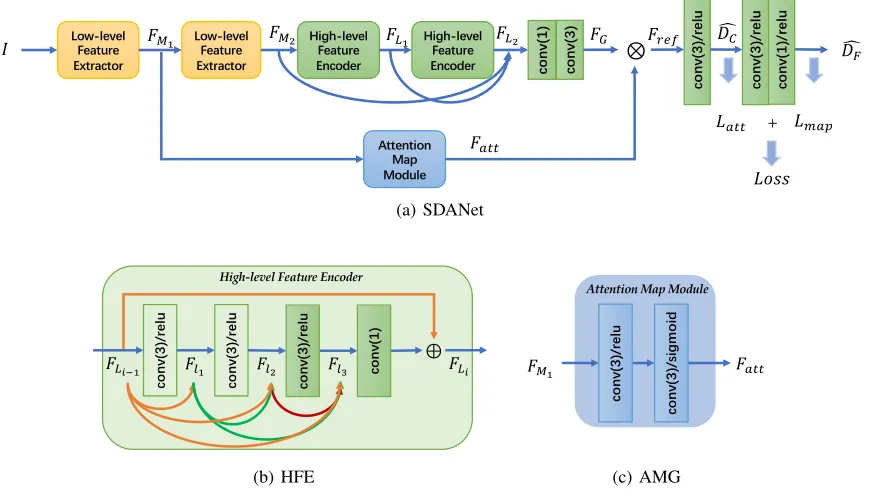
Figure 3: (a) The architecture of SDANet. (b) The architecture of HFE. (c) The architecture of AMG.
and crowd counting with a relatively sparse density. Idresset al.(Idrees et al. 2013) explored features from three sources,
i.e., Fourier, interest points and head detection combined with their respective confidences to get counts at localized patches and adopted a Markov Random Field (MRF) frame-work to obtain an estimated count for the entire image.
Deep Feature based Methods
Inspired by the huge success of convolutional neu-ral networks (CNN) in image classification (Krizhevsky, Sutskever, and Hinton 2012), recently deep features have been leveraged for density estimation. Owing to their su-perior performance, deep learning based methods (Wang et al. 2015; Zhang et al. 2016; Deb and Ventura 2018; Li, Zhang, and Chen 2018; Hossain et al. 2019) quickly dominate the research in crowd counting.
Zhanget al.(Zhang et al. 2016) proposed a multi-column based architecture (MCNN), where each column adopts a fil-ter with a certain size to extract features of the corresponding scale. Instead of training all patches with the same paralleled network, Samet al.(Sam, Surya, and Babu 2017) proposed a switching CNN that adaptively selects the optimal branch for an image patch according to its density. A classifier in-dicating patch density is trained beforehand and empowers density estimation networks by providing prior knowledge. Recently, dilated kernels have also been involved in multi-column frameworks to further deliver larger reception fields (Li, Zhang, and Chen 2018).
Attention mechanism in crowd counting Recently,
at-tention mechanism is widely incorporated to enhance the crowd counting performance. The idea is to roughly
ap-proximate the regions in the image where people are likely appeared. To do so, an attention model is learned to as-sign larger weights to pixels/regions of being human crowds. (Liu et al. 2018; Kang and Chan 2018; Hossain et al. 2019; Liu et al. 2019; Zhu et al. 2019).
ADCrowdNet (Liu et al. 2019) employs an attention map generator trained on additional negative samples and then applies it to detect crowd regions in the images. Hossain
et al.(Hossain et al. 2019) proposed a Scale-Aware Atten-tion Networks (SAAN), which utilizes attenAtten-tion mechanism to re-weigh multi-scale features learned by multi-columns. SFANet (Zhu et al. 2019) generates an attention map with the same size of the image by an additional CNN branch, where each pixel indicates its probability of being the head. Alternatively, DecideNet (Liu et al. 2018) uses a learned at-tention map to combine the two maps generated by the re-gression branch and the detection branch.
[image:4.612.86.521.61.308.2]1×1
3×3 5×5 7×7
[image:5.612.64.281.59.150.2]1×1 1×1 1×1
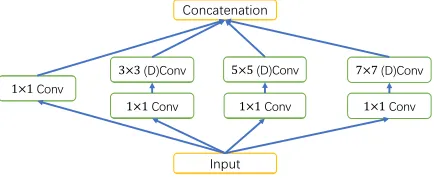
Figure 4: The architecture of the second module of LFE.
(D)Convrepresents the convolution layer with dilated
ker-nels.
Our Approach
The framework of SDANet is illustrated schematically in Figure 3(a), which mainly consists of three components: Low-level Feature Extractor (LFE), High-level Feature En-coder (HFE), and Attention Map Generator (AMG).
Low-level Feature Extractor (LFE)
Most existing methods use separate branches with different size filters to extract multi-scale information from images, which may introduce redundant structures into the pipeline (Li, Zhang, and Chen 2018). Inspired by the success of SANet (Cao et al. 2018) in feature extraction, the Inception module (Szegedy et al. 2015), a tool to process visual in-formation of various scales, is used as the shallow feature extractor of SDANet.
Specifically, LFE consist of two feature extractor blocks and each of them contains four branches with filter sizes of
1×1,3×3,5×5, and 7×7 respectively, as shown in Figure 4. Each branch focuses on a certain scale and gener-ates the same number of feature maps. To further enhance model’s capability to capture multiple scales information, dilated convolution, which can enlarge the receptive field without involving extra computations, is employed in the second block. Additionally, expect for the1×1branch, there is an extra1×1filter added before the other three branches to reduce the feature channels by half. Moreover, ReLU ac-tivate function is applied after each convolution layer in LFE to avoid negative values.
As a departure from most of works, we remove the pool-ing layers between the inception modules to avoid the reduc-tion in spatial resolureduc-tion caused by the pooling operareduc-tion and the additional complexity brought by subsequent deconvo-lutional layers. Considering the trade-off between resource consumption and model accuracy, we instead adopt dilated filters with the dilated rate of 2 to replace the pooling layer (Chen et al. 2018). Features from different branches, cover-ing multi-scale appearance of people in images, are subse-quently concatenated together for the feature encoding.
High-level Feature Encoder (HFE)
The structure of HFE is shown in Figure 3(b), which takes shallow features extracted from the second block of LFE as input. While encoding features, such a structure can well preserve multi-scale information.
HFE is compose of two blocks, where each block consists of three convolution layers with the filter size of3×3 fol-lowed by a ReLU activate function. Particularly, the input of a specific convolution layer Flj(j = 1,2,3) is the
con-catenation of all outputs from preceding layers,i.e.,Flj = concat(F1, ..., Flj−1), which are indicated by different
col-ors in the figure. The dense connection between layers en-sures that multi-scale information in the shallow features can be preserved. At the bottom of each block, a1×1 convolu-tion layer is applied to integrate the concatenated hierarchi-cal features and reduce feature channels to the same dimen-sion as the input, which is indicated byConv1×1. Therefore,
the output of thei-th block in HFEFLican be obtained by, FLi=FLi−1+Conv1×1[concat(Fl1, Fl2, Fl3)]. (1)
Finally, the input of each block is added onto the output, which will in turn become the input of the next block.
On top of that, to further preserve multi-scale informa-tion, shallow features obtained by low-level feature extrac-tor (FM2) and the output of each block in HFE (FLi) are
concatenated together, which isFg in Eq. (2), as the input
for the feature integration in global level. In the integration, a1×1and a3×3convolution layer are employed to inte-grate high-level features in a global level, which is indicated byGin Eq. (2). Henceforth, the output of HFE can be cal-culated by,
FG=G(Fg). (2)
Rather than widening the network, the proposed densely connected structure takes full advantage of features from all layers and well preserves the scale information in shallow features, which efficiently eliminates the problem of scale variation. In the paper, the dimension of FM2 andFG are
both set to 64 according to the extensive experiments, which is less than most of the state-of-the-art methods.
Attention Map Generator (AMG)
In light of the observation that backgrounds on shallow feature maps tend to have significantly different responses, compared to the crowds, we generate attention maps based on low-level features only. Specifically, AMG takes shallow features from the first block of LFE (FM1) as input and
gen-erates pixel-wise attention maps (Fatt) on which crowd
re-gions are always ”brighter” than the backgrounds,i.e.,
Fatt=AM G(FM1). (3)
Here, two convolution layers followed by a sigmoid func-tion, as shown in Figure 3(c), are used to ensure that all the computed weights are within the range of 0 to 1.Latt,
the summation of pixel-wise Euclidean distance between re-fined feature mapsFref and ground-truth density mapD,
conveys the supervision information to the learning pro-cess of the attention module. Subsequently, the attention mapFattis employed to refine the encoded featureFG by
element-wise multiply(⊗)as follows,
Fref =FG⊗Fatt, (4)
whereFref is taken as the input of the last two convolution
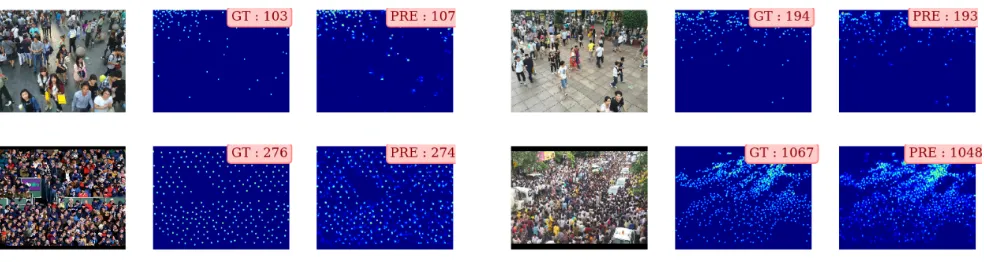
Figure 5: Qualitative results on ShanghaiTech Dataset. For each group of images, pictures in the middle and on the right are corresponding ground truth and estimated density map of the image on the left, where the number on the top right corner indicates the ground truth (GT) and the estimated number of people (PRE) respectively. It can be seen that SDANet has a strong adaptability to different density levels with a error less than 4%.
Table 1: Comparison results of different methods on the UCF CC 50 dataset.
Method MAE MSE
FHSc+MRF 468.0 590.3
MCNN 377.6 509.1
Switching-CNN 318.1 439.2 SANet (Cao et al. 2018) 258.4 334.9 CSRNet (Li, Zhang, and Chen 2018) 266.1 397.5 SAAN (Hossain et al. 2019) 271.6 391.0 SDANet (ours) 227.6 316.4
Loss Function
The density maps generator in the SDANet adopts a coarse-to-fine strategy. Concretely, the loss is composed of two terms:LattandLmapin the Figure 3(a) respectively.
Firstly, a convolution layer with the filter size of3×3
is employed to learn a coarse mapping between combined feature maps (Fref) from the HFE and AMG to the density
maps, and meanwhile, prepare coarse density maps for fur-ther process. In order to supervise the learning process of attention maps and the generation of coarse density maps,
Latt, measuring the Euclidean distance between coarse
den-sity maps (DˆC) and the ground-truth density map D, is
adopted. Explicitly,Lattis defined as,
Latt= 1 M
X
M
||DˆC−D||22, (5)
whereM is the dimension ofDˆC, and is set to 32 throughout
all experiments.
Subsequently, two convolution layers with filter sizes of
3×3and1×1are involved to further refine the quality of coarse density map, thus enhancing the accuracy of crowd counting. Noticeably, the ReLU activation function is em-ployed after convolution layers to avoid appearance of neg-ative values. Last,Lmap is introduced to supervise the
re-finement process and generate the fine-grained density map (DˆF). Concretely,Lmapis composed by an Euclidean loss
(LE) and a Counting loss (LC), which are somewhat
com-plementary to each other. Initially,LEis adopted to improve
the quality of density map by minimizing the Euclidean dis-tance between the fine-grained density map and the ground-truth, which can be described by,
LE= 1 N
N X
i=1 ||DˆF
i−Di||
2
2, (6)
whereDˆFi andDi are estimated density map and ground
truth of thei-th imageIi, respectively, andN refers to the
number of training samples. However, sharp edges and out-liers in coarse density maps might be blurry in fine-grained maps. To remedy this situation,LCis added as a
compensa-tion, which is defined by,
LC= 1 N
N X
i=1
(Ci− ˆ Ci Ci+
)2, (7)
whereCˆiandCirepresent, respectively, the estimated
num-ber of people and the ground truth of thei-th training sam-ple, which are the integral over all pixels p on the cor-responding density map, i.e.,Ci = PpDi. Additionally, = 0.0001is set to avoid the denominator being zero.LC
not only accelerates the convergence process but improves the counting accuracy. In summary,Lmapis expressed as,
Lmap=LE+αLC, (8)
whereα= 0.01is the empirical weight forLC.
Therefore, the overall loss of SDANet is,
Loss=Latt+Lmap. (9)
Adam (Kingma and Ba 2014) algorithm with the initial learning rate of 1e-4 is adopted to optimize the SDANet.
Experiments
Evaluation Metrics
algo-Table 2: Comparison results of different methods on 5 scenes (S1∼S5) in the WorldExpo010 dataset in terms of MAE.
Method S1 S2 S3 S4 S5 Average
Cross-scene (Zhang et al. 2015) 9.8 14.1 14.3 22.2 3.7 12.9 MCNN (Zhang et al. 2016) 3.4 20.6 12.9 13.0 8.1 11.6 Switching-CNN (Sam, Surya, and Babu 2017) 4.4 15.7 10.0 11.0 5.9 9.4
SANet (Cao et al. 2018) 2.6 13.2 9.0 13.3 3.0 8.2 CSRNet (Li, Zhang, and Chen 2018) 2.9 11.5 8.6 16.6 3.4 8.6 SaCNN (Zhang, Shi, and Chen 2018) 2.6 13.5 10.6 12.5 3.3 8.5 SDANet (ours) 2.0 14.3 12.5 9.5 2.5 8.1
rithm evaluation, which are defined as:
M AE = 1
N N X
i=1
Ci−
ˆ Ci
, (10)
M SE=
v u u t 1 N
N X
i=1
Ci−Cˆi
2
, (11)
whereN represents the total number of images involved in testing,CiandCˆiare the ground truth and estimated number
of people for thei-th image respectively.
Datasets
In the experiment, three crowd counting benchmark datasets, the UCF CC 50 dataset, the WorldExpo010 dataset, and the ShanghaiTech dataset, are used to evaluate the per-formance of SDANet, each being elaborated below.
UCF CC 50 dataset (Idrees et al. 2013) contains 50
im-ages with various perspectives and resolutions. The number of annotated people per image ranges from 94 to 4543 with an average number of 1280, which is a challenging dataset in the field of crowd counting.
WorldExpo010 dataset (Zhang et al. 2015) consists of
3980 annotated frames from 1132 video sequences captured by 108 different surveillance cameras, which is divided into a training set (3380 frames) and a test set (600 frames). The region of interest (ROI) is also provided for the whole dataset.
ShanghaiTech dataset (Zhang et al. 2016) consists of
1198 annotated images with a total amount of 330,165 an-notated people. The dataset contains two parts: Part A and Part B. Part A includes 482 internet images with highly con-gested scenes while Part B includes 716 images with rela-tively sparse crowd scenes taken from streets in Shanghai.
Experiment Settings
Taking the computation cost and data variety into account, we adopted the patch-wise training strategy. Following the previous work (Zhang et al. 2016), 9 patches, where each patch is1/4 of the image size, are cropped from each im-age to generate the training set. The first four patches con-tain four quarters of the image without overlapping while the other five patches are randomly cropped from the image. During the test, non-overlapping patches are cropped from
each image in the test set and compute individually. The final density map of the image is the concatenation of its patches predictions. Additionally, images are further augmented by randomly horizontal flipping.
Besides, we generated the ground-truth from head annota-tions given by datasets (Zhang et al. 2016). Each head anno-tation is blurred with a Gaussian kernel, whose summation is normalized to one and the number of people is the integral over the density map.
The implementation of SDANet is based on the PyTorch framework. As we train the whole network from scratch, all parameters are randomly initialized by Gaussian distribution with mean of zero and standard deviation of 0.01.
Results and Analysis
On each dataset, we follow the standard protocol to generate ground truth and compare our method with the state-of-the-art algorithms. Furthermore, we conduct extensive ablation experiments on the WorldExpo010 dataset to analyze the ef-fects of different components in SDANet. We explain exper-imental settings and show results as follows.
Experimental Evaluations
Quantitative results On theUCF CC 50dataset, we
per-formed a 5-fold cross-validation to evaluate the proposed method as suggested by (Idrees et al. 2013). Table. 1 shows the comparison of the results of our method with contem-porary state-of-the-art works on UCF CC 50 dataset, which illustrates the proposed SDANet is able to deal with crowd scenes with varying densities and achieves a superior per-formance over other approaches. Specifically, our method achieves 11.91% MAE reduction and 5.52% MSE reduc-tion. This clearly demonstrates that SDANet is super robust against the scale and density changes.
The comparison results of SDANet with contemporary state-of-the-art work on the 5 scenes (S1∼S5) in the test set
ofWorldExpo010dataset are shown in Table. 2. The
chal-lenging test set is a combination of different densities, rang-ing from sparse to dense, and various backgrounds includ-ing squares, stations,etc. From the result, it can be seen that the proposed SDANet scores the best in Scene1, Scene4 and Scene5 as well as the best accuracy on average, which again proves the strong adaptability of SDANet against different scenarios with varying density levels.
[image:7.612.110.289.206.276.2]Table 3: Comparison results of different methods on the ShanghaiTech dataset.
Method Part A Part B
MAE MSE MAE MSE
Cross-scene 181.8 277.7 32.0 49.8
MCNN 110.2 173.2 26.4 41.3
Switching-CNN 90.4 135.0 21.6 33.4 CP-CNN (Sindagi and Patel 2017) 73.6 106.4 20.1 30.1 DecideNet (Liu et al. 2018) - - 21.5 32.0 ACSCP (Shen et al. 2018) 75.7 102.7 17.2 27.4
CSRNet 68.2 115.0 10.6 16.0
SANet 67.0 104.5 8.4 13.6
TEDnet (Jiang et al. 2019) 64.2 109.1 8.2 12.8 SDANet (ours) 63.6 101.8 7.8 10.2
Table 4: Ablation study results on the WorldExpo010 dataset.
Models MAE MSE
SDANet without AMG 12.89 15.28 SDANet without Dense Structure 10.14 13.25 SDANet without Refinement 9.64 13.19
SDANet 8.10 12.90
MAE and MSE as well. Specifically, our approach outper-forms the latest work TEDnet by 4.87%and 20.31% over the MAE and MSE metric respectively on the ShanghaiTech Part B dataset.
Visualization results We firstly analyzed the attention
maps generated by AMG and obtained some statistical re-sults. Taking the attention map of Figure 2(a) as an example, the average attention value of crowd region (center-right) is 0.874 (GT=1) while that for background region (left corner) is 0.253 (GT=0), which proves that the attention maps re-duce the background noise by arranging background regions with relatively low weights.
To demonstrate the performance of SDANet on scenes with cluttered backgrounds and varying head sizes, we choose, in particular, the ShanghaiTech dataset for estimated density maps visualization, which are shown in Figure 5. For each group of images, pictures in the middle and on the right are corresponding ground truth and estimated density map of the image on the left, where the number on the top right cor-ner indicates the ground truth (GT) and the estimated num-ber of people (PRE) respectively. Here, we display the esti-mated density maps of various scenarios, ranging from 103 persons to 1067 persons, to demonstrate that the proposed SDANet performs decently in both dense and sparse scenes. It can be seen that SDANet has a strong adaptability to dif-ferent density levels with a error less than 4%.
Ablation Study
To validate the effectiveness of key components in the SDANet, we also conducted ablation studies on the WorldExpo010 dataset which is more realistic and challeng-ing due to the fact that all images are acquired from real surveillance scenes.
Effectiveness of AMG We explore the performance
im-provement offered by AMG by removing the attention mod-ule from the SDANet and compare it with the network with AMG. The result is indicated bySDANet without AMGin Table. 4. There are 37%increase in MAE and 15%increase in MSE if AMG is dropped out, clearly demonstrating that AMG has made a significant contribution in diminishing background noise.
Effectiveness of densely-connected structure In order to
shed light on how the densely connecting structure preserves multi-scale features, we conduct an experiment on the same dataset without the dense connection between layers and the result is indicated bySDANet without Dense Structurein Ta-ble. 4. It can be seen that the removal of the dense connection between layers leads to an over 20.1% drop in the count-ing accuracy, which means that densely-connected structure reinforces the diversity of features and improve the perfor-mance of SDANet.
Effectiveness of estimation refined layers Furthermore,
we study the refinement ability of the last two layers and the loss termLmap. We screen out the last two convolution
lay-ers in SDANet and train the network with solelyLatt, whose
result is indicated bySDANet without Refinementin Table. 4. Without the refinement layers, there is a nearly 16%decline in the MAE. Therefore, the coarse-to-fine strategy involved in the loss function can further enhance the performance of the network.
Conclusion
References
Boominathan, L.; Kruthiventi, S. S.; and Babu, R. V. 2016. Crowdnet: A deep convolutional network for dense crowd counting. InProceedings of the 2016 ACM on Multimedia Conference, 640–644. ACM.
Cao, X.; Wang, Z.; Zhao, Y.; and Su, F. 2018. Scale aggre-gation network for accurate and efficient crowd counting. In
Proceedings of the European Conference on Computer Vi-sion (ECCV), 734–750.
Chen, L.-C.; Papandreou, G.; Kokkinos, I.; Murphy, K.; and Yuille, A. L. 2018. Deeplab: Semantic image segmentation with deep convolutional nets, atrous convolution, and fully connected crfs. IEEE transactions on pattern analysis and machine intelligence40(4):834–848.
Deb, D., and Ventura, J. 2018. An aggregated multicolumn dilated convolution network for perspective-free counting. InProceedings of the IEEE Conference on Computer Vision and Pattern Recognition Workshops, 195–204.
Hossain, M.; Hosseinzadeh, M.; Chanda, O.; and Wang, Y. 2019. Crowd counting using scale-aware attention networks. In2019 IEEE Winter Conference on Applications of Com-puter Vision (WACV), 1280–1288. IEEE.
Idrees, H.; Saleemi, I.; Seibert, C.; and Shah, M. 2013. Multi-source multi-scale counting in extremely dense crowd images. InProceedings of the IEEE conference on computer vision and pattern recognition, 2547–2554.
Jiang, X.; Xiao, Z.; Zhang, B.; Zhen, X.; Cao, X.; Doer-mann, D.; and Shao, L. 2019. Crowd counting and den-sity estimation by trellis encoder-decoder network. arXiv preprint arXiv:1903.00853.
Kang, D., and Chan, A. 2018. Crowd counting by adaptively fusing predictions from an image pyramid. arXiv preprint arXiv:1805.06115.
Kingma, D. P., and Ba, J. 2014. Adam: A method for stochastic optimization.arXiv preprint arXiv:1412.6980. Krizhevsky, A.; Sutskever, I.; and Hinton, G. E. 2012. Imagenet classification with deep convolutional neural net-works. InAdvances in neural information processing sys-tems, 1097–1105.
Lempitsky, V., and Zisserman, A. 2010. Learning to count objects in images. InAdvances in neural information pro-cessing systems, 1324–1332.
Li, Y.; Zhang, X.; and Chen, D. 2018. Csrnet: Dilated convo-lutional neural networks for understanding the highly con-gested scenes. In Proceedings of the IEEE conference on computer vision and pattern recognition, 1091–1100. Liu, J.; Gao, C.; Meng, D.; and Hauptmann, A. G. 2018. Decidenet: Counting varying density crowds through atten-tion guided detecatten-tion and density estimaatten-tion. In Proceed-ings of the IEEE Conference on Computer Vision and Pat-tern Recognition, 5197–5206.
Liu, N.; Long, Y.; Zou, C.; Niu, Q.; Pan, L.; and Wu, H. 2019. Adcrowdnet: An attention-injective deformable con-volutional network for crowd understanding. In Proceed-ings of the IEEE Conference on Computer Vision and Pat-tern Recognition, 3225–3234.
Sam, D. B.; Surya, S.; and Babu, R. V. 2017. Switching convolutional neural network for crowd counting. In2017 IEEE Conference on Computer Vision and Pattern Recogni-tion (CVPR), 4031–4039. IEEE.
Shen, Z.; Xu, Y.; Ni, B.; Wang, M.; Hu, J.; and Yang, X. 2018. Crowd counting via adversarial cross-scale consis-tency pursuit. In Proceedings of the IEEE conference on computer vision and pattern recognition, 5245–5254. Sindagi, V. A., and Patel, V. M. 2017. Generating high-quality crowd density maps using contextual pyramid cnns. In Proceedings of the IEEE International Conference on Computer Vision, 1861–1870.
Sindagi, V. A., and Patel, V. M. 2018. A survey of recent ad-vances in cnn-based single image crowd counting and den-sity estimation. Pattern Recognition Letters107:3–16. Szegedy, C.; Liu, W.; Jia, Y.; Sermanet, P.; Reed, S.; Anguelov, D.; Erhan, D.; Vanhoucke, V.; and Rabinovich, A. 2015. Going deeper with convolutions. In Proceed-ings of the IEEE conference on computer vision and pattern recognition, 1–9.
Wang, C.; Zhang, H.; Yang, L.; Liu, S.; and Cao, X. 2015. Deep people counting in extremely dense crowds. In Pro-ceedings of the 23rd ACM international conference on Mul-timedia, 1299–1302. ACM.
Zhang, C.; Li, H.; Wang, X.; and Yang, X. 2015. Cross-scene crowd counting via deep convolutional neural net-works. InProceedings of the IEEE conference on computer vision and pattern recognition, 833–841.
Zhang, Y.; Zhou, D.; Chen, S.; Gao, S.; and Ma, Y. 2016. Single-image crowd counting via multi-column convolu-tional neural network. InProceedings of the IEEE confer-ence on computer vision and pattern recognition, 589–597. Zhang, L.; Shi, M.; and Chen, Q. 2018. Crowd counting via scale-adaptive convolutional neural network. In 2018 IEEE Winter Conference on Applications of Computer Vi-sion (WACV), 1113–1121. IEEE.
![Figure 2: Images and their corresponding shallow featuremaps from several baselines. The shallow feature maps arelinearly normalized to [0,255] by their maximums, whichare shown as heat maps](https://thumb-us.123doks.com/thumbv2/123dok_us/9427064.447178/3.612.339.541.53.236/figure-corresponding-featuremaps-baselines-arelinearly-normalized-maximums-whichare.webp)