© 2019, IRJET | Impact Factor value: 7.211 | ISO 9001:2008 Certified Journal | Page 2526
A Review on Plant Disease Detection using Image Processing
Tejashri jadhav
1, Neha Chavan
2, Shital jadhav
3, Vishakha Dubhele
41,2,3,4
BE Student, Dept. of Electronic & Telecommunication Engineering, Shivajirao S. Jondhle College of Engineering
& Technology, Asangaon.
---***---Abstract – Identification of plant disease is the key to preventing the losses in the yield and quantity of the agriculture
product. Detecting damaged parts in leaves succor to develop a software which will help farmers to get more amount of turn outs,it can blotch the diseases precisely. Disease decrease the productivity of plant and it also restricts the growth of plant and both quality and quantity of plant gets reduced. Hence digital image processing is used for the detection of plant diseases. Disease detection involves the steps like image acquisition, image pre-processing, image segmentation, feature extraction and it’s classification.
Key Words: HSI: Hue Saturation Intensity, SVM: Support Vector Machine, GLCM: Grey Level Co-occurrence Matrix, SGDM:
Spatial Grey Level Dependence Matrices
1. INTRODUCTION
To the significant reduction in both the India is a cultivated country and about 70% of the population depends on agriculture. Farmers have large range of diversity for selecting various suitable crops and finding the suitable pesticides for plants disease on plant leads quality and quantity of agricultural products. Due to environmental changes like huge rainfall drastic changes in temp. the crop gets infected and that can be characterized by spots on the leaf dryness of leaf, colour changes in leaf and classification.
The proposed project leaf infection detection is made through image processing technique because image from important data and information in biological science digital image processing and image analysis technology based on advance in micro electronic and computer has many applications in biology. The method for detection classification of leaf disease is based on masking and removing green pixels, applying a specific threshold extract to the infected region and computing the texture statistics to evaluate the disease using MATLAB.
Image processing technique could be applied on various applications as follows:
1. To detect plant leaf
2. To quantify affected area by diseases
3. To find the boundaries of affected area 4. To determine the colour of the affected area 5. To determine size and shape of leaf
2. DESIGN STEPS
A. Input Image:
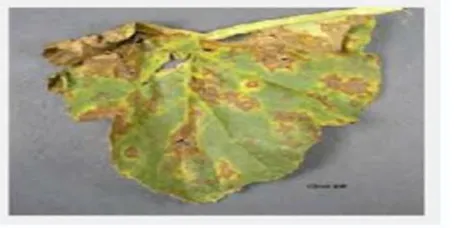
[image:1.595.190.417.638.752.2][1]In this paper used digital leaf images to identify disease. The images are taken from different online sources. There are three common rose diseases that used in this research, i.e., Black spot, Anthracnose and Rust. Figure 1 shows the disease images in JPEG format.
© 2019, IRJET | Impact Factor value: 7.211 | ISO 9001:2008 Certified Journal | Page 2527
B. Image Preprocessing: [image:2.595.196.397.151.264.2]Image pre-process tasks are the initial stage before feature extraction. There are three steps of image preprocessing, i.e., image cropping, image converting and image enhancement. In that first cropped on leaf disease area, and then converted it into grey levels. In figure 2 for image enhancement used Laplacian filter.
Figure No.2: Pre-processed image
C. Image Segmentation
[image:2.595.193.417.399.512.2]Image segmentation is one of the most important precursors for disease detection and has a crucial impact on the overall performance of the developed systems. The K-means clustering technique is a well-known approach that has been applied to solve low-level image segmentation tasks. This clustering algorithm is convergent and its aim is to optimize the partitioning decisions based on a user-defined initial set of clusters. Paper proposed k-means segmentation method to segment target areas. The area affected by the disease is the target area. Figure 3 shows the outputs from the segmentation.
Figure No.3: Segmented images
D. Feature Extraction
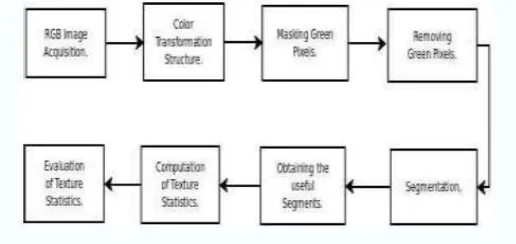
Proposed method include two features colour texture and space feature. These features are total 17 in numbers including 13 colour features and 4 shape features. Shape features including area, perimeter, circularity and complexity were extracted from the binary segmentation images. Color features and texture features were extracted from the color segmentation image. The image analysis technique is done using Color Co-occurrence Matrix (CCM).[1] block diagram show in figure 4
[image:2.595.180.438.618.740.2]© 2019, IRJET | Impact Factor value: 7.211 | ISO 9001:2008 Certified Journal | Page 2528
Color Transformation Structure:
First, the RGB images of leaves are converted into Hue Saturation Intensity (HSI) color space representation. The purpose of the colour space is to facilitate the specification of colors in some standard, generally accepted way. HSI (Hue, Saturation, Intensity) colour model is a popular color model because it is based on human perception.
Hue Color Attribute:
It refers to the dominant colors as viewed by a person. Saturation refers to the relative purity or the amount of white light added to hue and intensity
refers to the amplitude of the light. Color spaces can be converted from one space to another easily. After the transformation process, the H component is taken into account for further analysis. S and I are dropped since it doe lies not give extra information.
Masking Green Pixels:
Here, we identify mainly the green colored pixels. After this, based on specified threshold value computed for these pixels, the mostly green pixels are masked as if the green component of the pixel intensity is less than the pre computed threshold value, the red, green and blue components of this pixel is assigned to a zero value.
Segmentation:
From the above steps, the infected portion of the leaf is extracted. The infected region is then segmented into a number of patches of equal size. The size of the patch is chosen in such a way that the significant information is not lost. In this approach patch size of 32*32 is taken. The next step is to extract the useful segments. Not all segments contain significant amount of that information. So the patches which are having more than fifty percent of the information are taken into account for the further analysis.
Color Co-Occurrence Method:
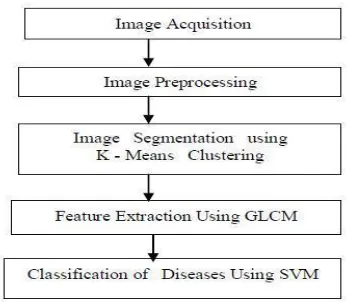
The color co-occurrence texture analysis method is developed through the Spatial Gray- level Dependence Matrices (SGDM). The gray level co-occurrence methodology is a statistical way to describe shape by statistically sampling the way certain gray- levels occur in relation to other gray levels. These matrices measure the probability that a pixel at one particular gray level will occur at a distinct distance and orientation from any pixel given that pixel has a second particular gray level. The overview of the proposed methodology is shown in Figure 5.
[image:3.595.219.393.513.664.2]3. PROPOSED SYSTEM
Figure No.5: Proposed System
A. Image Acquisition
© 2019, IRJET | Impact Factor value: 7.211 | ISO 9001:2008 Certified Journal | Page 2529
B. Image Pre-ProcessingImage pre-processing is used to enhance the quality of the image necessary for further processing and analysis. It includes color space conversion and image enhancement. The RGB images of leaves are converted into L*a*b color space. The color transformation is done to determine the luminosity and chromaticity layers. The color space conversion is used for the enhancement of visual analysis.
C. Image Segmentation
Image segmentation is the process used to simplify the representation of an image into meaningful form, such as to highlight object of interest from background. The K-means clustering algorithm performs segmentation by minimizing the sum of squares of distances between the image intensities and the cluster centroids. K-means clustering algorithm or Lloyd's Algorithm is an iterative algorithm that partitions the data and assigns n observations to precisely one of k clusters defined by centroids.
The steps in the algorithm are given below.
1. Choose k initial cluster centers (centroid).
2. Compute point-to-cluster-centroid distances of all observations to each centroid. 3. Assign each observation to the cluster with the closest centroid.
4. Compute the mean of the observations in each cluster to obtain k new centroid locations.
5. Repeat steps 2 through 4 until there is no change in the cluster assignments or the maximum number of iterations is reached.
D. Feature Extraction
After segmentation, the GLCM features are extracted from the image. Gray-Level Co-Occurrence Matrix (GLCM) is the statistical method of investigating texture which considers the spatial relationship of pixels. The GLCM functions characterize the texture of images by computing the spatial relationship among the pixels in the images. The statistical measures are extracted from this matrix. In the creation of GLCMs, an array of offsets which describe pixel relationships of varying direction and distance have to be specified
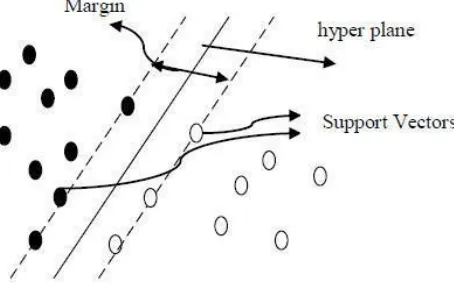
[image:4.595.177.404.464.607.2]E. Classification using Support Vector Machine (SVM)
Figure No.6: Support Vector Machine Classifier
© 2019, IRJET | Impact Factor value: 7.211 | ISO 9001:2008 Certified Journal | Page 2530
4. CONCLUSIONS
1. A method for detection and classification of leaf diseases is implemented. The segmentation of the diseased part is done using K-Means algorithm.
2. Then, GLCM (grey level co-occurrence matrix) texture features are extracted and classification is done using SVM (support vector machines).
3. The method is tested for detection of diseases in citrus leaves. Future work is to be carried out for classification of diseases in different plant species and to improve the classification accuracy.
REFERENCES
1. R. Meena Prakash, “Detection of Leaf Diseases and Classification using Digital Image Processing”, ICIIECS, 2017.
2. Miss. Amruta Ambatkar, “Leaf Disease Detection using Image Processing”, ICRTEST 2017, 3. Volume 5, Issue 1.
4. Varsha sawarkar, " A Review: Rose Plant Disease Detection Using Image processing" , IOSR-JCE, 2018.