Original citation:
Vetrini, Damir, Kiire, Christine A., Burgess, Philip I. , Harding, Simon P., Kayange, Petros C., Kalua, Khumbo, Msukwa, Gerald, Beare, Nicholas A. V. and Madan, Jason (2018) Incremental cost-effectiveness of screening and laser treatment for diabetic retinopathy and macular edema in Malawi. PLoS One, 13 (1). e0190742. doi:10.1371/journal.pone.0190742
Permanent WRAP URL:
http://wrap.warwick.ac.uk/101474
Copyright and reuse:
The Warwick Research Archive Portal (WRAP) makes this work of researchers of the University of Warwick available open access under the following conditions.
This article is made available under the Creative Commons Attribution 4.0 International license (CC BY 4.0) and may be reused according to the conditions of the license. For more details see: http://creativecommons.org/licenses/by/4.0/
A note on versions:
The version presented in WRAP is the published version, or, version of record, and may be cited as it appears here.
Incremental cost-effectiveness of screening
and laser treatment for diabetic retinopathy
and macular edema in Malawi
Damir Vetrini1*, Christine A. Kiire2,3, Philip I. Burgess3,4, Simon P. Harding3,5, Petros C. Kayange6, Khumbo Kalua6,7, Gerald Msukwa7, Nicholas A. V. Beare3,5, Jason Madan8
1 SDA Bocconi School of Management, Bocconi University, Milan, Italy, 2 Oxford Eye Hospital, John
Radcliffe Hospital, Oxford University Hospitals NHS Foundation Trust, Oxford, United Kingdom,
3 Department of Eye and Vision Science, Institute of Ageing and Chronic Disease, University of Liverpool,
Liverpool, United Kingdom, 4 Malawi Liverpool Wellcome Trust Clinical Research Programme, Queen Elizabeth Central Hospital, Blantyre, Malawi, 5 St. Paul’s Eye Unit, Royal Liverpool University Hospital, Liverpool, United Kingdom, 6 College of Medicine, University of Malawi, Blantyre, Malawi, 7 Lions Sight First Eye Hospital, Blantyre, Malawi, 8 Centre for Applied Health Research and Delivery, Division of Health Sciences, Warwick Medical School, Coventry, United Kingdom
*Damir.Vetrini@gmail.com
Abstract
Objective
To investigate the economic impact of introducing targeted screening and laser photocoagu-lation treatment for sight-threatening diabetic retinopathy and macular edema in a setting with no previous screening or laser treatment for diabetic retinopathy in sub-Saharan Africa.
Materials and methods
A cohort Markov model was built to compare combined targeted screening and laser treat-ment for patients with sight-threatening diabetic retinopathy and macular edema against no intervention. Primary outcomes were incremental cost per quality-adjusted life year (QALY) gained and per disability-adjusted life year (DALY) averted. Primary data were collected on 357 participants from the Malawi Diabetic Retinopathy Study, a prospective, observational cohort study. Multiple scenarios were explored and a probabilistic sensitivity analysis was performed.
Results
In the base case (age: 50 years, service utilization rate: 80%), the cost of the intervention and the years of severe visual impairment averted per patient screened were $209 and 2.2 years respectively. Applying the World Health Organization threshold of cost-effectiveness for Malawi ($679), the base case was cost-effective when QALYs were used ($400 per QALY gained) but not when DALYs were used ($766 per DALY averted). The intervention was more effective when it targeted younger patients (age: 30 years) and less cost-effective when the utilization rate was lowered to 50%.
a1111111111 a1111111111 a1111111111 a1111111111 a1111111111 OPEN ACCESS
Citation: Vetrini D, Kiire CA, Burgess PI, Harding
SP, Kayange PC, Kalua K, et al. (2018) Incremental cost-effectiveness of screening and laser treatment for diabetic retinopathy and macular edema in Malawi. PLoS ONE 13(1): e0190742.https://doi. org/10.1371/journal.pone.0190742
Editor: David Hutton, University of Michigan,
UNITED STATES
Received: April 1, 2017
Accepted: December 10, 2017
Published: January 4, 2018
Copyright:©2018 Vetrini et al. This is an open
access article distributed under the terms of the
Creative Commons Attribution License, which permits unrestricted use, distribution, and reproduction in any medium, provided the original author and source are credited.
Data Availability Statement: The minimal
anonymized data set necessary to replicate the study has been uploaded as Supporting Information file (S1 Data).
Funding: The study was funded by a British
Conclusions
Annual photographic screening of diabetic patients attending medical diabetes clinics in Malawi, with the provision of laser treatment for those with sight-threatening diabetic retinop-athy and macular edema, appears to be cost-effective in terms of QALYs gained, in our base case scenario. Cost-effectiveness improves if services are utilized more intensively and extended to younger patients.
Introduction
Non-communicable diseases have a major impact on the global burden of disease, contribut-ing 54% of all disability-adjusted life years (DALYs) lost globally [1]. Diabetes is a leading cause of morbidity and mortality in most high-income countries and its prevalence is rising rapidly in economically developing countries [2]. It causes visual impairment primarily through the development of diabetic retinopathy (DR), in particular, proliferative diabetic reti-nopathy (PDR) and diabetic maculopathy, which includes both macular edema and macular ischemia. DR is the fifth leading cause of global blindness [3]. Medical interventions can decrease some of the risk to vision [4–7]. If sight-threatening retinopathy (STDR) is present, timely laser photocoagulation of the retina decreases the risk of severe vision loss [8,9].
The International Diabetes Federation has estimated that the number of adults with diabe-tes in Africa will increase by 98%, from 12.1 million in 2010 to 23.9 million in 2030 [10]. Malawi is one of the poorest countries in the world, with an annual per capita healthcare expenditure of international $93 in 2014 [11]. The recent World Health Organization (WHO) Malawi national STEPwise survey estimated a prevalence of diabetes of 5.6% in adults aged 25 to 64 years, with similar prevalence levels in rural and urban areas [12].
Economic analyses demonstrate that screening for, and treatment of, STDR are cost-effec-tive in developed countries [13–15]. However, to the best of our knowledge, the cost-effective-ness of a combined screening and treatment program for STDR in sub-Saharan Africa has not been previously described.
The Malawi Diabetic Retinopathy Study (MDRS) is an epidemiological study of DR and its treatment in Malawi. Our objective in this analysis was to use data from the MDRS to investi-gate the cost-effectiveness of screening and laser treatment for STDR targeted to patients attending hospital-based diabetes clinics, compared to no systematic screening and no treat-ment, which is current practice in Malawi.
Materials and methods
Study setting and intervention
The MDRS is a prospective, observational cohort study of DR in patients attending primary/ secondary care diabetes clinics in the urban and semi-urban southern Malawi locations of Queen Elizabeth Central Hospital, Blantyre, and Zomba Central Hospital, Zomba. It adhered to the tenets of the declaration of Helsinki. Ethical approval for the study was granted by the College of Medicine Research Ethics Committee in Malawi and the University of Liverpool Committee on Research Ethics. Three hundred and fifty-seven participants, with both type 1 and type 2 diabetes, were identified by systematic random sampling of patients attending these clinics between December 2011 and May 2012. Written informed consent was obtained from all subjects and they were followed up in the eye clinic for two years. Demographic and clinical characteristics of participants in the MDRS have been previously described [16].
data collection and analysis, decision to publish, or preparation of the manuscript.
Competing interests: The authors have declared
Study participants underwent an annual assessment of their eyes on the day they attended their medical diabetic clinic including visual acuity measured by a clinical assistant, and slit-lamp biomicroscopy and digital fundus photography which were performed by an experienced ophthalmologist. Those who required retinal laser photocoagulation typically had up to three additional clinic visits over a 12-month period. Retinal photographs were graded at the accred-ited reading center in the University of Liverpool, UK for the purposes of quality assurance of the study. Retinopathy and maculopathy were classified by feature-specific grading using defi-nitions established in the Liverpool Diabetic Eye Study (LDES) [17].
The threshold for scatter laser treatment (peripheral retinal photocoagulation, PRP) was the ETDRS ‘4-2-1 rule’, equivalent to level 50 retinopathy on the LDES scale. Standard treatment was approximately 3000 laser burns placed one burn width apart, outside the vascular arcades and at least 2 disc diameters from the center of the fovea. Scatter laser treatment was typically delivered over two or more hospital visits. Eyes with clinically significant macular edema (CSME) and visual acuity<80 ETDRS letters (equivalent to 20/30 Snellen), or exudates track-ing towards the center of the fovea, underwent focal laser or modified macular grid laser as appropriate [18]. All MDRS participants who fulfilled the criteria for laser treatment were treated, and rates of progression and/or regression of DR, for these and the participants who did not require treatment, were reviewed on an annual basis.
Cost-effectiveness analysis
A cohort Markov model, built in Microsoft Excel 2011, was used to estimate the cost-effective-ness of combined targeted screening and laser treatment for STDR in the MDRS patient popu-lation. In this model photographic screening, grading of retinal photographs and laser
treatment is performed by an ophthalmologist. The decision whether to instigate laser treat-ment is made at the appointtreat-ment at which the screening procedure is performed. Treattreat-ment is undertaken at a separate appointment. The size of the hypothetical cohort was 1000 diabetic patients entering the model at the age of 50 years and each model cycle was one year. Costs and outcomes were estimated over a 25-year period based on the age-specific life expectancy in Malawi [19]. An annual discount rate of 3% was applied to both costs and health effects in line with the WHO cost-effectiveness analysis (CEA) guidelines [20].
The primary outcome of this study was the incremental cost-effectiveness ratio (ICER), in terms of cost per quality-adjusted life years (QALYs) gained and per DALY averted, of the combination of a targeted screening program and laser treatment for STDR. Secondary out-comes included the cost of service delivery and the number of years of severe visual
impairment avoided through screening and laser treatment.
For the purpose of this analysis, LDES level 10 was classified as no retinopathy, levels 20 and 30 as mild non-proliferative diabetic retinopathy (NPDR), level 40 as moderate NPDR, and level 50+ as severe non-proliferative diabetic retinopathy (SNPDR) / PDR. Level 4 maculo-pathy on the LDES scale was considered to be equivalent to CSME as defined in the Early Treatment of Diabetic Retinopathy Study (ETDRS) [21]. Only data from the eye with poorer vision were included in this analysis.
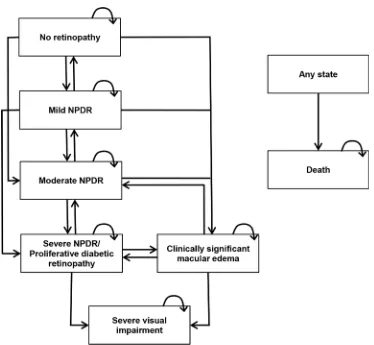
Simulated patients were allocated into one of six Markov health states reflecting the differ-ent disease stages: no DR, mild NPDR, moderate NPDR, SNPDR/PDR, CSME, severe visual impairment. SNPDR and PDR were grouped into the same state, as they were the treatment threshold for scatter PRP. Severe visual impairment was defined as best corrected visual acuity (VA)<6/60 in the better eye (WHO [22]). The model structure is outlined inFig 1.
costs of screening and laser treatment program. Other model parameters were derived from the published literature (specified below) [8,13,14,23,24,25]. The main model parameters are outlined inTable 1.
Rates of progression/regression of disease from no retinopathy, mild retinopathy and mod-erate retinopathy were determined from the MDRS. Progression to severe visual impairment after treatment was derived from the MDRS based on the proportion of patients who devel-oped a reduction in vision to VA<6/60 within a year. Data on progression of disease from SNPDR/PDR and CSME to severe visual impairment were derived from the ETDRS [8,13,14].
Age specific mortality rates were obtained from the WHO Malawi life tables for the general population [19]. In the absence of Malawi-specific data, a diabetes-specific relative risk of death was calculated from data from a study conducted in Tanzania [24]. WHO 5-year age group mortality rates were multiplied by the mortality multiplier and then converted into 1-year mortality probabilities.
Cost parameters
A healthcare provider perspective was chosen and all direct costs accrued by the hospital were included (Table 2).
[image:5.612.199.573.63.408.2]We used an ingredient costing approach, collecting information on the quantity and value of each resource used for the provision of the targeted screening program and laser treatment,
Fig 1. Model schematic. The arrows indicate the permitted movement between the health states.
NPDR = non-proliferative diabetic retinopathy.
where indicated, in the MDRS. Costs were recorded in Malawian Kwacha and converted into US dollars (average World Bank exchange rate in 2013 USD:MKw = 1:364.4). The costs of all the inputs were considered whether or not they represented a direct financial cost to the provider.
[image:6.612.199.575.87.421.2]Costs were divided into four main categories: staff, buildings, equipment and consumables. They were sub-categorized into screening and laser visits. The costs of a screening visit were assumed to be the same as those of a non-laser follow up visit. Staff costs were calculated from annual gross salaries and the time taken for each type of hospital visit. They included the salary of the ophthalmologist and one clinical assistant. Building costs included rent, utilities and
Table 1. Markov model clinical parameter estimates.
Parameter Base case 95% CI Source Annual transition probabilities
No DR to mild NPDR 0.21 0.16–0.25 MDRS
Mild NPDR to moderate NPDR 0.06 0.03–0.09 MDRS
Moderate NPDDR to severe NPDR/PDR 0.11 0.02–0.25 MDRS
Severe NPDR/PDR to severe visual impairment without treatment 0.09 0.07–0.12 [8,13,14]
Severe NPDR/PDR to severe visual impairment with treatment 0.02 0–0.07 MDRS
CSME to severe visual impairment without treatment 0.05 0.03–0.08 [8,13,14]
CSME to severe visual impairment with treatment 0.03 0–0.09 MDRS
Mortality
Diabetes-specific relative risk 1.97 1.17–2.88 [24]
Initial distribution
No DR 44% 41%-48% MDRS
Mild NPDR 30% 27%-33% MDRS
Moderate NPDR 9% 7%-11% MDRS
Severe NPDR/PDR 4% 2%-5% MDRS
CSME 13% 11%-15% MDRS
Health-state utilities
No DR 0.89 0.78–0.96 [23]
Mild NPDR 0.80 0.73–0.86 [23]
Moderate NPDR 0.80 0.73–0.86 [23]
Severe NPDR/PDR 0.70 0.63–0.76 [23]
CSME 0.70 0.63–0.76 [23]
Severe visual impairment (VA<6/60) 0.55 0.46–0.63 [23]
Disability weight
Severe visual impairment (VA<6/60) 0.19 0.13–0.27 [25]
CI = Confidence interval; DR = Diabetic retinopathy; NPDR = Non-proliferative diabetic retinopathy; CSME = Clinically significant macular edema; VA = Visual acuity
https://doi.org/10.1371/journal.pone.0190742.t001
Table 2. Per-patient hospital costs for a screening visit and a laser treatment visit. Screening (US$) Treatment (US$)
Staff salaries 2.77 2.14
Buildings 0.17 0.77
Equipment 0.09 10.76
Consumables 0.72 0.48
Total 3.75 14.16
[image:6.612.203.579.624.698.2]cleaning costs. The proportion of the total building costs allocated to the screening and laser treatment rooms was based on their floor area. The working life of the equipment was antici-pated to be 10 years for the slit-lamp, fundus camera and laser, and 5 years for the lenses needed for slit-lamp examination and for laser treatment. The costs of consumables were based on the quantity of eye drops used for each visit. Unit costs were taken from official price guides recommended by the WHO, which provide international average prices.
Effectiveness parameters
In order to determine the ICER for the screening and laser treatment program, we calculated QALYs gained, DALYs averted and years of severe visual impairment avoided. QALYs were calculated using utilities estimated by S. Polack et al. [23] in a study conducted in India, due to the lack of utility values specific for Malawi. For the calculation of DALYs, we used the disabil-ity weights provided by the WHO in the Global Burden of Diseases project (GBD) [25]. As the severity of DR does not always correlate with a specific degree of vision loss, it was not possible to use the disability weights reported by the GBD for mild and moderate visual impairment. For our assessment of severe visual impairment, however, we were able to use the GBD disabil-ity weight for severe visual impairment (0.191; 95% CI: 0.129–0.269).
Other model inputs and assumptions
The baseline distribution of the population among the different health states was estimated from the MDRS patients aged between 45 and 55 years. The average number of eyes treated per patient in a single laser session in the MDRS was 1.6. The proportion of patients diagnosed with CSME who also received treatment for DR was 62%. We made the following assumptions for the model:
• patients in no retinopathy, mild NPDR and moderate NPDR health states received one screening visit per year
• patients in the SNPDR/PDR health state at their annual screening visit received three subse-quent laser sessions and two follow-up visits within the year
• patients in the CSME health state at their annual screening visit received one laser session and two follow-up visits within the year
• patients in the severe visual impairment health state did not receive any further treatment and therefore no cost or improvement in health state was considered for these patients
• all patients meeting the inclusion criteria for treatment applied in the MDRS received laser scatter treatment and/or macular laser treatment.
Sensitivity analysis
horizon used for this scenario was 38 years, based on the age-specific life expectancy in Malawi [19]. The +/-20% salary and the 50% utilization rate scenarios were evaluated relative to the base case scenario. The +/-20% salary scenarios were included to explore the impact of poten-tial variations in salaries on cost-effectiveness, which might be relevant if salaries differ between otherwise similar countries and contexts. The utilization rate was varied to investigate how the number of patients being screened and treated, if appropriate, affects the cost-effec-tiveness of this intervention.
For each scenario, we carried out a probabilistic sensitivity analysis (PSA) [26] to quantify decision uncertainty given the evidence available. Decision uncertainty was presented using cost-effectiveness acceptability curves (CEACs), a graphical representation of the probability that the intervention is cost-effective as a function of a decision-maker’s willingness-to-pay [27,28].
Results
Health outcomes and cost-effectiveness
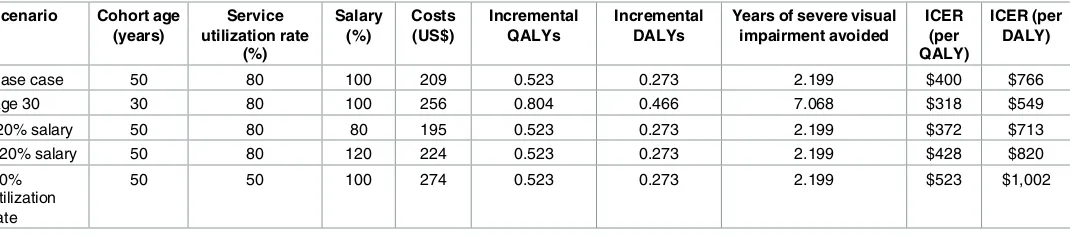
The estimated costs, incremental QALYs, incremental DALYs, years of severe visual impairment avoided per diabetic patients, and ICERs for the intervention arm compared to standard care are shown inTable 3for each scenario.
[image:8.612.41.577.561.679.2]As expected, the highest clinical outcomes are obtained with the age 30 scenario (0.804 QALYs gained, 0.466 DALYs averted and 7.068 years of severe visual impairment avoided per patients) due to longer time spent in the model by the cohort. The other four scenarios are associated with the same outcomes as only costs were varied: 0.523 QALYs gained, 0.273 DALYs averted and 2.199 years of severe visual impairment avoided per patient. The per-patient costs of the intervention are: $195 for the -20% of salaries scenario, $209 for the base case, $224 for the +20% of salaries scenario, $256 for the age 30 scenario, and $274 for the 50% utilization rate scenario. From a health provider perspective and compared with no screening and no treatment, the intervention in the base case has an ICER of $400 per QALY gained. The lowest ICER is obtained with the age 30 scenario ($318 per QALY) while the 50% utiliza-tion rate scenario is the least cost-effective ($523 per QALY). The impact on the ICER of an increase ($428 per QALY) or a reduction ($372 per QALY) by 20% in the staff salaries is rela-tively small. Using the WHO threshold for low-income countries [20,29], in the base case and all the sensitivity scenarios explored the intervention appears cost-effective (<3x GDP/capita) but not highly cost-effective (<1x GDP/capita).
Table 3. Estimated costs, clinical outcomes, and ICERs per diabetic patient screened and treated with laser, if indicated, in each scenario. Scenario Cohort age
(years)
Service utilization rate
(%)
Salary (%)
Costs (US$)
Incremental QALYs
Incremental DALYs
Years of severe visual impairment avoided
ICER (per QALY)
ICER (per DALY)
Base case 50 80 100 209 0.523 0.273 2.199 $400 $766
Age 30 30 80 100 256 0.804 0.466 7.068 $318 $549
-20% salary 50 80 80 195 0.523 0.273 2.199 $372 $713
+20% salary 50 80 120 224 0.523 0.273 2.199 $428 $820
50% utilization rate
50 50 100 274 0.523 0.273 2.199 $523 $1,002
QALY = Quality-adjusted life year; DALY = Disability-adjusted life year; ICER = Incremental cost-effectiveness ratio
When DALYs are used, the ICERs become higher because the incremental DALYs averted are smaller. In the base case the ICER is $766 per DALY averted, $549 for the age 30 scenario, $713 and $820 respectively for the -/+ 20% of salaries scenarios and $1,002 for the 50% utiliza-tion rate scenario. In this case the only ICER falling within the WHO cost-effectiveness thresh-old calculated for Malawi is of the age 30 scenario.
Probabilistic sensitivity analysis
The results of the probabilistic sensitivity analysis (PSA) based on QALYs are shown inFig 2. Considering the WHO cost-effectiveness threshold for an intervention in Malawi ($679 per QALY), the base case has a 91% probability of being cost-effective. The age 30 scenario has the highest probability of being cost effective (97%), and the 50% utilization rate scenario has the lowest probability of being cost-effective (75%), at this threshold.
When results of the PSA are based on DALYs, all the curves shift to the right, with a reduc-tion in the probability of the intervenreduc-tion being cost-effective (S1 Fig). For the same WHO cost-effectiveness threshold of $679, the probability of the base case scenario being cost-effec-tive would fall to 33%, compared with 66% for the age 30 scenario, and 10% for the 50% utiliza-tion rate scenario.
Discussion
[image:9.612.207.495.77.288.2]It has previously been shown that at baseline in the MDRS, the prevalence of STDR in the patients attending hospital based diabetic clinics was estimated to be 29.4%, approximately four times that reported in recent European studies [16]. Over a 24-month period, the inci-dence of STDR was 10.2%. This is approximately three times that seen in Europe [30]. Our objective in this analysis was to use the MDRS data to investigate the cost-effectiveness of com-bined targeted screening and laser treatment, where indicated, for STDR, compared to no sys-tematic screening and no treatment for DR, in this context.
Fig 2. Cost-effectiveness acceptability curves based on QALYs. Probability that the intervention is
cost-effective in a range of cost-cost-effectiveness thresholds for the base case, + 20% on salaries scenario, -20% on salaries scenario, 50% utilization rate scenario, and age 30 scenario. QALY = Quality-adjusted life year.
Our data suggest that providing this type of DR service in this setting in Malawi can be cost-effective, by the WHO criteria, in a range of service delivery scenarios, particularly when considering the ICER in terms of QALYs gained. They also suggest that in the base case, 2.2 years of severe visual loss per patient might be avoidable.
The PSA shows how sensitive the cost-effectiveness result is to the age profile of beneficia-ries. In the age 30 scenario the incremental costs are amongst the highest but the increase in health gain for the model population generates a lower ICER. This reflects the increased num-ber of years spent by patients in the model during which they benefit from the intervention. When DALYs averted are used to evaluate cost-effectiveness, the ICERs are higher because the incremental DALYs averted are smaller. In this case, the only ICER falling within the WHO cost-effectiveness threshold calculated for Malawi is for the age 30 scenario. The utilization rate also has a marked impact on the cost-effectiveness of the intervention. This is because the highest costs are the fixed costs of the equipment required to deliver this service (e.g. the laser) and these remain the same even when the equipment is used less frequently. Varying salaries by +/-20% has the smallest impact on the cost-effectiveness result.
These data clearly demonstrate that the probability of the intervention being cost-effective is affected by the health outcome measure selected for the analysis. Unlike QALYs, DALYs in our model can only capture the health impact of the worst health state. The findings of Polack et al. [23] suggest that patients place a value on avoiding less severe vision problems, which is only reflected in the QALYs calculation. While DALYs are commonly used in cost-effective-ness analyses [31], our study illustrates how their lack of sensitivity to certain types of health improvement might undervalue interventions that achieve these improvements.
Strengths and limitations
There are few studies conducted in low- and middle-income countries with which to compare our results. To the best of our knowledge, the only cost-effectiveness analysis published to date for DR screening in sub-Saharan Africa is a study that was conducted by Khan and colleagues [32]. They showed that, when compared to no screening, non-mydriatic digital fundoscopy is a cost-effective measure for screening and diagnosis of DR in a primary care setting in South Africa. Like other recent studies in other parts of the world [14,33,34], their analyses focus the attention on the economic impact of screening programs and do not include laser treatment, as ours does. Another cost-effectiveness analysis of screening for DR in a resource-constrained setting is the analysis conducted by Rachapelle et al. [35] in India. They showed that a DR tele-screening program is cost-effective compared to no tele-screening in a rural Indian setting.
Participants in the MDRS were randomly sampled from two hospital-based clinics that were providing both primary and secondary care, and, as such, the distribution of the levels of retinopathy seen is likely to be typical of the population attending these clinics. It is possible, however, that the demographics and high levels of severity of disease in this population might not be completely representative of the general population with diabetes in Malawi.
Intravitreal anti vascular endothelial growth factor (anti-VEGF) agents are an important treatment for DR and macular edema in many countries. These agents are not available in the public sector in Malawi (and most countries in the region) in part due to cost. A separate, sig-nificant barrier to their introduction is the lack of suitable sterile compounding pharmacy facilities and appropriately trained pharmacists to prepare the drug safely. The use of anti-VEGF agents was therefore not considered in this analysis.
minimize bias associated with the use of cost data and retinopathy progression data (with treatment) from a different setting. It was not, however, possible to obtain all of the model inputs from Malawian or other sub-Saharan African sources. Our data on outcomes for untreated STDR came from the ETDRS, a well-known study of the treatment of DR that was conducted in the US over 35 years ago, a time before the use of laser treatment was widespread [8]. We chose to use data from the ETDRS because it provides robust outcomes data on untreated patients. No equivalent data exists in other settings, and it would now be unethical to not include treatment for patients in a study such as this today. Moreover, the progression rates to severe visual impairment in patients who received laser treatment in the MDRS and in the ETDRS are comparable. Therefore, we considered appropriate the use of data from the ETDRS to inform disease progression in the untreated population. In the absence of locally available data, a study based in India published by Polack et al. [23] was chosen as our source of utility values. The authors classified DR and macular edema according to the same health states that we used in our model and, as in our study, their analysis was based on the eye with worse vision. It is possible that the MDRS participants might perceive the disutility caused by the different levels of DR differently from those in the Indian study. However, we believe that data from an Indian setting (lower middle-income country) may be more relevant to a sub-Saharan African context than the data available from high-income countries.
A potential limitation of our analysis is the use of vision-related utility values that Polack et al. elicited through a direct method (time trade-off, TTO) in which the highest value anchors in perfect vision rather than perfect health. Their study also reported the EQ-5D utility values (in which the highest value anchors in perfect health) calculated using UK weights in the absence of Indian-specific tariffs. Kymes and Lee [36] discussed in their paper the potential bias of using vision-related utility values in cost-effectiveness analyses. However, the use of UK weights may not appropriately reflect patients’ quality of life in an Indian setting, therefore we used TTO-elicited utility values for our analysis. The mortality relative risk for diabetes came from a study conducted in neighboring Tanzania [24]. There are differences between persons with diabetes in Tanzania and Malawi, including in ethnic, cultural and economic diversity, as well as levels of access to health care. These could lead to differences in the relative risk between the two countries, but this was our best estimate for this variable in Malawi.
For the purpose of our analysis, we made the assumption that patients in the severe visual impairment health state did not receive any further treatment. This does not pre-cisely reflect what happened in the MDRS. As a result of the low number of participants in this health state, there was an insufficient amount of data for us to model regression from severe visual impairment in response to laser treatment. For this reason, the severe visual impairment health state was considered to be an absorbing state and we believe this to be a conservative assumption.
members. This might include the cost of informal care provided and additional income loss, both of which could affect the patient’s welfare.
Interpretation
Based on the results of our analysis, the introduction of a program of targeted photographic screening and laser treatment for STDR, in a public hospital setting in Malawi, appears to be cost-effective in a variety of service delivery scenarios. The most cost-effective scenarios that we identified involved treating a younger cohort than the one in the base case, and achieving a high rate of usage of the service.
In our model retinal photography, grading and laser treatment were conducted by an ophthalmologist. Depending on the setting, salary costs might be lower if some of these steps were performed by allied health professionals, rather than doctors. We have included the cost of a fundus camera in our calculations. It is a valuable tool for documenting retinal findings, monitoring progress and explaining DR to patients. Screening programs in both high and low resource settings require quality assurance procedures. Our experience in the UK suggests that photographic screening is the best method to achieve this. Technological developments which reduce equipment costs would be expected to improve the cost-effec-tiveness of the intervention.
Generalizability
This project was conducted in urban and semi-urban regions of Malawi where, although the prevalence of diabetes has been shown to be similar [12], the risk factors for the development and progression of STDR might be different from those in a rural context. As a result, it remains unclear whether the cost-effectiveness of this approach to screening and treatment for STDR would be the same in a more rural environment. The results that we have shown here are likely to be most generalizable to other urban and semi-urban low-income country set-tings. Our screening was targeted at people with diabetes attending a routine diabetes clinic, a requirement for access to medications. We believe this model is realistic and sustainable in a resource poor setting such as Malawi where community based or primary care screening is unaffordable and impractical. If the distribution of patients amongst the health states and the clinical outcomes are similar in other low-income countries with a higher GDP than that of Malawi, then the resulting increase in the WHO threshold would favor the cost-effectiveness of the intervention in these countries.
In summary, we have shown that a targeted screening and laser treatment service for STDR in Malawi can be cost-effective, by the standards set by the WHO. Our study highlights the ongoing need for data collection on the epidemiology of DR across sub-Saharan Africa to inform policy on clinical care for those with diabetes in this setting.
Supporting information
S1 Data. MDRS patient-level data.
(XLSX)
S1 Fig. Cost-effectiveness acceptability curves based on DALYs. Probability that the
inter-vention is cost-effective in a range of cost-effectiveness thresholds for the base case, + 20% on salaries scenario, -20% on salaries scenario, 50% utilization rate scenario, and age 30 scenario. DALY = Disability-adjusted life year.
Acknowledgments
The authors acknowledge the hard work of the MDRS study team: Sister Chrissy Pindani, Frank Mbewe, Owen Mkangadzula, Munthali Desire, Moffat Chidzuwa, Winnie Cheppe Makolija, Joseph Bwanali and Grieves Mang’anda. We thank Dr Ticiana Criddle and Mr Stuart Lark (University of Liverpool) for expertly grading retinal photographs. We are grateful for the work of the World Diabetes Foundation in improving infrastructure for diabetes care in Malawi including provision of a laser.
Author Contributions
Conceptualization: Nicholas A. V. Beare.
Data curation: Damir Vetrini, Christine A. Kiire.
Formal analysis: Damir Vetrini.
Funding acquisition: Philip I. Burgess, Nicholas A. V. Beare.
Investigation: Philip I. Burgess.
Methodology: Damir Vetrini, Nicholas A. V. Beare, Jason Madan.
Project administration: Damir Vetrini, Christine A. Kiire, Philip I. Burgess.
Resources: Philip I. Burgess, Petros C. Kayange, Khumbo Kalua, Gerald Msukwa.
Software: Damir Vetrini, Jason Madan.
Supervision: Simon P. Harding, Nicholas A. V. Beare, Jason Madan.
Validation: Jason Madan.
Visualization: Damir Vetrini.
Writing – original draft: Damir Vetrini.
Writing – review & editing: Christine A. Kiire, Philip I. Burgess, Simon P. Harding, Nicholas
A. V. Beare, Jason Madan.
References
1. Murray CJ, Vos T, Lopez AD, Naghavi M, Flaxman AD, Michaud C, et al. Disability-adjusted life years (DALYs) for 291 diseases and injuries in 21 regions, 1990–2010: a systematic analysis for the Global Burden of Disease Study 2010. Lancet. 2012 Dec 15; 380(9859):2197–223.https://doi.org/10.1016/ S0140-6736(12)61689-4PMID:23245608
2. International Diabetes Federation. IDF Diabetes Atlas. 6thed. [article online] 2013. Brussels, Interna-tional Diabetes Federation. Available from:http://www.idf.org/sites/default/files/EN_6E_Ch2_the_ Global_Burden.pdf.
3. World Health Organisation. State of the World’s Sight. Vision 2020 –The Right to Sight. Geneva; 2005.
4. The effect of intensive treatment of diabetes on the development and progression of long-term compli-cations in insulin-dependent diabetes mellitus. The Diabetes Control and Complicompli-cations Trial Research Group. N Engl J Med. 1993 Sep 30; 329(14):977–86.https://doi.org/10.1056/NEJM199309303291401
PMID:8366922
5. Intensive blood-glucose control with sulphonylureas or insulin compared with conventional treatment and risk of complications in patients with type 2 diabetes (UKPDS 33). UK Prospective Diabetes Study (UKPDS) Group. Lancet. 1998 Sep 12; 352(9131):837–53. PMID:9742976
6. Tight blood pressure control and risk of macrovascular and microvascular complications in type 2 diabe-tes: UKPDS 38. UK Prospective Diabetes Study Group. BMJ. 1998 Sep 12; 317(7160):703–13. PMID:
7. Schrier RW, Estacio RO, Esler A, Mehler P. Effects of aggressive blood pressure control in normoten-sive type 2 diabetic patients on albuminuria, retinopathy and strokes. Kidney Int. 2002 Mar; 61(3):1086– 97.https://doi.org/10.1046/j.1523-1755.2002.00213.xPMID:11849464
8. Early Treatment Diabetic Retinopathy Study Research Group. Early photocoagulation for diabetic reti-nopathy. ETDRS report number 9. Ophthalmology. 1991 May; 98(5 Suppl):766–85. PMID:2062512
9. The Diabetic Retinopathy Study Research Group. Photocoagulation treatment of proliferative diabetic retinopathy. Clinical application of Diabetic Retinopathy Study (DRS) findings. DRS Report Number 8. Ophthalmology. 1981 Jul; 88(7):583–600. PMID:7196564
10. IDF. Diabetes Atlas. 4th edition. Brussels: International Diabetes Federation, 2009
11. World Health Organisation. Country statistics: Malawi. Geneva 2013. Available from:http://www.who. int/countries/mwi/en/.
12. Msyamboza KP, Ngwira B, Dzowela T, Mvula C, Kathyola D, Harries AD, et al. The burden of selected chronic non-communicable diseases and their risk factors in Malawi: nationwide STEPS survey. PLoS One. 2011; 6(5):e20316.https://doi.org/10.1371/journal.pone.0020316PMID:21629735
13. Javitt JC, Aiello LP. Cost-effectiveness of detecting and treating diabetic retinopathy. Ann Intern Med. 1996 Jan 1; 124(1 Pt 2):164–9.
14. Vijan S, Hofer TP, Hayward RA. Cost-utility analysis of screening intervals for diabetic retinopathy in patients with type 2 diabetes mellitus. JAMA. 2000 Feb 16; 283(7):889–96. PMID:10685713
15. James M, Turner DA, Broadbent DM, Vora J, Harding SP. Cost effectiveness analysis of screening for sight threatening diabetic eye disease. BMJ. 2000 Jun 17; 320(7250):1627–31. PMID:10856062
16. Burgess PI, Allain TJ, Garcı´a-Fiñana M, Beare NA, Msuka G, Harding SP. High prevalence in Malawi of sight-threatening retinopathy and visual impairment caused by diabetes: identification of population-specific targets for intervention. Diabet Med. 2014 Dec; 31(12):1643–50.https://doi.org/10.1111/dme. 12492PMID:24823871
17. Harding SP, Broadbent DM, Neoh C, White MC, Vora J. Sensitivity and specificity of photography and direct ophthalmoscopy in screening for sight threatening eye disease: the Liverpool Diabetic Eye Study. BMJ. 1995 Oct 28; 311(7013):1131–5. PMID:7580708
18. Early Treatment Diabetic Retinopathy Study research group. Photocoagulation for diabetic macular edema. Early Treatment Diabetic Retinopathy Study report number 1. Arch Ophthalmol. 1985 Dec; 103 (12):1796–806. PMID:2866759
19. World Health Organisation. Life tables for WHO Member States: Malawi. Geneva 2012. Available from:
http://apps.who.int/gho/data/?theme=main&vid=60980.
20. Hutubessy RCW, Baltussen RMPM, Edejer TTT, Evans DB. Generalized cost-effectiveness analysis: an aid to decision making in health. In: Tan-Torres Edejer T, Baltussen R, Adam T, Hutubessy R, Acharya A, Evans DB, et al. Making Choices in Health: WHO guide to Cost-effectiveness analysis. World Health Organisation. Geneva 2003:277–288. Available from:http://www.who.int/choice/ publications/p_2003_generalised_cea.pdf.
21. Early Treatment Diabetic Retinopathy Study Research Group. Grading diabetic retinopathy from ste-reoscopic color fundus photographs—an extension of the modified Airlie House classification. ETDRS report number 10. Ophthalmology. 1991 May; 98(5 Suppl):786–806. PMID:2062513
22. World Health Organisation. International Statistical Classification of Diseases and related Health Prob-lems 10th Revision (ICD-10). Geneva 2015. Available from:http://apps.who.int/classifications/icd10/ browse/2015/en#/H53-H54.
23. Polack S, Alavi Y, Rachapelle S, Kulothungan V, Kuper H. Utility values associated with diabetic reti-nopathy in Chennai, India. Ophthalmic Epidemiol. 2015 Feb; 22(1):20–7.https://doi.org/10.3109/ 09286586.2014.885057PMID:24669801
24. McLarty DG, Unwin N, Kitange HM, Alberti KG. Diabetes mellitus as a cause of death in sub-Saharan Africa: results of a community-based study in Tanzania. The Adult Morbidity and Mortality Project. Dia-bet Med. 1996 Nov; 13(11):990–4.https://doi.org/10.1002/(SICI)1096-9136(199611)13:11< 990::AID-DIA265>3.0.CO;2-4PMID:8946159
25. WHO methods and data sources for global burden of disease estimates 2000–2011. Department of Health Statistics and Information Systems. World Health Organisation. Geneva 2013. Available from:
http://www.who.int/healthinfo/statistics/GlobalDALYmethods_2000_2011.pdf.
26. Baio G, Dawid AP. Probabilistic sensitivity analysis in health economics. Stat Methods Med Res. 2015 Dec; 24(6):615–34.https://doi.org/10.1177/0962280211419832PMID:21930515
28. Fenwick E, O’Brien BJ, Briggs A. Cost-effectiveness acceptability curves—facts, fallacies and fre-quently asked questions. Health Econ. 2004 May; 13(5):405–15.https://doi.org/10.1002/hec.903
PMID:15127421
29. WHO Commission on Macroeconomics and Health. Macroeconomics and health: investing in health for economic development. Report of the Commission on Macroeconomics and Health. Geneva: WHO, 2001. Available from:http://whqlibdoc.who.int/publications/2001/924154550x.pdf.
30. Burgess PI, Harding SP, Garcia-Finana M, Beare NA, Msukwa G, Allain TJ. First Porspective Cohort Study of Diabetic Retinopathy from Sub-Saharan Africa. Ophtalmology. 2016 Sep; 123(9):1919–25.
31. Fox-Rushby JA, Hanson K. Calculating and presenting disability adjusted life years (DALYs) in cost-effectiveness analysis. Health Policy Plan. 2001 Sep; 16(3):326–31. PMID:11527874
32. Khan T, Bertram MY, Jina R, Mash B, Levitt N, Hofman K. Preventing diabetes blindness: Cost effec-tiveness of a screening programme using digital non-mydriatic fundus photography for diabetic retinop-athy in a primary health care setting in South Africa. Diabetes Res Clin Pract. 2013 Aug; 101(2):170–6.
https://doi.org/10.1016/j.diabres.2013.05.006PMID:23796361
33. Rein DB, Wittenborn JS, Zhang X, Allaire BA, Song MS, Klein R, et al. The cost-effectiveness of three screening alternatives for people with diabetes with no or early diabetic retinopathy. Health Serv Res. 2011 Oct; 46(5):1534–61.https://doi.org/10.1111/j.1475-6773.2011.01263.xPMID:21492158
34. Kim SW, Kang GW. Cost-Utility Analysis of Screening Strategies for Diabetic Retinopathy in Korea. J Korean Med Sci. 2015 Dec; 30(12):1723–32.https://doi.org/10.3346/jkms.2015.30.12.1723PMID:
26713046
35. Rachapelle S, Legood R, Alavi Y, Lindfield R, Sharma T, Kuper H, et al. The cost-utility of telemedicine to screen for diabetic retinopathy in India. Ophthalmology. 2013 Mar; 120(3):566–73.https://doi.org/10. 1016/j.ophtha.2012.09.002PMID:23211635