Original Article
Guanylate cyclase-C signaling pathway regulates
intestinal inflammatory injury and epithelial
barrier function in Caco-2 cells
Yijie Wang1*, Danfeng Lan2*, Junkun Niu2, Jiarong Miao2, Xiangqian Dong2, Gang Yang2, Fengrui Zhang2,
Kunhua Wang3, Yu Cao4, Yinglei Miao2
1Department of Critical Care Medicine, The First Affiliated Hospital of Kunming Medical University, Kunming, China; Departments of 2Gastroenterology, 3General Surgery, The First Affiliated Hospital of Kunming Medical University, Yunnan Institute of Digestive Disease, Kunming, China; 4Department of Cardiac Surgery, The First People’s Hospital of Yunnan Province, Kunming, China. *Equal contributors.
Received July 12, 2016; Accepted July 21, 2016; Epub September 1, 2016; Published September 15, 2016
Abstract: Background: Guanylate cyclase-C (GC-C) signaling pathway via guanylin (Gn) and uroguanylin (Ugn) activa-tion regulates intestinal fluid and electrolyte homeostasis. It is down-regulated in the patients of inflammatory bowel diseases (IBD). However, studies on the role of GC-C signaling in murine models of colitis are controversial. Here, we investigated the effect of GC-C on intestinal inflammation using Caco-2 cells. Methods: Caco-2 monolayers grown on Transwell filters were stimulated with IL-1β to model the inflammatory cells of intestine. The activity of GC-C signal-ing was regulated by transfection with Gn overexpression vector or GC-C shRNA plasmid. After different treatment with cells, the levels of Gn, Ugn, GC-C, paracellular permeability, superoxide dismutase (SOD), pro-inflammatory cytokines (IL-8 and TNF-α) and tight junction proteins (occludin, claudin-1 and ZO-1) were detected. Results: The ex-pression of Gn, Ugn and GC-C was all significantly reduced after stimulation with IL-1β. Relative to the empty vector controls, IL-1β-treated cells transfected with Gn overexpression vector had significantly increased levels of Gn, GC-C, SOD, claudin-1 and ZO-1 as well as decreased levels of IL-8, TNF-α and permeability. Conversely, GC-C-silencing cells had significantly increased levels of IL-8, TNF-α and permeability as well as decreased levels of Gn, Ugn, GC-C, SOD, claudin-1 and ZO-1 induced by IL-1β compared with the corresponding empty plasmid controls. Conclusions: GC-C signaling pathway plays a protective role in the intestinal inflammatory injury and epithelial barrier function in Caco-2 cells. These observations further support the possible pathogenetic role of GC-C and clinical therapeutic potential of GC-C agonists in IBD.
Keywords: Guanylate cyclase-C, inflammatory bowel disease, caco-2 cells
Introduction
Inflammatory bowel diseases (IBD) are chronic, relapsing inflammatory disorders that primarily affect the small intestine and colon, including two main types of ulcerative colitis (UC) and Crohn’s disease (CD). The etiology of IBD is still not well established. The prevailing understa-nding is that the interaction between environ-mental and microbial triggers in the gut lumen and a dysfunctional intestinal barrier lead to an inappropriate immunological response in gen-etically susceptible individuals [1, 2]. Although current treatment outcome for IBD has im- proved with the use of anti-TNFα agents such as infliximab, about 30% of patients with severe UC are resistant to pharmacological therapy
and require colectomy [3]. Therefore, a continu-ous search for novel therapeutic targets is needed.
cGMP-depen-dent protein kinase II (PKG II), cross-activates cAMP-dependent protein kinase (PKA) and in- hibits a cAMP-specific phosphodiesterase (PDE III). Inhibition of PDE III regulates the action of the apical Na+/H+ exchanger 3 (NHE3), which
causes the decreased absorption of Na+.
Moreover, PKGII and PKA phosphorylate the cystic fibrosis transmembrane conductance regulator (CFTR), increasing its chloride-secret-ing activity, exchangchloride-secret-ing Cl- for HCO
3-, and
induc-ing an increase of bicarbonate secretion into the lumen. Consequently, this physiological ac- tivation of GC-C regulates intestinal fluid and electrolyte homeostasis, preventing dehydra-tion and intestinal obstrucdehydra-tion [6-8].
Our previous study found that Gn, Ugn and GC-C of GC-C signaling pathway were down-regulated in the inflamed colonic mucosa of UC patients, and this downregulation is more sig-nificant with the increase of disease activity index [9]. Recent studies have revealed that GC-C signaling plays a protective role in the integrity of intestinal mucosal barrier [10, 11]. However, studies using murine models of colitis show that the role of the GC-C signaling in in- testinal inflammatory injury is controversial. Steinbrecher KA et al. demonstrated that dex-tran sodium sulfate (DSS)-induced clinical dis-ease and histological damage to the colonic mucosa were significantly less severe in GC-C -/- mice and moderately reduced in Gn-/- mice
[12]. Oppositely, Lin et al. indicated that GC-C
-/-mice have increased susceptibility to colonic inflammatory injury by DSS [11]. The study by Harmel-Laws E et al. confirmed that GC-C
-/-mice had increased proinflammatory gene ex-pression in whole colon tissue and more severe spontaneous colitis when intraperitoneally injected with lipopolysaccharide [13]. These apparently conflicting findings may be because the use of laboratory animals cannot provide the most accurate means to model human IBD. Thus, in this study, we used the human colon adenocarcinoma cell line, Caco-2 cells. This is an ideal cell line to research the functions of intestinal epithelial as this cell line imitates inflammatory status following stimulation with IL-1β [14, 15]. Furthermore, these cells cultured on permeable membranes (Transwell) form a confluent monolayer of polarized columnar ce-lls with tight junctions and the majority of intes-tinal enzymes and transporters are expressed [16]. We employed the genetic approaches to
regulate the activity of GC-C signaling. We also tested the levels of Gn, Ugn, GC-C, paracellular permeability, activity of superoxide dismutase (SOD), pro-inflammatory cytokines (IL-8 and TNF-α) and tight junction proteins (TJPs) (occlu -din, claudin-1 and ZO-1). To clarify the effect of GC-C signaling pathway on intestinal inflamma -tory injury and epithelial barrier function in Caco-2 cells.
Methods
Cells culture and monolayer preparation
The Caco-2 cell line was obtained from the Cell Bank of the Kunming institute of zoology of the Chinese Academy of Sciences (Kunming, China). Briefly, Cells were grown at 37°C in 5% CO2 in high glucose DMEM supplemented with 100 μg/mL streptomycin, 100 IU/mL penicillin, and 10% fetal bovine serum. To prepare Caco-2 monolayers, cells were plated at 5×10⁴/cm2 on
collagen-coated permeable polycarbonate me- mbrane Transwell supports with 0.4 mm pores (Corning, NY) and grown as monolayers for 20 days prior to experiments. The integrity of Caco-2 monolayer was determined by measuring the transepithelial electrical resistance (TER) of the cell monolayer. At each time point of 0, 10, 15, 20 days, TER was determined with a Millicel-ERS-2 volt-ohmmeter (Millipore, Bedford, MA). Each TER measurement was calculated by sub-tracting the resistance value of the filters and fluids. Results were expressed as Ω·cm2
mono-layer surface area. Based on the literature, a resistance reading of 200-250 Ω·cm2 was
con-sidered as indicative of a confluent Caco-2 monolayer with tight junctions. At 20 days dur-ing the experiment, the TER of Caco-2 monolay-ers was all 250 Ω·cm2 approximately. So it could
be used for the following experiments. Transfection of cells with Gn overexpression vectors
Briefly, monolayers were gently washed with HBSS and transferred to 500 µl HBSS. DMEM media in apical chamber were gently aspirated and replaced with 100 µl of 1 mg/ml FITC-dextran in HBSS. Then, monolayers were incu-bated for 2 hours at 37°C. After this time, the basolateral medium was withdrawn and the fluorescence was determined using a fluores -cent plate reader (Thermo, Vantaa, Finland) with an excitation wavelength of 480 nm and an emission wavelength of 520 nm. Results were expressed as the percentage of the FITC-dextran flux of basal chamber relative to the total flux.
Superoxide dismutase (SOD) assay
The SOD activity of Caco-2 cells was evaluated using commercially available kits (Beyotime, Jiangsu, China). This assay was based on the reduction of nitroblue tetrazolium (NBT) to water insoluble blue formazan. Briefly, the cells were cultured in twelve-well plates. After differ-ent treatmdiffer-ents for cells and incubation at 37°C for 30 min, the absorbance at 560 nm was monitored using a Beckman DU530 UV-visible (UV-Vis) spectrophotometer. One unit of SOD was defined as the amountof enzyme inhibiting the reduction of NBT by 50%. Results were expressed as U/mg protein.
Quantitative real-time PCR analysis
Quantitative real-time polymerase chain reac-tion (qRT-PCR) was performed to assess the mRNA expression of Gn, Ugn, GC-C, occludin, claudin-1, ZO-1, IL-8 and TNF-α. The total RNA of Caco-2 cells was extracted using Trizol reagent (Qiagen, Hilden, Germany). The com-plementary DNA was synthesized using SYBR PrimeScript RT reagent kits (TaKaRa, Dalian, China) according to the manufacturer’s instruc-tions. qRT-PCR was performed in an ABI prism 7900 HT sequence detector (Applied Biosys-tems, Foster City, CA, USA) using the SYBR green methodology. The specific primers of Gn, Ugn, GC-C, occludin, claudin-1, ZO-1, IL-8, TNF-α and GAPDH were purchased from Gene-Copoeia (Guangzhou, China). Briefly, in a 20 µl reaction volume, 1 µl of cDNA was added to 10 µl of SYBR green Master mix (Darmstadt, Germany) and 0.3 μmol/L of each primer. The condition of PCR reactions was identical and the following: 95°C 10 min; 95°C 10 sec, 60°C 20 sec, 72°C 30 sec, 40 cycles; 60°C 30 sec. The lengths of expected products were as fol-to the manufacturer’s instructions,
Lipofect-amine 2000 and plasmid DNA were diluted in 375 μl of Opti-MEM medium (Gibco, USA) sepa -rately and incubated at room temperature for 10 min after mixing. The lipofectamine-DNA complex was added to cells and incubated at 37°C for 6 h in an incubator containing 5% CO2 and full humidity. Cells were then washed with phosphate-buffered saline (PBS) and replen-ished with high glucose DMEM. At 48 h after transfection, the permeability of Caco-2 mono-layers was determined, the culture supernatant was collected and the cells were harvested for the following investigations. IL-1β-treated cells transfected with the corresponding empty vec-tors served as the empty vector controls. Transfection of cells with GC-C shRNA
plas-mids
GC-C short hairpin RNA (shRNA) plasmids were used to silence GC-C gene in Caco-2 cells. The four GC-C shRNA expression vectors were shRNA21, shRNA22, shRNA23 and shRNA24 (GeneCopoeia, China). A pervasive disturbing sequence was also designed as the empty plasmid controls (GeneCopoeia, China). The screening experiment was done to pick up the GC-C shRNA expression vector with the best gene silencing results. The transfection was performed using Lipofectamine 2000 reagent following the manufacturer’s instruction. Briefly, both plasmid DNA and Lipofectamine 2000 reagent were diluted in 500 μl of Opti-MEM medium separately and incubated at room tem-perature for 10 min after mixing. After incuba-tion, the lipofectamine-DNA complex was added to each well containing cells and medi-um. Cells were incubated at 37°C for 6 h in an incubator containing 5% CO2 and full humidity. Cells were then washed and replenished with high glucose DMEM. After transfection with GC-C shRNA plasmid for 48 h, cells were stimu-lated with IL-1β as mentioned above. Caco-2 monolayers transfected with the corresponding empty plasmid served as the empty plasmid controls.
Permeability measurement
anti-claudin-1; 1:2000 for rabbit monoclonal ZO-1; 1:1000 for mouse monoclonal anti-IL-8; 1:1000 for rabbit monoclonal anti-TNF-α; respectively). After three washes in TBST, the membranes were incubated with Horseradish peroxidase (HRP)-conjugated secondary anti-body (goat anti-mouse IgG) for 1 h at room tem-perature. After washing, the protein expression was visualized using enhanced chemilumines-cence (ECL kit) and X-ray film (Kodak, USA). β-actin served as the internal control.
ELISA assay
Cell culture medium were diluted with assay diluent. IL-8 (sensitivity: 1 pg/mL) and TNF-α lows: Gn (93 bp); Ugn (150 bp); GC-C (146 bp);
occludin (134 bp); claudin-1 (148 bp); ZO-1 (148 bp); IL-8 (148 bp); TNF-α (122 bp); GAPDH (172 bp). The comparative 2-ΔΔCT method was
used to calculate the relative expression level of each target gene with GAPDH as the internal control.
Western blotting analysis
Western blotting analysis was performed to determine the protein levels of Gn, Ugn, GC-C, occludin, claudin-1, ZO-1, IL-8 and TNF-α. Briefly, the cells were washed with PBS and dis -solved in lysis buffer that contained protease inhibitor. Equal amounts of protein were
[image:4.612.93.521.71.245.2]load-Figure 1. Expression of GC-C in the screening experiment of GC-C shRNA plasmid. Expression of GC-C was deter-mined in cells transfected with GC-C shRNA21, GC-C shRNA22, GC-C shRNA23, GC-C shRNA24 and the correspond-ing empty plasmids respectively. Control: cells without transfection. A. The level of GC-C mRNA was detected by qRT-PCR. Gene expression was normalized to GAPDH mRNA levels in each sample. B. The level of GC-C protein was detected by Western blotting. An unrelated protein β-actin was used as the internal control. *P<0.05, **P<0.01 versus the empty plasmid controls.
Table 1. mRNA expression of Gn, Ugn and GC-C in cells
Gn Ugn GC-C
Empty vector 0.562 ± 0.214 0.488 ± 0.132 0.909 ± 0.351 Gn overexpression 59.536 ± 0.483** 0.504 ± 0.164 1.875 ± 0.312**
Empty plasmid 0.553 ± 0.268 0.492 ± 0.151 0.896 ± 0.273 GC-C shRNA 0.203 ± 0.036# 0.113 ± 0.012# 0.014 ± 0.009##
Blank controls 0.548 ± 0.164 0.459 ± 0.372 0.912 ± 0.285 IL-1β stimulation 0.107 ± 0.054ΔΔ 0.055 ± 0.026ΔΔ 0.263 ± 0.097ΔΔ
Empty vector: cells transfected with the corresponding empty vectors, Gn overex-pression: cells transfected with the Gn overexpression vectors, Empty plasmid: cells transfected with the corresponding empty plasmids, GC-C shRNA: cells transfected with the GC-C shRNA plasmids, Blank controls: cells without treatment, IL-1β stimulation: cells stimulated with IL-1β. Gene expression was normalized to GAPDH mRNA levels in each sample. *P<0.05, **P<0.01 versus the empty vector controls;
#P<0.05, ##P<0.01 versus the empty plasmid controls; ΔP<0.05,ΔΔP<0.01 versus the
blank controls. Data are expressed as mean ± SD. The data are a representative of three independent experiments.
[image:4.612.92.378.351.444.2](sensitivity: 30 pg/mL) levels in cell culture medium were measured with commercially available ELISA kits (RayBiotech, Minneapolis, MN, USA). Kits are specific for human IL-8 and TNF-α respectively.
Statistical analysis
Experiments were performed at least three times. The data are expressed as the mean ± standard deviation (SD). Data among groups were analyzed using one-way analysis of vari-ance (ANOVA) followed by LSD-t post hoc tests or the independent sample t-test, as appropri-ate. Similarly, P<0.05 was regarded as being statistically significant. All statistical analyses were performed by the SPSS 17.0 software (Chicago, USA).
Results
Changes of Gn, Ugn and GC-C in cells with
dif-ferent treatment
The screening experiment was done to pick up the best GC-C shRNA plasmid. After
[image:5.612.95.523.75.327.2]transfec-Figure 2. Immunoblot pictures of Gn, Ugn and GC-C in cells with different treatments. The levels of proteins for Gn, Ugn and GC-C were determined in cells transfected with the Gn overexpression vectors and corresponding empty vectors (A), the GC-C shRNA plasmids and corresponding empty plasmids (B) respectively. (C) Immunoblot analysis of Gn, Ugn and GC-C proteins in cells stimulated with IL-1β and blank controls. Blank controls: cells without treat-ment. β-actin was used as the internal control. The immunoblot pictures are a representative of each group.
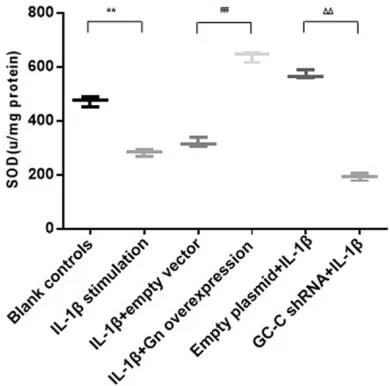
Figure 3. The activity of SOD in cells with different treatments. Blank controls: cells without treatment, 1β stimulation: cells stimulated with 1β, IL-1β+empty vector: IL-1β-treated cells transfected with the empty vectors, IL-1β+Gn overexpression: IL-1β-treated cells transfected with the Gn overexpression vectors, Empty plasmid+IL-1β: cells transfected with the empty plasmids and then stimulated with IL-1β, GC-C shRNA+IL-1β: GC-C-silencing cells stimulated with IL-1β. *P<0.05, **P<0.01 versus the blank controls; #P<0.05, ##P<0.01 versus the empty
vec-tor controls; ΔP<0.05, ΔΔP<0.01 versus the empty
plasmid controls. Data are expressed as mean ± SD.
[image:5.612.91.286.407.600.2]significantly reduced expression of Gn and Ugn except the reduction of GC-C (P<0.05, respec -tively). After exposure to 10 ng/ml IL-1β for 48 h, IL-1β-treated cells had significantly reduced expression of Gn, Ugn and GC-C (P<0.01, respectively).
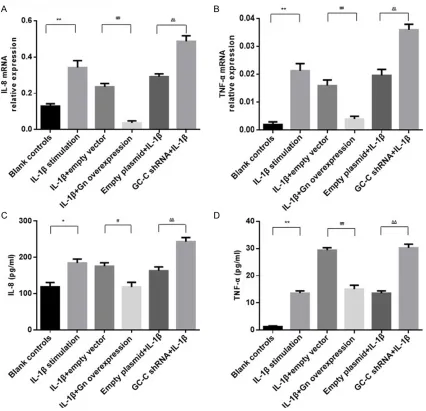
GC-C signaling regulates the activity of SOD and the production of IL-8 and TNF-α in Cells
As shown in Figures 3-5, IL-1β-treated cells had decreased SOD activity and increased expres-sion of IL-8 and TNF-α (P<0.01 compared with tion with the four GC-C shRNA plasmid
[image:6.612.94.520.70.481.2](shRNA21, shRNA22, shRNA23 and shRNA24) for 48 h, the mRNA and protein expression of GC-C in Caco-2 cells was detected. Among these, the interference rate of GC-C shRNA23 was the highest (86%), and it was used for the following experiments (Figure 1). As shown in Table 1 and Figure 2, cells transfected with Gn overexpression vector had increased expres-sion of GC-C except the increase of Gn (P<0.01, respectively). Expression of Ugn had no signifi -cant difference (P>0.05). After transfection with GC-C shRNA, GC-C-silencing cells also had
Figure 4. The levels of IL-8 and TNF-α in different groups. The mRNA expression of IL-8 (A) and TNF-α (B) were de-tected in cells by qRT-PCR. The levels of IL-8 (C) and TNF-α (D) were dede-tected in cell culture medium by ELISA. Groups are the same as described in Figure 3. *P<0.05, **P<0.01 versus the blank controls; #P<0.05, ##P<0.01 versus the
empty vector controls; ΔP<0.05, ΔΔP<0.01 versus the empty plasmid controls. Data are expressed as mean ± SD. The
tor for 48 h, we found that the activity of SOD was elevated and expression of IL-8 and TNF-α was reduced (P<0.01 compared with the empty vector controls). In addition, GC-C-silencing cells had significantly decreased SOD activity as well as increased expression of IL-8 and TNF-α (P<0.01 compared with the empty plas -mid controls). Similar alterations of IL-8 and TNF-α were observed in the cell culture medi -um using ELISA Assay.
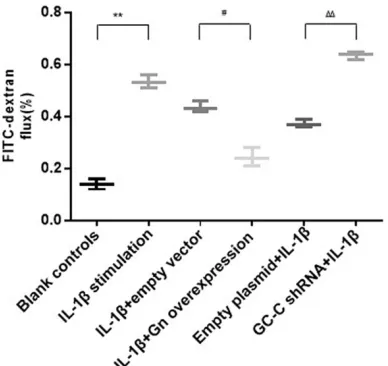
GC-C signaling regulates paracelluar permea-bility and TJPs assembly in Caco-2 monolayers
As shown in Figures 6-8, paracellular permea-bility of Caco-2 monolayers was significantly increased after stimulation with IL-1β. IL-1β-treated cells had decreased expression of clau-din-1 and ZO-1 (P<0.01 compared with the blank controls). After transfection with Gn over-expression vector, the permeability in the Gn overexpression group was significantly decr-eased compared to the empty vector group. IL-1β-treated cells transfected with Gn overex -pression vector had significantly increased expression of claudin-1 and ZO-1 (P<0.01 com -pared with the empty vector controls). Add- itionally, GC-C-silencingcells had significantly higher permeability and lower expression of claudin-1 and ZO-1 than the empty plasmid the blank controls). Then IL-1β-treated cells
were transfected with Gn overexpression
[image:7.612.94.521.71.305.2]vec-Figure 5. Immunoblot pictures of IL-8 and TNF-α in different groups. The levels of proteins for IL-8 and TNF-α were determined in the blank controls and IL-1β stimulation group (A), IL-1β+empty vector and IL-1β+Gn overexpression group (B), Empty plasmid+IL-1β and GC-C shRNA+IL-1β group (C). Groups are the same as described in Figure 3. β-actin was used as the internal control. The immunoblot pictures are a representative of each group.
Figure 6. The paracellular permeability to FITC-dex-tran in Caco-2 monolayers. Paracellular passage of 4 kDa FITC-dextran from apical to basal chamber of Caco-2 monolayers after different treatments. Groups are the same as described in Figure 3. Data are presented as the percentage of the FITC-dextran flux of basal chamber relative to the total flux. *P<0.05, **P<0.01 versus the blank controls;
#P<0.05, ##P<0.01 versus the empty vector controls;
ΔP<0.05, ΔΔP<0.01 versus the empty plasmid
[image:7.612.93.287.376.559.2]ing pathway are down-regulated in both IBD patients and in rats with chemically induced colitis [9, 20, 21]. In addition, cells transfected with Gn overexpression vector had increased expression of GC-C (Table 1 and Figure 2A). GC-C-silencing cells also had reduced expres-sion of Gn and Ugn except for GC-C (Table 1 and Figure 2B). These results suggest that the regulation of the ligands Gn, Ugn and their cor-responding receptor GC-C is combined, the dor-mant GC-C signaling pathway can be restored by the agonists of GC-C.
[image:8.612.93.306.67.476.2]As shown in our study, IL-1β-treated cells had significantly increased levels of IL-8 and TNF-α as well as decreased level of intracellular SOD activity, but after transfection with Gn overex-pression vector, the levels of IL-8 and TNF-α decreased and activity of SOD increased sign- ificantly. Reversely, GC-C-silencing cells had
Figure 7. Expression of occludin, claudin-1 and ZO-1 in cells with different treatments. The mRNA expression of occludin (A), claudin-1 (B) and ZO-1 (C) were detected in cells by qRT-PCR. Groups are the same as described in Figure 3. *P<0.05, **P<0.01 versus the blank controls;
#P<0.05, ##P<0.01 versus the empty vector
controls; ΔP<0.05, ΔΔP<0.01 versus the empty
plasmid controls. Data are expressed as mean ± SD. The data are a representative of three independent experiments.
controls (P<0.01, respectively). But expression of occludin had no significant difference among different groups (P>0.05, respectively).
Discussion
signal-more IL-8 and TNF-α levels as well as less SOD activity than the empty plasmid controls induced by IL-1β (Figures 3-5). IL-8, the neutro-phil chemoattractant and activator, is increased in inflamed intestinal mucosa of IBD, and is associated with the macroscopic grade of local inflammation in mucosal tissue of patients with UC [22, 23]. TNF-α is an important proinflam -matory cytokine involved in inflam-matory res-ponses and increased in intestinal tissues of patients with IBD [24]. During inflammation, high levels of reactive oxygen species (ROS) can decrease the production and activity of SOD [25]. SOD is antioxidant enzymes that counteracts the harmful effects of ROS [26]. Thus, our findings confirm that the inflamm-atory injury induced by IL-1β in Caco-2 cells can be mitigated by restitution of the dormant GC-C pathway. Loss of GC-C signaling could in turn exacerbate the inflammatory injury of intestine.
Additionally, our studies found that the paracel-lular permeability of IL-1β-treated cell monolay -ers was reduced and expression of claudin-1 and ZO-1 was increased after transfection with
[image:9.612.93.520.71.330.2]Gn overexpression vector. In the effect of IL-1β, GC-C-silencing cells had elevated permeability and decreased expression of claudin-1 and ZO-1 compared to the empty plasmid controls. But expression of occludin had no significant difference among groups (Figures 6-8). TJPs regulate the barrier function of IECs, which con-trol the penetration of pathogens and allerg-ens to the submucosa and beyond [27, 28]. Amongst many components of TJPs, occludin, claudins and ZO-1 are membrane proteins that connect adjacent IECs and build the epithelial barrier [29, 30]. Similar results have been des- cribed in the previous studies, showing that elimination of GC-C or Ugn in mice increased the intestinal permeability, with reduced exp- ression of junctional proteins, activation of GC-C signaling in mice decreased the barrier permeability associated with increased junc-tional proteins [10, 11]. Our findings demon -strated that GC-C signaling defends the epithe-lial barrier function of intestine by regulating tight junctions’ assembly. The precise mecha-nisms elucidating how GC-C signaling is inv- olved in the regulation of TJPs is the basis for ongoing investigation.
Conclusions
GC-C signaling pathway plays a protective role in the intestinal inflammatory injury and ep-ithelial barrier function in Caco-2 cells. In light of the important role of the intestinal barrier dysfunction in the genesis of human IBD. These observations further support that GC-C sign- aling pathway might be implicated in the pa- thogenesis of IBD and the emerging clinical development of oral GC-C agonists might be used for IBD.
Acknowledgements
This work was supported by National Natural Science Foundation of China (81260074, 811-60055), Social development of science and technology projects of Yunnan Province (2013- CA021), Foundation of Yunnan Institute of Digestive Disease (2014NS123, 2016NS002). Kunming Engineering Research Center of Dig- estive Disease (2015-3-A-02243). Innovation foundation of PhD student of Kunming Medical University.
Disclosure of conflict of interest
None.
Address correspondence to: Dr. Yinglei Miao, Department of Gastroenterology, The First Affilia- ted Hospital of Kunming Medical University, 295 Xichang Street, Kunming 650032, China. Tel: +86-871-65324888; Fax: +86-871-65336015; E-mail: myldu@sina.com
References
[1] Baumgart DC, Sandborn WJ. Crohn’s disease. Lancet 2012; 380: 1590-1605.
[2] Ordás I, Eckmann L, Talamini M, Baumgart DC, Sandborn WJ. Ulcerative colitis. Lancet 2012; 380: 1606-1619.
[3] Meier J, Sturm A. Current treatment of ulcer-ative colitis. World J Gastroenterol 2011; 17: 3204-3212.
[4] Lin JE, Valentino M, Marszalowicz G, Magee MS, Li P, Snook AE, Stoecker BA, Chang C, Waldman SA. Bacterial heat-stable enterotox-ins: translation of pathogenic peptides into novel targeted diagnostics and therapeutics. Toxins 2010; 2: 2028-2054.
[5] Brierley SM. Guanylate cyclase-C receptor acti-vation: unexpected biology. Curr Opin Pharma-col 2012; 12: 632-640.
[6] Basu N, Arshad N, Visweswariah SS. Receptor guanylyl cyclase C (GC-C): regulation and
sig-nal transduction. Mol Cell Biochem 2010; 334: 67-80.
[7] Field M. Intestinal ion transport and the patho-physiology of diarrhea. J Clin Invest 2003; 111: 931-943.
[8] Navaneethan U, Giannella RA. Mechanisms of infectious diarrhea. Nat Clin Pract Gastroen-terol Hepatol 2008; 5: 637-647.
[9] Lan D, Niu J, Miao J, Dong X, Wang H, Yang G, Wang K, Miao Y. Expression of guanylate cy-clase-C, guanylin, and uroguanylin is downreg-ulated proportionally to the ulcerative colitis disease activity index. Sci Rep 2016; 6: 25034. [10] Han X, Mann E, Gilbert S, Guan Y, Steinbrecher KA, Montrose MH, Cohen MB. Loss of guanylyl cyclase C (GCC) signaling leads to dysfunction-al intestindysfunction-al barrier. PLoS One 2011; 6: e16139.
[11] Lin JE, Snook AE, Li P, Stoecker BA, Kim GW, Magee MS, Garcia AV, Valentino MA, Hyslop T, Schulz S, Waldman SA. GUCY2C opposes sys-temic genotoxic tumorigenesis by regulating AKT-dependent intestinal barrier integrity. PLoS One 2012; 7: e31686.
[12] Steinbrecher KA, Harmel-Laws E, Garin-Laflam MP, Mann EA, Bezerra LD, Hogan SP, Cohen MB. Murine guanylate cyclase C regulates co-lonic injury and inflammation. J Immunol 2011; 186: 7205-7214.
[13] Harmel-Laws E, Mann EA, Cohen MB, Stein-brecher KA. Guanylate cyclase C deficiency causes severe inflammation in a murine model of spontaneous colitis. PLoS One 2013; 8: e79180.
[14] Romier B, Van De Walle J, During A, Larondelle Y, Schneider YJ. Modulation of signalling nucle-ar factor-κB activation pathway by polyphenols in human intestinal Caco-2 cells. Br J Nutr 2008; 100: 542-551.
[15] Li C, Lun W, Zhao X, Lei S, Guo Y, Ma J, Zhi F. Allicin Alleviates Inflammation of Trinitroben-zenesulfonic Acid-Induced Rats and Suppress-es P38 and JNK Pathways in Caco-2 Cells. Me-diators Inflamm 2015; 2015: 434692. [16] Sun H, Chow EC, Liu S, Du Y, Pang KS. The
Caco-2 cell monolayer: usefulness and limita-tions. Expert Opin Drug Metab Toxicol 2008; 4: 395-411.
[17] Liu H, Li M, Wang P, Wang F. Blockade of hy- poxia-inducible factor-1α by YC-1 attenuates interferon-γ and tumor necrosis factor-α-induced intestinal epithelial barrier dysfunc-tion. Cytokine 2011; 56: 581-588.
[18] Liu H, Wang P, Cao M, Li M, Wang F. Protective role of oligomycin against intestinal epithelial barrier dysfunction caused by IFN-γ and TNF-α. Cell Physiol Biochem 2012; 29: 799-808. [19] Camilleri M. Guanylate cyclase C agonists:
[20] Wu F, Dassopoulos T, Cope L, Maitra A, Brant SR, Harris ML, Bayless TM, Parmigiani G, Chakravarti S. Genome-wide gene expression differences in Crohn’s disease and ulcerative colitis from endoscopic pinch biopsies: in-sights into distinctive pathogenesis. Inflamm Bowel Dis 2007; 13: 807-821.
[21] Brenna Ø, Bruland T, Furnes MW, Granlund Av, Drozdov I, Emgård J, Brønstad G, Kidd M, Sandvik AK, Gustafsson BI. The guanylate cy-clase-C signaling pathway is down-regulated in inflammatory bowel disease. Scand J Gastro-enterol 2015; 50: 1241-1252.
[22] Daig R, Andus T, Aschenbrenner E, Falk W, Schölmerich J, Gross V. Increased interleukin 8 expression in the colon mucosa of patients with inflammatory bowel disease. Gut 1996; 38: 216-222.
[23] Mazzucchelli L, Hauser C, Zgraggen K, Wagner H, Hess M, Laissue JA, Mueller C. Expression of interleukin-8 gene in inflammatory bowel dis-ease is related to the histological grade of ac-tive inflammation. Am J Pathol 1994; 144: 997-1007.
[24] Zipperlen K, Peddle L, Melay B, Hefferton D, Rahman P. Association of TNF-α polymor-phisms in Crohn disease. Hum Immunol 2005; 66: 56-59.
[25] Kruidenier L, Verspaget HW. Oxidative stress as a pathogenic factor in inflammatory bowel disease-radicals or ridiculous? Aliment Phar-macol Ther 2002; 16: 1997-2015.
[26] Zhu H, Li YR. Oxidative stress and redox signal-ing mechanisms of inflammatory bowel dis-ease: updated experimental and clinical evi-dence. Exp Biol Med 2012; 237: 474-480. [27] Turner JR. Intestinal mucosal barrier function
in health and disease. Nat Rev Immunol 2009; 9: 799-809.
[28] Matter K, Balda MS. Signalling to and from tight junctions. Nat Rev Mol Cell Biol 2003; 4: 225-237.
[29] Mitic LL, Anderson JM. Molecular architecture of tight junctions. Annu Rev Physiol 1998; 60: 121-142.