The study of volatile organic compounds in urban and
indoor air
CLARKSON, Paul Jonathan
Available from Sheffield Hallam University Research Archive (SHURA) at: http://shura.shu.ac.uk/3116/
This document is the author deposited version. You are advised to consult the publisher's version if you wish to cite from it.
Published version
CLARKSON, Paul Jonathan (1998). The study of volatile organic compounds in urban and indoor air. Doctoral, Sheffield Hallam University.
Copyright and re-use policy
REFERENCE
neiurn 10 Learning wc»uw
____
Fines are charged at 50p per hour
2 5 map ?n03
k
3C1.
2
5 MAR 2003
3 I MAP ?003
c b f
- 1 APR 2003
, n V
? 0 MAY 2003
- 3 APR 2003
^T2) . /H i
---.
- APR 2003 ^ / v ,
2 9 APR
m i
ProQuest Number: 10694355
All rights reserved
INFORMATION TO ALL USERS
The quality of this reproduction is dependent upon the quality of the copy submitted.
In the unlikely event that the author did not send a com plete manuscript and there are missing pages, these will be noted. Also, if material had to be removed,
a note will indicate the deletion.
uest
ProQuest 10694355
Published by ProQuest LLC(2017). Copyright of the Dissertation is held by the Author.
All rights reserved.
This work is protected against unauthorized copying under Title 17, United States C ode Microform Edition © ProQuest LLC.
ProQuest LLC.
789 East Eisenhower Parkway P.O. Box 1346
The Study of Volatile Organic Compounds
in Urban and Indoor Air
Paul Jonathan Clarkson
A thesis submitted in partial fulfilment of the requirement of
Sheffield Hallam University
for the degree of Doctor of Philosophy
Abstract
Chapter 1 is a review of the literature concerning the study of volatile organic compounds in the atmosphere. It examines the basic chemistry of the atmosphere and the roles that organic compounds play in it. Also investigated are the methods of sampling and analysing the volatile organic compounds in the air, paying particular attention to the role of solid phase sampling. Chapter 1 also examines the role of volatile organic compounds on air quality.
Chapter 2 describes the experimental procedures that were employed during the course of this research project.
Chapter 3 examines a multi-method approach to the study of volatile organic compounds in urban and indoor air. The methods employed were capillary electrophoresis, high performance liquid chromatography and gas chromatography. Although good results were obtained for the various methods that were investigated Chapter 3 concludes that a more unified analytical approach is needed to the study of the air.
Chapter 4 investigates the possibilities of using a unified approach to the study of VOC's. This is achieved by the development of an air sampling method that uses solid phase extraction cartridges. By investigating many aspects of air sampling mechanisms the results show that a simple yet efficient method for the sampling of VOC in air has been developed. The SPE method is a reusable, yet reliable method that by using sequential solvent desorption has been shown to exhibit some degree of selectivity. The solid phase that gave the best results was styrene-divinyl benzene however other phases were also investigated.
The use of a single gas chromatography method was also investigated for the purpose of confirmatory identification of the VOC's. Various detection systems were used including MS and AED. It was shown that by optimising the GC's it was possible to get complimentary results.
Also investigated was the possibility of compound tagging in an attempt to confirm the identity of several of the compounds found in the air.
actual data it is possible to show the origin of the air sample in a simple yet effective way using air fingerprints.
Also discussed is the Individual Component Air Quality Index, this is a method of quantifying air quality. By taking into account compound toxicity, atmospheric lifetime and UV exposure, the ICAQI, it is argued, is a technique that presents a more accurate picture of air quality.
1. CHAPTER 1 - INTRODUCTION 17
1.1 The Atmosphere and the Earth
1.1.1 The Biosphere
1.1.2 Biospheric Cycles 19
1.1.3 Atmospheric Chemistry 20
1.2 The Role of Organic Compounds in the Atmosphere 30
1.2.1 Carbonyl Compounds 31
1.2.2 Organic Acids 36
1.3 Sampling Methods for Volatile Organic Compounds in Air 43
1.3.1 Introduction 43
1.3.2 Sorbent Air Sampling Mechanisms 53
1.4 Analysis of Air Samples 61
1.4.1 Introduction 61
1.4.2 Aqueous Phase Samples 62
1.4.3 Organic Phase Samples 68
1.5 Air Quality 73
1.5.1 Introduction 73
1.5.2 Environmental Factors of Air Quality 73
1.5.3 Health Factors 77
1.5.4 Air Quality Issues 87
2. CHAPTER 2 - EXPERIMENTAL 89
2.1 Capillary Electrophoresis
90
2.1.1 Determination of Organic Acids by CZE
2.2 Liquid Chromatography 91
2.2.1 Determination of Carbonyls as DNPH Derivatives by HPLC 91
2.2.2 The Determination of Phenols by HPLC 91
2.3 General Gas Chromatographic Methods 92
2.3.1 General AED Analysis 92
2.3.2 General GC-MS Analysis 92
2.4 Specific Gas Chromatographic Methods 93
2.4.1 Automated Thermal Desorption-Gas Chromatography 93
2.4.2 Manual Thermal Desorption-Gas Chromatography 93
2.4.3 Direct Headspace Analysis 94
2.5 Air Sampling Methods 94
2.5.1 Organic Acids - Impinger 94
2.5.2 Carbonyls - Impinger 94
2.5.3 Quartz Filters 94
2.5.4 Solid Phase Extraction Cartridges 95
3. CHAPTER 3 - MULTI METHOD APPROACH 96
3.1 Introduction 97
3.2 Capillary Electrophoretic Methods ^
3.2.1 Background
3.2.2 Phthalate Buffer Development 103
3.2.3 Borax Buffer Development 107
3.2.4 Applications 117
3.2.5 Conclusions 120
3.2.6 Determination of Carbonyls 121
3.2.7 Determination of Phenols - 131
3.2.8 Results 133
3.3 Gas Chromatographic Determinations 134
3.3.1 Introduction 134
3.3.2 Cryogenic Focusing 135
3.3.3 GC-AED 137
3.3.4 Programmable Injector Thermal Desorption 140
3.4 1.1 Conclusions 144
4. CHAPTER 4 - SINGLE METHOD APPROACH 145
4.1 Sampling
4.1.1 Introduction 146
4.1.2 Styrene-Divinyl Benzene 148
4.1.4 Conclusion 173
4.2 Analysis 175
4.2.1 Introduction 175
4.2.2 Chromatographic Optimisation 176
4.2.3 Total Air Analysis 184
4.2.4 Conclusions 194
5. CHAPTER 5 - DATA ANALYSIS 195
5.1 Introduction 196
5.2 Air Fingerprinting 197
5.2.1 Introduction 197
5.2.2 Background 197
5.2.3 Results 197
5.2.4 Conclusion 202
5.3 Air Quality Index (AQI) 203
5.3.1 Introduction 203
5.3.2 Individual Component Weighting 203
5.3.3 Individual Component Air Quality Indices 206
6. CHAPTER 6 - CONCLUSION
6.1 Introduction
6.2 The Role of Organic Compounds... 210
6.2.1 ...in the Atmosphere 210
6.2.2 ...in air quality 211
211 6.3 Development of Analytical Techniques
213 6.3.1 Data Presentation
Table of Figures
1 g Figure 1-1 - A Chart Showing the Comparison of Planetary Atmospheres
--20 Figure 1-2 - The Carbon Cycle
Figure 1-3 - Oxidation States of Carbon 21
Figure 1-4 - Radical Abstraction 24
Figure 1-5 - A Diagram Showing the Photochemical Oxidation of Xylene 25 Figure 1-6 - A Diagram Showing the Simplified Hydroxyl Addition Mechanisms for
Toluene 25
Figure 1-7 - A Diagram Showing the Photochemical Oxidation of Toluene 26 Figure 1-8 - Chart Showing Daily Formaldehyde Variations during a Smog Episode 35 Figure 1-9 - Chart Showing Daily Formic: Acetic Acid Ratio Variations 39 Figure 1-10 - A Chart Showing the Seasonal Formic and Acetic Acids Variations 40
Figure 1-11 - A Diagram Showing the Structure of Tenax 49
Figure 1-12 - A Diagram Showing the Structure of XAD 50
Figure 1-13 - A Lennard-Jones Plot for Molecular Repulsion/Attraction 55
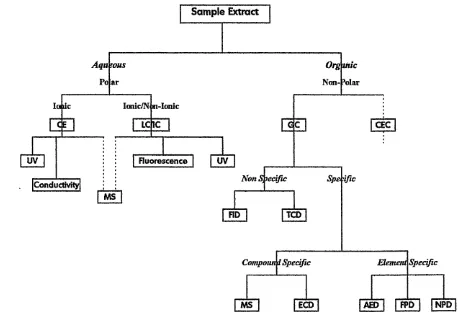
Figure 1-14 - Analytical Techniques Flow Chart 62
Figure 1-15 - Carbonyl/Hydrazone Derivatisation 64
Figure 1-16 - Chart Showing Gradient HPLC Program 65
Figure 1-17 - A Diagram of the Respiratory System 78
Figure 1-18 - Diagram Showing Daily Carbon Monoxide Variations 82
Figure 1-19 - Diagram Showing Percentage Occurrence of Symptoms of SBS 87 Figure 3-1 - Chart Showing the Chemical Composition of Air by Compound Class 97 Figure 3-2 - Chart Showing the Methods for the Determination of Organic Acids in Aii 98
Figure 3-3 - Chart Showing the Effects of pH on Ion Mobility 100
Figure 3-4 - Diagram Showing the Surface of Capillary Wall 101
Figure 3-5 - Diagram of Cationic Surfactant Flow Modifier at the Capillary Wall 102 Figure 3-6 - Diagram Showing the Formation of Hemimicelles in the Capillary 102 Figure 3-7 - Diagram Showing the Electrophoretic Mobilities of Different Ions 103 Figure 3-8 - Graph Showing Reproducibility of Phthalate Buffer System 107
Figure 3-9 - Graph Showing a Comparison of Buffer Currents 108
Figure 3-10 - Borax Buffer Electropherogram of Organic Acids in Urine 110
Figure 3-13 - Chart Showing Optimum the Separation Voltage and Current 112 Figure 3-14 - Chart Showing the Effects of Voltage on Mobility 113 Figure 3-15 - Chart showing Current versus Time During an Electrophoretic Run 114 Figure 3-16 - Chart Showing "Capacity" Ratio for Consecutive Electrophoretic Runsll5
Figure 3-17 - Chart Showing the Effects of OFM on Separation 116
Figure 3-18 - Chart Showing the Methods of Determination of Carbonyl Compounds in
Air 122
Figure 3-19 - Structures of Carbonyl Groups 123
Figure 3-20- Resonance Structure of the Carbonyl Group 123
Figure 3-21 - Diagram Showing the Modified Carbonyl Structure 123
Figure 3-22 - Comparison of Boiling Points of Carbonyls with Alkanes 124
Figure 3-23 - Diagram Showing Keto-Enol Equilibria 125
Figure 3-24 - Diagram Showing the Enolate Ion 125
Figure 3-25 - Diagram Showing the Mechanism for Acid Catalysed Enolisation 125 Figure 3-26 - Diagram Showing the Mechanism for the Formation of an Imine 126
Figure 3-27 - Diagram Showing the Formation of Aromatic Imines 126
Figure 3-28 - Diagram Showing Other Nitrogen Containing Compounds 127 Figure 3-29 - Mechanism for Reaction of Substituted Ammonia with Carbonyls 127 Figure 3-30 - Chromatograms showing DNPH Derivatives of lOppm Formaldehyde and
Solvent Blank 128
Figure 3-31 - Chromatogram showing DNPH Derivative of a Spiked Carbonyl Extract 129 Figure 3-32 - Chromatogram showing DNPH Derivatised Carbonyls in Tobacco Smoke. 131 Figure 3-33 - Chart Showing the Method of Determination of Phenols 133
Figure 3-34 - Diagram Showing the Pre-concentration Apparatus 134
Figure 3-35 - Diagram Showing the Cryogenic-Focusing ApparatusResults 137 Figure 3-36 - Chromatogram showing Air Peak for Cryogenic Focusing Experimentl38
Figure 3-37 AED Chromatograms from Cryogenically Sample Air 139
Figure 4-4 - Chromatogram of Dichloromethane Extract of SDB Sampled Indoor Air 150 Figure 4-5 - Extracted Ion Chromatograms from SDB Sampled Indoor Air 151 Figure 4-6 - Chromatogram Showing a Pentane Extract from SDB in A Sequential
Desorption Experiment 153
Figure 4-7 - Chromatogram Showing a Dichloromethane Extract from SDB in A
Sequential Desorption Experiment 153
Figure 4-8 - Chart Showing SDB Breakthrough Results 155
Figure 4-9 - Diagram Showing Simple Monochlorosilane Chemistry 162
Figure 4-10 - Diagram Showing Trichlorosilane Chemistry 163
Figure 4-11 - Diagram Showing the Structure of Octadecyl Silica 164 Figure 4-12 - Diagram Showing the Structure of Propyl Amino Silica 165
Figure 4-13 - Diagram Showing the Structure of Diol Silica 165
Figure 4-14 - Schematic Diagram of the Silica Surface 170
Figure 4-15 - Diagram Showing a Laboratory Distillation System 177
Figure 4-16 - Chart Showing the Van Deemter Plot for He Carrier Gas 182 Figure 4-17 - Chart Showing the Van Deemter Plot for N2 Carrier Gas 183
Figure 4-18 - Library Mass Spectra of Decane 184
Figure 4-19 - Library Mass Spectra of Decanal 184
Figure 4-20 - Mass Spectrum of 1,4-dichlorobenzene obtained from an Indoor Air
Sample 185
Figure 4-21 - Mass Spectrum of Cyclohexanone - Xylene Peak 186
Figure 4-22 - Atomic Emission Chromatograms for Indoor Air Sample looking at the
Ci93nm and Cl479nm Emission Lines 187
Figure 4-23 - Emission Chromatograms for an Indoor Air Sample looking at the Ci93nm
and 0777nm Emission Lines 188
Figure 4-24 - Reaction Scheme for the Derivatisation of Carbonyls using PFBOA 190 Figure 4-25 - Chromatogram of a Series of PFBOA-Aldehyde Derivatives 191 Figure 4-26 - Chromatogram of a Series of PFBOA-Ketone Derivatives 192 Figure 4-27 - Chromatograms showing PFBOA Derivatives of Carbonyls in Real and
Spiked Air Samples 193
Figure 5-1 Basic Fingerprints of Urban and Indoor Air Samples
Figure 5-2 - Fingerprints of Two Different Indoor Air Samples Figure 5-3 - Comparison of Indoor and Outdoor Fingerprints
Table of Tables
Table 1-1 - Carbonyl Compounds and their Sources
Table 1-2 - Organic Acid Prescursors 37
Table 1-3 - Specific Bonding Energies 56
Table 1-4 - Hydrogen Bond Strengths 59
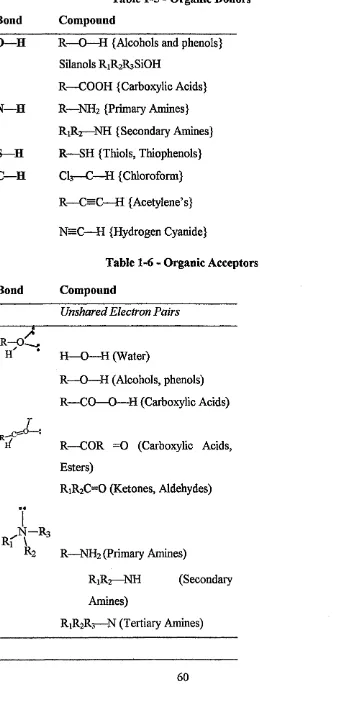
Table 1-5 - Organic Donors 60
Table 1-6 - Organic Acceptors 60
Table 1-7 - ECD Halogen Electron Affinities 70
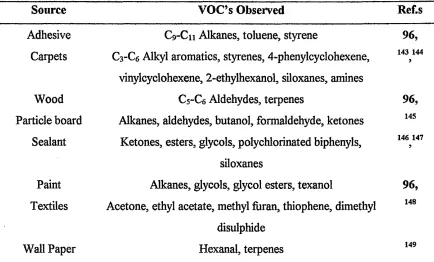
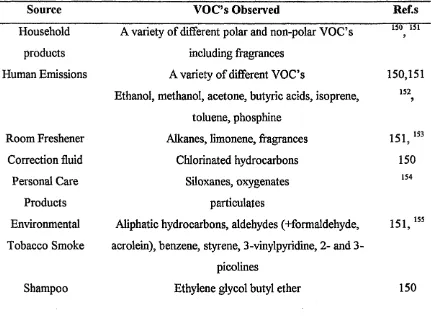
Table 1-8 - Sources of Volatile Organic Compounds from Building Materials 75 Table 1-9 - Sources of Volatile Organic Compounds from Human Activity 76
Table 1-10 - Table Showing Classes of Bioeffluent 76
Table 1-11 - Effects of Carboxyhaemoglobin Saturation 81
Table 1-12 - Estimated Toluene Exposure Levels 84
Table 1-13 - Contributions to Formaldehyde Exposure 86
Table 3-1 - Experimental Conditions Using the Phthalate Buffer
Table 3 -2 - Initial Results for Acetate Ion using Phthalate Buffer 103
104
Table 3-3 - Peak Area Ratios 105
Table 3-4 - Experimental Conditions Using the Borax Buffer 108
Table 3-5 - Peak Area Reproducibility 116
Table 3-6 - Acetic Acid in Air Samples 118
Table 3-7 - Neo-natal Urine Samples 119
Table 3-8 - PTI Thermal Desorption Compounds 143
Table 4-1 - Identification of Compounds on SDB 150
Table 4-2 - SDB Reproducibility 156
Table 4-3 - Compounds Observed in Domestic Air (8151) 158
Table 4-4 - Compounds found in Workplace Air 159
Table 4-5 - Compounds Observed in Outdoor Air 161
Table 4-6 - Expected Bonding Mechanislns 166
Table 4-7 - Pentane Extract Results 168
Table 4-8 - Dichloromethane Extract 172
Table 4-10- Optimum Flow Rates 183
Table 5-1 - Mass Fragment Ions used for Initial Fingerprints 197
Table 5-2 - Individual Component Weighting Examples 204
Preface
Volatile organic compounds and air quality have long been linked yet, for all the work it seems we have achieved little in way of understanding. Examining the vital, yet often unacknowledged, roles that these compounds play in the life of the atmosphere it is found that the composition of the atmosphere is a dynamic mixture, in a constant state of motion.
It is also found that there are many ways of measuring the compounds in the air, and that each method has it's own followers. It was found, though, that for all the work on new methods, little was achieved in understanding of the air. Yet after all that, it is often found that the people who require them does not understand the results we produce.
The work contained within this thesis, then, is the result of a journey: a journey through science. To study volatile organic compounds in urban and indoor air requires the knowledge and use of many aspects of science: From environmental chemistry to physics to analytical science to medicine. It was a journey to understand what is happening in the air, to determine how to measure it efficiently and simply and then to present it in a way for all to understand. It is with these three aims in mind that we started our work:
The Study of Volatile Organic Compounds in Urban and Indoor Air.
Acknowledgement
I would like to acknowledge the following: my main supervisor Professor Mike Cooke who allowed me the freedom to develop my ideas and my thoughts into reality, although crazy at times some of them worked! To my second supervisor Dr Malcolm Clench, who though remaining in the background, was a useful source of information when asked. I would also like to acknowledge the assistance of Dr David Crowther, for help and encouragement, especially in the latter stages of the project. To Dr Pete Drew for the friendly advice, especially on the environmental stuff. And to the technical expertise of Mrs Joan Hague, overworked and underpaid, who through thick and thin would always pull the instruments through.
Author’s Declaration
The results and opinions described within this thesis are those of the author,
other material used in the discussion has been attributed to the works author
Chapter 1
1.1 The Atmosphere and the Earth
1.1.1 The Biosphere
The Earth is unique in our solar system, in having an oxidising atmosphere. With this type of atmosphere most compounds are oxidised, and it is expected that the most predominant oxidised species should be NOx, SOx and COx. However dioxygen and dinitrogen are the predominant atmospheric molecular species, with a geochemical balance being maintained at approximately 78% dinitrogen and 20% dioxygen.1 (Figure 1-1)
o
©
§
.■30
1 o
xO
©X
Venus Earth Mars
—©— Carbon Dioxide —H— Dinitrogen —©—Dioxygen
Figure 1-1 - A Chart Showing the Comparison of Planetary Atmospheres
Unlike Venus and Mars, which have oxidised atmospheres, Earth is special, and special for one reason. It has life. Without life the atmospheric gases would tend towards equilibrium, with the atmospheric dinitrogen being oxidised, and the dioxygen reduced.2 The maintenance of this disequilibrium is through the actions of living organisms. The majority of the 1018kg of dioxygen present in the atmosphere originates from photosynthesis in plants, whereas the dinitrogen is present from the actions of nitrogen fixing bacteria.3
The atmosphere of Earth at present contains concentrations of O2 and CH4, that resemble a combustible mixture, whereas Venus and Mars, possess atmospheres that resemble the products of combustion.4
is an important concept in understanding how the planet, and specifically the atmosphere, functions.
Lovelock and Margulis2 suggested in their Gaia hypothesis that the whole biosphere can be treated as a living organism. By examining the Earth in this way, it can be assumed that any reduced organic compounds that are present in the atmosphere will be oxidised back to carbon dioxide as part of the biospheric cycles, in a way that is similar to the traditional definition of life. Simultaneously, the carbon dioxide is being reduced to produce more complex organic compounds, and the cycle continues. As a result it can be seen that Earth’s chemistry and composition is more complicated and delicately balanced than is often assumed. The Gaia theory assumes that all life is interdependent. This treatment, however, does not consider the effects the cycles have on humans or, more importantly, the effects we humans have on the biospheric cycles.
1,1.2 Biospheric Cycles
Oxygen, nitrogen, and carbon are the key elements that are cycled through the biosphere. The carbon cycle5 is of greatest interest when considering the role of organic compounds in the Earth’s atmosphere. At present the energetics of the biosphere depend on the reduction of carbon dioxide to organic compounds and dioxygen through the action of photosynthesis. This process takes the general form:
«C02 + 2riHiA + ENERGY -> (CH20)w + n k i + nRiO (1.1)
Where A can be either oxygen(O) orin the case of sulphur photosynthesising bacteria(S). Geochemically, photosynthesis produces the oxidised part of the biosphere, specifically the atmosphere and oceans, with the more reduced part being in the bodies of organisms and their decomposition products.
^ Volatile Oxygenated Organic Compounds
_
CO ^
Photosynthesis ^ Atmospheric Oxidation. . . .
£
Volatile Organic Compounds
♦ A n th ro p o g flc Emissions Rotting BiomassFigure 1-2 - The Carbon Cycle
Since the industrial revolution this balance has been altered by an excessive increase in emitted volatile organic compounds and atmospheric carbon dioxide. The result of the increase in atmospheric carbon dioxide and the subsequent increase in global temperature is known as the greenhouse effect and is the topic of both political and scientific debate.
Besides the issue of climate change, the increase in anthropogenic emissions has brought the issue of air quality to the attention of the public and the scientific communities.
Understanding air quality, the carbon cycle and climate changes are all dependent on knowledge of how the atmosphere functions at a molecular level. The chemistry of the atmosphere is not dissimilar to any other chemistry, but due to the abundance of radical reactions, tends to be held at arms length by many scientists. In understanding the sources and sinks of compounds in the atmosphere we, as scientists, can be more specific in what we investigate.
1,1.3 Atmospheric Chemistry
The atmospheric chemistry of organic compounds is a wide and complicated field, embracing both organic and physical chemistries. As already stated, the atmosphere of the earth is oxidising, so the organic compounds take a route through the atmosphere from reduced to oxidised form.
CH4 ^CH3OH CH2O ► HCOOH
-4
-1
0
+3
Figure 1-3 - Oxidation States of Carbon
There is a wide body of research into the atmospheric oxidation of organic compounds. These studies range from kinetic data8 to detailed mechanisms and atmospheric routes.
The chemistry of the atmosphere is a combination of photochemistry, free radical chemistry and covalent chemistry. Of the three it is free radical and photochemistry that dominate the majority of the free radical reactions or chemistry.
1.1.3.1 Photochemistry
The energy required for the photochemistry that takes place in the atmosphere originates with the Sun. The Sun emits a wide spectrum of electromagnetic energy, but only the visible and ultra-violet regions are of any real importance when considering photochemistry.
The basic principle that drives photochemical reactions is the adsorption, by a molecule, of a photon of energy that leads to the electronic excitation of that molecule. This may be expressed as:
-AB + hv -> AB* (1.2)
Where AB is an atmospheric molecule, hv is a photon of energy and AB* represents the molecule in an excited electronic state. The excited molecule, AB*, can then become de- cxcited in a variety of ways, the outcome of which determines the overall type of reaction. The main de-excitation pathways are fragmentation, luminescence, energy transfer, quenching and reaction.
AB+ hv-> AB* A + B r} (1.3)
Any excess energy remaining from the bond breaking might be transferred to one of the fragments, leaving it in an excited state.
For ionisation to occur the excited molecule must lose an electron, thus becoming de-excited. This type of reaction is most prevalent in the upper atmosphere, and is rarely seen in the chemistry of the troposphere.
Luminescence is when the photon is re-emitted from the molecule. This is represented in the form
AB + hv -> AB* AB + hv (1.4)
In the atmospheric photochemistry of organic compounds, there are two reactions that are of primary importance. These are the photolysis of ozone and the photolysis of formaldehyde.
In the photolysis of formaldehyde, the molecule dissociates to produce a hydrogen radical, H* and the formyl radical, HCO\(1.5) The formyl radical, independent of temperature, reacts rapidly with atmospheric dioxygen to produce carbon monoxide and a hydroperoxy radical, H02' .(L6)9 Another hydroperoxy radical is formed with the reaction of atmospheric dioxygen and the hydrogen radical.(1.7)
The reaction scheme is completed with the formation of the hydroxyl radical, OH’, as the hydroperoxy radicals react with atmospheric nitric oxide, NO. (1.8)
CH20 + hv---►*HCO + *H (L5)
‘H C O + O2 ---^ ‘H02 + CO (1.6)
‘ H + O2 (+M)--- H02 (+M) (1.7)
‘HO2 + NO --- N02+ ‘H0 (1.8)
O3 + hv O2 + O --- ► O2 + O
O* + H20 ---► 2HO* <uo)
Where O* represents an excited oxygen atom. The energetic state of the oxygen atom formed has been examined at a quantum level11, from which the important point to note is that 0*atom is more reactive than the ground state O atom and thus reacts with atmospheric
water to produce two hydroxyl radicals. (1.10)
1.1.3.2 The Hydroxyl Radical
As shown by the two examples above the hydroxyl radical is an important atmospheric species. It can be formed by a large number of different photochemical reactions, with the two most important already being discussed. The photolysis of formaldehyde is the dominant source of hydroxyl radicals in polluted air whilst the photolysis of ozone is dominant in clean air.12
The hydroxyl radical undergoes reactions with most atmospheric species, leading to secondary pollutants being formed which, as will be discussed, can often be more physiologically harmful and more environmentally harmful than the primary pollutants.
1.1.3.3 Reactions of Aromatics
Benzene, toluene and the xylenes (BTX) are considered to be priority primary pollutants and as such are monitored at their emission sources. Reactions, primarily with the HO* radical, NOx and ozone, cause the photooxidation of BTX to secondary pollutants. According to the literature toluene is the most abundant non-methane hydrocarbon in the urban atmosphere.13 Bearing this in mind the degradation products and chemistries are of
vital importance in understanding the atmospheric behaviour of aromatic compounds.
Research by Dumdei and O’Brien13 has shown that toluene, under simulated
atmospheric conditions can degrade to at least 27 identifiable compounds. Amongst the by products of the degradation, phenol, cresol, and formaldehyde phenol, cresol and formaldehyde which are all considered as priority pollutants. The reaction mechanisms involved are not fully understood for all the compounds found.
the hydroxyl radical radical reactions with ortho- and meta- xylenes have found that both addition and abstraction are taking place simultaneously.
1.1.3.3.1 Abstraction
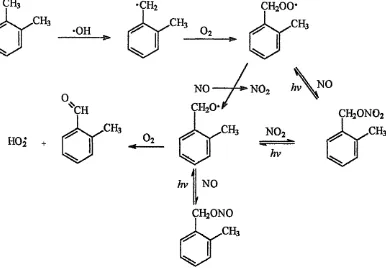
In abstraction the hydroxyl radical attacks a methyl hydrogen yielding a methylbenzyl radical and water. ( U l )
Under atmospheric conditions, oxygen will react rapidly with the methylbenzyl radical to form the appropriate methylbenzylperoxy radical. Subsequent reactions yield tolualdehydes, methylbenzyl nitrates and nitrites. (Figure 1-4.) The rapid photolysis of methylbenzyl nitrites means that their atmospheric chemistry can be considered unimportant. Further reactions of the tolualdehydes are thought to lead to nitrated methyl phenols and benzoquinones.
Methylbenzyl Radical
u
CH200*
N02 /7v\ N °
ch3 no2
ch2ono <ch3
hv
ch2ono2
kj
Figure 1-5 - A Diagram Showing the Photochemical Oxidation of Xylene
Leone and Seinfeld15 have shown that analogous reaction mechanisms occur for the atmospheric decomposition of toluene following the abstraction pathway.
1.1.3.3.2 Addition
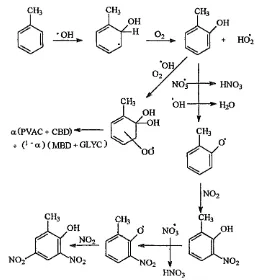
The free radical addition to the aromatic system can occur at a variety of sites around the ring leading to two main mechanisms, phenol formation and ring cleavage.
x
J \ A ) H (1.12a)
—
U
+ 'H02+ Oo __ X x
I OH
Ring Opening
r r ^ H
[image:27.614.111.497.20.293.2](1.12b)
Figure 1-6 - A Diagram Showing the Simplified Hydroxyl Addition Mechanisms for Toluene
dimethyl depending on the original aromatic compound.(1.12a) It is also suggested that both mono- and di-nitrophenols are formed. The ring cleavage yields smaller molecules, such as carbonyls, dicarbonyls and alkenes.(1.12b) 9 Figure 1-7 shows a full mechanism for the oxidation of toluene through the action of free radicals.
<x(PVAC + CBD) ---+ (! ' a ) ( MBD ---+ GLYC )
[image:28.615.168.423.97.377.2]HN03
Figure 1-7 - A Diagram Showing the Photochemical Oxidation of Toluene
1.1.3.4 Reactions of Aliphatics
1.1.3.4.1 Alkanes
An important reaction of the alkyl peroxy radical is with NO*. The alkyl peroxy radical can react with both NO and NO2. (1.15-1.17)
•R02 + N 02 ROONO2 (1.15)
*R02 + NO ---► *RO + N 02 (1.16)
•R02 + NO RONO2 (117)
As the alkyl peroxynitrates formed through the reaction with NO2 (1.15), thermally
decompose17 to their parent compounds, it is only the reactions with nitric oxide (1.16 & 1.17) that are a significant net sink for alkyl peroxy radicals.
Reaction (1.17) is a radical terminating reaction that also removes atmospheric NO. Reaction (1.16), on the other hand, is radical and NO2 propagating. The route through
which a particular alkyl peroxy radical reacts with nitric oxide is dependant on the size of the alkyl chain and the kinetics of the reactions. In general, smaller alkanes tend toward reaction (1.16). Consequently, the reactions of the alkoxy radicals formed in reaction (1.16) are of major importance to the atmospheric chemistry of alkanes.
Alkoxy radicals can react through three different modes. The first is through the abstraction of an a-hydrogen by atmospheric dioxygen to form the hydroperoxy radical and a carbonyl compound. (1.18)
0 O
1 II
R—C—R' + 0 2 ---► R—C—R + *H02 (1.18) I
H
0 1 R—C—R'
I R"
?\
-► R—C—R' + -R" (1.19)
The final mode to be discussed is isomerisation. This occurs with longer chain alkoxy radicals by way of cyclic transition states to form hydroxy-substituted alkyl radicals, which can also add O2 and react further. Research into the thermodynamics of such reactions suggests that the most favourable process is a 1,5-H shift through a six membered ring transition state. (1.20)
•o I
RCII2—CH2—CH2—CHR' RHC' 'OI I
XHR CIi2
OH
-► RCH—CH2—CH2—CHR’ (1.20)
This process will, where possible, generally dominate over competing reactions of the alkoxy radical. This isomerisation is therefore an important process in the oxidation mechanisms of higher n-alkanes.
1.1.3.4.2 Alkenes
Reactions between alkenes and the hydroxyl radical are dominated by addition across the 0=0 double bond to form a p-hydroxy radical.(1.21) As the chain length increases H- abstraction starts to play a more significant role in the overall oxidation process.
OH
1*OH
The hydroxyl radical can add to either carbon across the double bond though it has been reported that for propene the terminal carbon is favoured 65% of the time18.
The p-hydroxyalkyl radicals then rapidly react by the addition of O2 in a similar way
to that shown in reactions (1.13-1.20)
Subsequent reactions and decompositions can occur but these are beyond the scope of this thesis.
Ozone reacts directly and indirectly with a whole variety of organic compounds in the atmosphere, 10 and, as such, plays an important role in the chemistry of the atmosphere.
Ozone, in the troposphere, is one product of photochemical air pollution and is considered to be something of a health risk. In the early 1970s it was recognised that, in unpolluted air, ozone contributes to the formation of the hydroxyl radical. (Reactions (1.9-1.10)) Tropospheric ozone is formed through the following photochemical reaction sequence.
N 02 + ft v -> NO + Of (1.22)
O* + 0
2+ M —> O
3+ M
NO + O
3N0
2+ 0
2(1.23)
(1.24)
As ozone is photochemically active it can also contribute to the removal of organic compounds, especially alkenes, from the atmosphere. Because of this the reaction of ozone with alkenes is considered of primary importance in atmospheric chemistry.19
The initial step in the reaction of ozone with alkenes is the formation of a “molozonide” This energy rich intermediate rapidly decomposes to a carbonyl and energy rich biradical, called the Criegee intermediate. (1.25)
The Criegee intermediate can either be stabilised and undergo subsequent bimolecular reactions (1.26) or undergo unimolecular rearrangement and fragmentation.
Ri.V .R3
c=c + O3
R2/ NR4
*0—0
0-0 Ri
r/
C—O (1.25a)
R3,
r/ ;c= 0 (1.25b)
•c -o- a
R' R—C O—R'
+M^ D
► R—C 'P (i.26)O -R '
Another source of organic acids will be from the reaction of natural products with ozone, through a similar mechanism to that shown below. The basic building block for terpenes is isoprene, or 2-methyl-1,3-butadiene and will, therefore, react with ozone to
produce a carbonyl, methacrolein (an aldehyde), methyl vinyl ketone, and the Criegee intermediate that produces formic acid. The methacrolein can be oxidised to form an organic acid or can react with the Criegee intermediate to eventually produce methyl vinyl ketone and formaldehyde.
H
Y -O -O + CH^O CH2=d(CH3)
C-O-O + CHp
CH2=CH
ch3x h
> = o + ^ c—o —o
CH2==OI h
(1.27)
There are many possibilities for the compounds that could be formed by such reactions. The kinetics of the reaction, though, determine the type and the atmospheric lifetimes of the compounds formed in the atmosphere. 8
1.2 The Role of Organic Compounds in the Atmosphere
pathways found within living organisms, and lends weight to the arguments of Lovelock4, for the treatment of the biosphere as a complex living organism.
It can be seen that the organic chemistry of the atmosphere is as important as that of the inorganic chemistries of nitrogen and oxygen, although these tend to be given a more prominent role in the pollution and air quality debate. The public, due to poor education in schools and the sensationalism of the popular press, tend to relate organic compounds in the environment directly to anthropogenic pollution. Generally misunderstood is that there are natural sources for organic compounds in the atmosphere, from both marine and terrestrial vegetation, and that these can also act as natural sinks for organic compounds.
Most organic compounds that are found in the atmosphere are termed pollutants. But one can ask the question: Is a compound that is naturally occurring a pollutant? Although, it is convenient to use phrases such as “...biogenic pollutants... ” this is often misleading to non-scientific readers. This use of the word, pollute, may be behind public misconception on many environmental issues. How the public perceives a subject or an issue, such as air quality, will be discussed in Chapter 5.
The compounds that appear most frequently in the atmospheric cycles discussed earlier are carbonyls and carboxylic acids. These are highly oxidised forms of organic compounds and have a significant role to play in the atmospheric cycles of most other organic compounds. Hence their role in the atmosphere will now be discussed in detail.
1.2.1 Carbonyl Compounds
The sources of atmospheric carbonyl compounds are varied. In the troposphere they appear in many of the atmospheric pathways mainly as intermediates but also as end products of the photochemical oxidation of organic compounds in air. Carbonyl compounds also have many biogenic sources namely direct emission from vegetation and biomass burning.20 Anthropogenic sources such as the incomplete combustion of fossil fuels and
waste incineration also add to the atmospheric carbonyl flux.21
Dawson and Farmer22, describe formaldehyde as a ““funnel” through which much o f the carbon flux passes in the course o f oxidation to CO and CO2” From this statement we
can see that formaldehyde plays a central role in the carbon cycle.
atmospheric role of carbonyl compounds there is no one scheme which can be said to be dominant. Of all the carbonyl compounds that are found in the atmosphere it is, however, the simplest ones which are of most importance e.g. formaldehyde, acetaldehyde and acetone.
The extent of the role that is played by formaldehyde in the chemistry of the atmosphere has not been fully understood. On a technical level as analytical techniques are being improved it is becoming possible to determine formaldehyde at much lower levels than has previously been possible. Furthermore, it is now being found that formaldehyde plays an important and integral role in many different atmospheric reactions.
1.2.1.1 Sources and Sinks of Atmospheric Carbonyl Compounds
Formaldehyde is a compound that is naturally occurring within the atmosphere. Formaldehyde is, however, toxic to humans when present in high concentrations. In examining the sources and sinks of carbonyl compounds in the air I will be paying particular attention to formaldehyde.
Formaldehyde is the simplest of all the carbonyl compounds, having a relative molecular mass of just 30 amu. Regardless of the compound’s simplicity its importance in atmospheric cycles cannot be overstated.
Formaldehyde has both atmospheric sinks and sources. The primary sink for atmospheric formaldehyde is through photolysis, which is one of the fundamental reactions in atmospheric chemistry. This occurs at X < 338nm to produce two radical fragments. Equation (1.5) These radicals then react further. Equations (1.6-1.8).
Formaldehyde is also removed from the atmosphere through radical oxidation processes. The aqueous phase oxidation is a slow process requiring the hydroxyl radical. 2324
25 (1.28)
CH2(OH)2 + *OH --- ^ *HOi + HCOOH (1.28)
HQ2 + HCHO -<----*> (H00CH20)+00CH20H (1.29) HO2 + OOCH2OH ---► HOCH2OOH + O2 (1.30) OOCH2OH + OOCHzOH i>2(0CH20H) + O2 (1.31)
► HCOOH+ HOCH2O H + O2 (1.32)
OCH2OH + O2 --- ► HCOOH + HO2 (l-3^)
The atmospheric sources of carbonyls in general and formaldehyde specifically are complex and varied. It has been shown that different hydrocarbon precursors produce a wide range of carbonyl compounds upon photochemical oxidation,
shows a selection of hydrocarbons and the carbonyls that they produce.27
Table 1-1 - Carbonyl Compounds and their Sources
1° Compound Carbonyl Compounds Identified
Methane Formaldehyde
Ethane Formaldehyde, Acetaldehyde
n-Butane Methylethylacetone, acetaldehyde
Propane Acetone
Isobutane Acetone
Pentane 2-Pentanone, 3-Pentanone
Ethylene Formaldehyde, acetone
Isoprene Methyl-2-acrolein, 2-butene-2-one, Formaldehyde 1-Pentene Butanol, formaldehyde
Toluene Benzaldehyde, formaldehyde
o-Xylene Glyoxal, biacetyl, propanalone m-Xylene Glyoxal, propanalone, formaldehyde
p-Xylene Glyoxal, propanalone
Methanol Formaldehyde
Styrene Benzaldehyde, formaldehyde
in determining the composition of the carbonyls in the atmosphere. In smog chamber studies they show that, as the concentration of NO* increases, so does the proportion of aldehydes produced.
Background or ambient levels of formaldehyde are observed in the range between
0.22-11 ppb/v(pg L'1). In polluted air the levels increase dramatically, with concentrations
reported in the 10-150 ppb/v(pg L'1) range for formaldehyde. 27
The short atmospheric lifetimes reported by Calvert and Madronich in theoretical studies were confirmed by Schulam et a !29, in both urban and rural air. They observed variation of between 0.8-2.6 ppb(pg L'1) for formaldehyde and 0.2-0.8 ppb(pg L*1) for acetaldehyde.
Harley and Cass21, showed that carbonyl emissions from petrol engines comprise between 1.96% and 3.40% by weight of the total volatile organic compounds released in the exhaust, (of which -70% is formaldehyde30). They also show data to suggest that, for Southwest California, there are daily emission o f29 x 103kg of formaldehyde, 9.1 x 10³kg of
acetaldehyde, 4.6 x 10³kg of acrolein and 14 x 103kg of methyl isobutyl ketone.
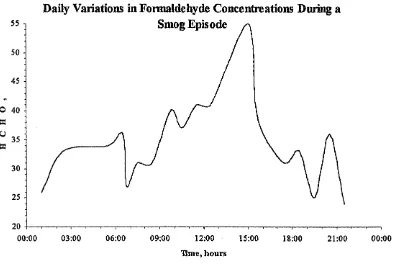
Hanst et a l31, using a long path infra red spectrometer studied various hydrocarbon compounds in Los Angeles smog. Included in the study was formaldehyde.
Daily Variations in Formaldehyde Concentrations During a Smog Episode
55 n
O 40
30
-00:00 03:00 06:00 09:00 12:00 15:00 18:00 21:00 00:00
[image:37.643.106.501.42.307.2]Bine, hours
Figure 1-8 - Chart Showing Daily Formaldehyde Variations during a Smog Episode
Although the data plotted in
Figure 1-8 was recorded during a smog episode* similar daytime variations in formaldehyde concentrations have been observed by Arlander et al.24 As well as these 24 hour variations it has also been observed that there are seasonal variations in the sources of atmospheric carbonyl compounds. Possanzim et al32, also showed a correlation between O3 concentration
1.2.2 Organic Acids
Organic acids are ubiquitous in the atmosphere, and have long been considered to play an important role in its chemistry. As far back as 1960 it was suggested that these organic compounds may contribute significantly to the ionic composition of rain.33 It was not until the 1980s, however, that there was any significant research into the role of organic acids in the atmosphere. As the analytical and sampling techniques have improved, data has been provided that allows the role of organic acids in atmospheric cycles to be understood more fully. 34 35
1.2.2.1 Atmospheric Sources
There is some uncertainty of the sources of organic acids in the atmosphere. It is suggested that the aqueous-phase oxidation of aldehydes with peroxides or hydroxyl radicals may be one source of organic acids.23-25 These reactions are proposed to occur in clouds or rain water. Equation (1.28) The aqueous phase formic acid can either be transferred to the gas-phase through evaporation or be further oxidised in solution. Analogous reactions forming higher acids are too slow to be a significant source. As aqueous phase reactions cannot account for all the organic acids present in the atmosphere, gas-phase reactions must be a major source.
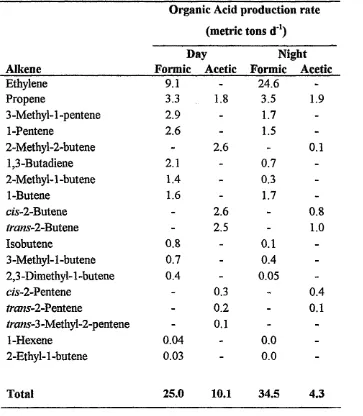
As already discussed the ozone-alkene reaction represents a significant sink for alkenes from both anthropogenic and biogenic sources. As a consequence various organic acids are produced but the dominant product is formic acid. This reaction is considered to be the main atmospheric source of formic acid.
Table 1-2 - Organic Acid Prescursors
Organic Acid production rate (metric tons d*1)
Day Night
Alkene Formic Acetic Formic Acetic
Ethylene 9.1 - 24.6
-Propene 3.3 1.8 3.5 1.9
3 -Methyl-1 -pentene 2.9 - 1.7
-1-Pentene 2.6 - 1.5
-2-Methyl-2~butene - 2.6 - 0.1
1,3-Butadiene 2.1 - 0.7
-2-Methyl-1 -butene 1.4 - 0.3
-1-Butene 1.6 - 1.7
-c/s-2-Butene - 2.6 - 0.8
*ra«s-2-Butene - 2.5 - 1.0
Isobutene 0.8 - 0.1
-3 -Methyl-1 -butene 0.7 - 0.4
-2,3 -Dimethyl-1 -butene 0.4 - 0.05
-c/s-2-Pentene - 0.3 - 0.4
#ms-2-Pentene - 0.2 - 0.1
trans-3-Methyl-2-pentene - 0.1 -
-1-Hexene 0.04 - 0.0
-2-Ethyl-1-butene 0.03 - 0.0
-Total 25.0 10.1 34.5 4.3
Another proposed source of organic acids proceeds through the oxidation of non methane hydrocarbons and aldehydes. {Equations 1,29-133 and this was discussed briefly in section 1.1.2.1.)
Ehalt et al.37 discussed the role of alkanes in the formation of organic acids. As discussed earlier formaldehyde is produced in the gas-phase oxidation reaction of alkanes. The formaldehyde can be oxidised to formic acid through the routes discussed above.
source of pollution. The effect of these sources on the biosphere as a whole is becoming more apparent, with damage to the ozone layer being very topical, but most pollutants are removed through natural atmospheric sinks within a short distance from their source.
One major biogenic source of organic acids is from the natural product, isoprene. This dialkene is the building block for terpenes and is emitted from plants. Isoprene photochemically decomposes to formic, methacrylic and pyruvic acids. However, results show that due to the amounts of isoprene emitted, this mechanism can only account for a third of the total formic acid found in the atmosphere. 35 This data suggests that there are other sources of atmospheric formic acid, especially primary emissions from vegetation, soils and from Formicine ants.35 38
The oxidation of isoprene is one of two recognised sources of atmospheric pyruvic acid. The other being the oxidation of ocresol, though this can only be considered significant in highly polluted urban areas.39 40 A major source of atmospheric acetic acid has been observed in Amazonia to originate, naturally, from vegetation and soils41.
1.2.2.2 Atmospheric Sinks
Rapid photochemical sinks for pyruvic and methaciylic acids control their atmospheric concentrations. Formic and acetic acid, however, do not undergo any gas-phase reactions that significantly alter their atmospheric concentrations.42 This being the case, these compounds must be removed by deposition, both wet and dry. At any given static sampling site, ventilation, or the movement of the air mass past the site must also be taken into consideration.
Therefore formic and acetic acids are removed from a point either by deposition or ventilation. The combination of the rates of these two mechanisms gives a daily figure for atmospheric removal. In a closed system a steady state would be achieved between source and sink. For formic acid this steady state gives an atmospheric lifetime of approximately 2.5 days.
1.2.2.3 Atmospheric Trends
that have been discussed. In the environment there are also physical processes that are occurring that, when combined with the chemical mechanisms, affect the overall levels of the organic acids in the air. There are several possible sources for atmospheric acetic and formic acids, as already described. These are biogenic and photochemical production as well as anthropogenic emission. Talbot et al.34 also suggest that due to the atmospheric lifetimes of formic and acetic acids, the re-entrainment of old boundary layer air should provide another source. They also arise from the revolatilisation of formic and acetic acid after precipitation. However, this is dependent on the meteorological conditions and the type of surface from which the revolatilisation is occurring.
Observations have shown that the concentrations of formic and acetic acid are lowest just before sunrise. This fall is thought to result from gaseous dry deposition. Talbot et a l34,
suggest that the dry deposition is the dominant mechanism hence the rapid decrease in the mixing ratio, shown in Figure 1-9.
Chart Showing Daily Variations in the Formic/Acetic Acid Ratio
1.60
v 1.40
-i
1.20 .o
1.00
-o
- 0.80 -a
06 0.60
-0.40
03:00 06:00 09:00 15:00 00:00
00:00 12:00 18:00 21:00
Ume, hours
Figure 1-9 - Chart Showing Daily FormiciAcetic Acid Ratio Variations
The first is that the sampling site was downwind of a small town, suggesting that the vehicle emissions are partly responsible for the elevated levels of organic acids. The second reason suggested is the nocturnal shrinking of the boundary layer. This has the effect of trapping these emissions closer to the surface.
Another physical feature that is thought to affect the atmospheric concentrations of formic and acetic acids on a diurnal basis is the evaporation, from plant surfaces, of early morning dew.43
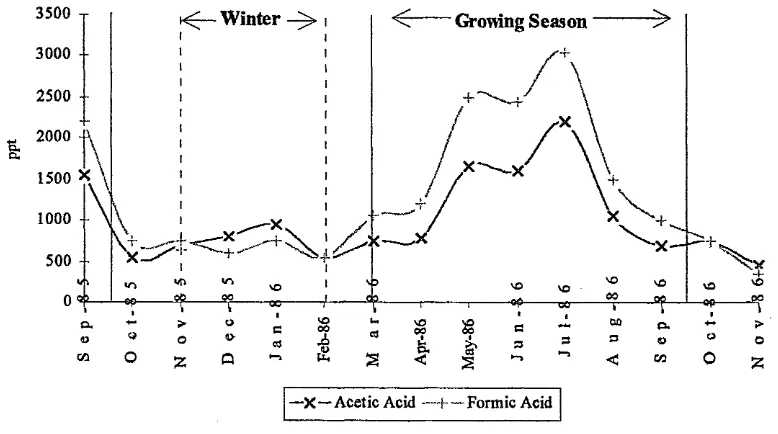
Seasonal trends have also been observed in the levels of atmospheric organic acids. The emission of organic acids, and their hydrocarbon precursors, from plants has been seen to increase rapidly during the growing season of March to September (Mid4atitude temperate site).
Q*
3500 -r - winter Growing Season
2500
-1500 * \
500
[image:42.616.96.485.264.481.2]-—X—Acetic Acid —f-—Formic Acid
Figure 1-10 - A Chart Showing the Seasonal Formic and Acetic Acids Variations
from direct emissions from motor vehicles and from the combustion of biomass. These results mirror those of Grosjean36, in which he also observed higher levels of acetic acid from direct emissions.
Talbot also reports that, during certain high-pressure weather conditions, increased levels of organic acids in the order of 3-4ppb(pg L'1), were found.
1.2.2.4 Transport of Organic Acids
Due to the location of Talbot's site and the fact that there appears to be no long range atmospheric transport of organic acids it can be assumed that in localised areas biogenic sources of organic compounds are more significant than anthropogenic sources. Hence, the quality of urban air is largely determined by two factors: the weather and the motor car.
Results of studies suggest that the primaiy sources of organic acids in the atmosphere, both in gaseous and aqueous phases, are natural. Sampling at both remote terrestrial sites and rural sites within industrialised regions give similar results. This tends toward the hypothesis that there is veiy little long range transport of organic acids within the atmosphere, and that the levels of acids are localised.34
1.2.2.5 Anthropogenic Sources
The major source of anthropogenic pollution is exhaust emissions from motor engines. Formic and acetic acid levels of 9 and 32 ppb(pg L'1) respectively have been found in the exhaust gases of petrol engines. Other higher organic acids were also found, along with benzoic acid. These direct emissions are translated into the urban atmosphere, at more diluted but still significant levels, and in similar ratios. Up to 4ppb(pg L'1) of acetic and 3ppb(p.g L'1) of formic acids were monitored in urban Los Angeles air.45 The presence of these organic acids in the exhaust is suggested by Kawamura et al 4S, to be from the incomplete combustion of the fuel. Since 19S5, however, there has been a gradual introduction of catalytic converters and this should lead to a reduction in the levels of anthropogenic organic acids.
Samples taken in Rio de Janeiro, Brazil, where ethanol is used as a primaiy motor fuel, revealed elevated levels of acetic acid. Concentrations in the range of l-18ppb(pg L'1) are attributed to the incomplete combustion of the fuel.
The study of organic acids in indoor air has received very little attention as an area for research. The organic acids found in indoor air are present either by direct emission or as an effect of external air. As part of the previously mentioned study by Grosjean et al., air samples were taken from an office building in Ventura, California. Levels of formic and acetic acids were found in concentration ranges 1-4 and 1-3 ppb(pg L'1) respectively.
1.2.2.6 Dicarboxylic Acids
Dicarboxylic acids have been reported in snow, rain and aerosols in both the urban46 47 and remote48 atmospheres. Due to their highly polar nature they readily dissolve in atmospheric water thus their gas phase impact will be limited. They are derived from primary emissions from motor exhausts and also secondary reactions from anthropogenic hydrocarbons such as cyclic alkenes.
Dominant dicarboxylic acids include oxalic, malic and succinic acids. Also observed are ketoacids including pyruvicand glyoxylic acids.
atmosphere. The rapid increase is thought to originate from the secondary photochemical reactions brought on by polar sunrise. The results of this experiment suggest that photochemical production of dicarboxylic acids should be considered as a major source.
1.3 Sampling Methods for Volatile Organic Compounds in Air
1.3.1 Introduction
“The results from an analysis are only as good as the sample ”
This quote is or should be drilled into analytical scientists from the very beginning of their training, but its importance is often missed until it is too late. The ideal sample is one that is totally homogeneous, and thus representative of the whole. However the atmosphere is a dynamic system with dynamic sources and sinks, hence the results of analysis can be difficult to interpret objectively.
One of the major problems with air sampling is that there isn’t much of it. Although air is everywhere on this planet it has a very low density. On a molar level, one mole of air has a volume of 22.4L ( at STP), compared with an aqueous sample where one mole occupies 18mL. This difference in concentration (-1.3 x 10³ ) is not appreciated until we understand that the analytical techniques are analyte and not sample dependant. Thus in order to obtain a sample that is of a similar molar concentration to one of water, we either need to use much larger volumes of sample in our determination procedures or we need more efficient sampling techniques to provide sufficient concentration.
1.3.1.1 Sampling Techniques
There are numerous ways in which air samples can be taken. Each technique is, generally, specific for the particular analytes being collected. Initially air sampling can be sub-divided into two types: active and passive. Passive sampling techniques are where the sample is collected without any mechanical assistance. Active sampling is where a volume of air is mechanically drawn through the sampling system, through either positive pressure or vacuum pumping.
Passive or diffusive samplers are used for a variety of different classes of compounds. The main usage for such samplers is in workplace monitoring. Levin and Lindahl49 discuss several approaches to the passive sampling of reactive compounds, using sorbent, liquid or filter based devices. Aldehydes can be determined readily using 2,4- dinitrophenylhydrazine doped sorbents50 51 and filters.52 Other compounds discussed by Levin and Lindahl include amines53 54, diisocyanates55 and reactive inorganics such as nitrogen dioxide, NO*.
Other reactive inorganic compounds have also been determined using passive sampling techniques. Koutrakis et al.56, used a nitrite coated filter to determine ozone. Over a period of eleven months they obtained results that were comparable with those collected concurrently from a UV photometric based system.
Grosjean et al.51, also used passive samplers to determine ozone as well as other reactive inorganic compounds. Using colourimetric reagents they determined parts per billion levels of photochemical oxidants in the atmosphere.
Brown et al.58, used a Tenax TA packed tube to perform long term diffusive sampling of volatile organic compounds. The results showed, that the sample uptake is compound dependant. The compounds of higher volatility having a lower rate of uptake as would be expected.
1.3.1.1.2 Active Sampling
Active sampling techniques can again be sub-divided into three general methods. These are grab, sparging and sorbent. Within these three groups all active air sampling methods can be classified.
Grab techniques are where a unit of air is collected and then taken back to the laboratory for analysis.59 This is the simplest of all the active techniques however it does have its drawbacks. The primary disadvantage is that there is no sample pre-concentration. Therefore the type of analytes that can be determined from this technique is limited to those found in high concentrations or those that can be determined under extreme experimental conditions i.e. large volume injection or cryogenic trapping.
the methane concentrations were in the 4.5-6.5 ppm (rtig L'^range. Evacuated 500mL glass pipettes were used for the determination of hydrocarbons in the Sydney Harbour tunnel by Duffy and Nelson60, determining both aromatic and aliphatic hydrocarbons of concentration range 2-175ppbv(pg L'1). Several workers have reported the use of polished stainless steel canisters: Bayer61 for monitoring VOC in indoor air, Sweet and Vermette62 for determining toxic VOC in Urban Illinois, Moschonas and Glavas63 for the determination of atmospheric C3-C10 hydrocarbons in Athens air. All of the reported methods required a cryogenic
trapping step before analysis. This prerconcentration step was necessary to allow adequate sensitivity for the determinations.
Sparging techniques64 65 66 are where the air sample is passed through a liquid into which the analyte is dissolved. The liquid used is dependent on the analyte under investigation. For the determination of carbonyls, 2,4-dinitrophenylhydrazine solution has been reported. This allows the insitu derivatisation of the analytes67 Also for the determination of carbonyl compounds Shi and Johnson68 used a solution of NaHS(>3 and ribose.
Sorbent sampling techniques are where the air is passed over a solid media, which traps the compounds from the air. The mechanisms for the trapping will be discussed later. Due to the versatility of solid sorbents and the range of sorbent media commercially available this type of technique is used for most air sampling applications today. Before examining the types of sorbent, consideration needs to be given to the type of extraction or desorption methods that are commonly used.
Thermal Desorption
allowing only one analysis per cartridge, meaning that for further analysis a fresh sample is required. After the initial desorption period the sorbent is effectively clean, and can be reused. Thermal desorption is a rapid and simple technique.
Thermal desorption is a commonly used technique for the sampling of VOC. Bayer61 used thermal desorption as a compliment to grab in techniques described earlier insection 1.3.1.1.2.. Ciccioli et al.,13 determined in excess of 120 compounds in air samples taken in Italy and in the Himalayas. Lewis et a l,14 used a programmable temperature injector to allow the thermal desorption of natural products. Karpe et al.15, used thermal desorption as a sample introduction technique for an elaborate detection system involving mass spectrometry, flame ionisation detection and a “sniffer” device for the determination of odorous volatile organic compounds in air. Yamashita et al.16, have demonstrated that thermal desorption can be used with a range of GC detection systems. Use of such detectors as flame ionisation and atomic emission have all been reported.
With thermal desorption the choice of sorbent material is critical. Cao and Hewitt77 found that some analytes are degraded on certain sorbents even at relatively low desorbing temperatures. An example is of a- and (3-pinene decomposing on Carbotrap at 220°C. Multisorbent beds have been used when trapping compounds that have a wide range of physcial properties. Heavner et a l18, showed that it was possible to sample aliphatic, aromatic and polar compounds from tobacco smoke in cartridges comprised of Tenax TA and Carbotrap 20/40 mesh.
Solvent Extraction
The alternative to thermal desorption is solvent extraction. There are a multitude of different approaches that have been reported that fall into the category of solvent extraction. Each has its merits and drawbacks. In solvent extraction the analyte is desorbed from the sorbent by means of dissolution into a solvent. The solvent that is used can be aqueous, organic or supercritical. The analytical method being used tends to determine which type of solvent is used.
ultrasonification. This form of solvent extraction is rapid and uses minimal amounts of solvent.
Cleghom et a f 9, extracted the sorbent in 3mL of ice cold dichloromethane for 30 minutes, for the determination of phenol, cresols and xylenols in air. Henriks-Eckerman80 used a series of solvents, extracting with 2mL of each, to assess the efficiency of XAD-2 for use in determining VOC’s in air. Koo et a/81, used a 2mL ethanol/6mL benzene mixture to extract PAH from particulates on filters. The process was aided by ultrasonification and the particulates removed by centrifugation. Kawamura et a f 2, extracted organic acids from KOH impregnated filters using pure water. They used three 5mL aliquots of water and were aided by ultrasound.
However as the sorbent and solvent are in constant contact throughout the extraction procedure it is possible for the analyte to re-adsorb back onto the surface of the sorbent material. This effect can be minimised by using multiple aliquot extractions.
Soxhlet Extraction
A technique that separates the extracted analytes from the sampling media is the Soxhlet system. The Soxhlet extractor is a piece of glassware that allows the continuous washing of a solid sample by a set amount of hot solvent. A water cooled condenser keeps the solvent refluxing within the system. After extraction the analyte is removed from the sorbent. This prevents an equilibrium being achieved between the analyte and the sorbent. Soxhlet extraction uses large amounts of solvent, energy and is very time consuming.
Chuang et a f 3, used both a single step dichloromethane (DCM) extraction (for 16h) and a two step DCM (16h) extraction followed by an ethyl acetate extraction (for 8h) for the determination of nicotine and polynuclear aromatic hydrocarbons in indoor air.
analysis. In sample reduction of this kind there is the possibility of loss of volatile samples through evaporation.
Microwave Assisted Extraction
Another process that is available is microwave-assisted extraction. A conventional microwave oven is used as a heat source for the extraction process. Lao et al,84, suggest that this technique offers similar recoveries to the equivalent Soxhlet technique, but with a shorter extraction time (c. 2.5mins). Again, however, the methodology suggests the use of large quantities of solvent and a blow-down reduction step. Commercially available dedicated instruments use smaller volumes of solvents in pressurised vessels. This in principle is similar to accelerated solvent extraction (ASE) using a microwave instead of a thermal energy source.
Accelerated Solvent Extraction
Accelerated solvent extraction is a comparatively recent innovation (c.1995). Developed by the Dionex Corporation, ASE is marketed as an alternative to supercritical fluid extraction. Although its use has so far been limited to soil samples, it is worth noting the potential offered by ASE for the extraction of solid phase sampling media. The principle behind ASE is that the solid sample and solvent are kept heated and under pressure for the duration of the extraction procedure. Dean has reported extraction times of 10 minutes85. It has been used for extraction of both polar and non-polar compounds from soil.86 87 88
Supercritical Fluid Extraction (SFE)
Supercritical fluid extraction is a technique that bridges the gap between ordinary solvent extraction techniques and the more powerful accelerated solvent extraction. Supercritical fluids have similar physical properties to liquids and, as such, have comparable extraction efficiencies to many liquid extraction systems. However, the time required for supercritical fluid extractions is considerably shorter. SFE uses carbon dioxide at 78 atm and 31°C as the solvent. Because of the comparatively low temperature, thermal degradation and pyrolysis of the sample is avoided. Solvent modifiers are often added to alter the polarity of the supercritical fluid.89 90
compounds. Hansen et al.92, report recoveries of 70-105% for a series of alcohols and organic acids compared with 0-30% for thermal desorption.
1.3.1.1.3 Sampling Media
There is a wide range of sorbent materials reported in the literature for use in air sampling. The choice of sorbent is dependant on the analytes, the preparative steps and the analytical procedure being used. There are five main types of sorbent that are routinely used. These are polymers, foams, filters, charcoal or the carbon-based materials, and silica.
Polymer based sorbents are the most common type of materials used for air sampling. They are used in both thermal and solvent desorption systems. Common materials that are used are Tenax and XAD. Each has different physical and chemical properties that can be exploited during sampling. They are obtained in particulate form of varying sizes dependant upon the end usage.
Tenax is the general trade name for sorbents based on the 2,6-diphenyl-p-phenylene oxide polymer. (Figure 1-1 \) It is generally used for thermal desorption work due to its high thermal stability but also its insolubility to polar solvents.
•OH
Figure 1-11 - A Diagram Showing the Structure of Tenax
Lewis et a f 4, used a combination of Tenax TA and Carbosieve S-IH, a carbon based sorbent, for the sampling of isoprene, methacrolein and methyl vinyl ketone. Fung and Wu95 used Tenax GR for the determination of VOC in air, reporting levels of aromatics and halocarbons with linear working ranges of between 3.2 pg m'3(ng L'1) and 770mg m'3(pg L' *) Ekberg96 used Tenax for the determination of total VOC’s in office buildings. Results were in the 0.16 to 0.35mg m‘3 (pg L'1) range.
Oliver et a f 1, used Tenax GR, as well as Carbotrap and Carbosieve S-in, in a multisorbent trap. Their automated system was used for the assessment of ozone precursor compounds. They achieved detection limits of between 0.06 and 2.4 ppbv(pg L*1) over a range of 56 aliphatic and aromatic hydrocarbons.
Another type of polymer that is commonly used is XAD. This is the trade name for several polymers based on styrene-divinyl benzene (SDB). Styrene-divinyl benzene is more resistant to solvent than Tenax and is therefore more associated with solvent desorption sampling systems. Like Tenax, however, SDB does have a tendency to decompose through reactions with NO*. Hanson et a f 4, reported the presence of 17 dichloromethane soluble decomposition products, some of which were thought to produce a mutagenic response in a Salmonella assay.
— c h2- c h —c h2- c h —c h2- c h —
6 6 6
— CH2—CH— CH2— CH—CH-CH2“CH2—
6 6