Cite this article as:
Gavin K.G., Chatta I. and O’Kelly B.C. 2006. Field measurements of horizontal stress on an
instrumented pile in sand. Proceedings ASCE GeoCongress 2006: Geotechnical Engineering in
the Information Technology Age, Atlanta, 26th Feb–1st March 2006. pp. 1-6,
1
Field Measurements of Horizontal Stress on an Instrumented Pile in Sand
K.G. Gavin
1, I. Chatta
1and B.C. O’Kelly
21School of Architecture, Landscape and Civil Engineering, University College Dublin, Dublin 2, Ireland.
email: Kenneth.gavin@ucd.ie 2
Department of Civil, Structural and Environmental Engineering, University of Dublin, Trinity College, Dublin 2, Ireland.
Abstract
This paper presents field measurements of the shaft shear stress and the horizontal stress made during the installation of a 73mm diameter instrumented pile in a heavily over-consolidated dense sand deposit. The measurements are compared with Cone Penetration Test (CPT) measurements to investigate the causes of friction fatigue on displacement piles in sand.
Introduction
Recent high-quality, instrumented pile tests (Lehane 1992, Chow 1997) have shown that the peak shaft resistance ( f) mobilized by a pile is given by:
f = hf tan f
where hf is the horizontal effective stress at failure and f is the interface friction angle measured in appropriate
direct shear or preferably ring shear tests. hf comprises two components: the stationary horizontal effective stress
( hs) that depends primarily on the in-situ sand state and installation effects, and a dilational component ( rd) that
depends on the pile diameter (D), shear modulus (G), and the pile surface roughness. Lehane and Jardine (1994) showed that whilst the rd component dominated the shaft resistance response of model piles, it was much less
important for field-scale piles (D > 300mm), therefore, the accurate prediction of hs is paramount for field-scale
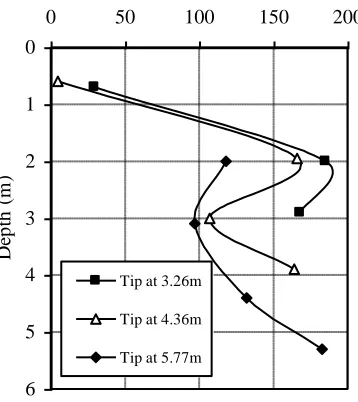
piles. The friction fatigue effect, where the hs values recorded for a driven pile at a given depth below ground level
reduce as the pile is driven further past that point, has been noted in a number of high-quality instrumented field tests. Field measurements from the installation of a 102mm diameter pile in dense sand (Chow 1997) are shown in Figure 1. Profiles of hs values measured as the pile-tip depth increased from 3.26m below ground level (bgl), to
4.36m and 5.77m bgl, showed that hs in a given horizon progressively decreased as the pile-tip moved away. This
effect, known as friction fatigue, has been incorporated into design methods such as the MTD design approach (Jardine et al. 2005).
0
1
2
3
4
5
6
0 50 100 150 200
Stationary Horizontal Stress (kPa)
D
ep
th
(m
)
Tip at 3.26m
Tip at 4.36m
[image:2.612.112.291.483.684.2]Tip at 5.77m
Physical explanations of this phenomenon have been proposed based on the stress reductions observed during cyclic loading under constant normal stiffness conditions in the laboratory (DeJong et al. 2003, Randolph 2003, and others). Based on model pile tests in the centrifuge, White and Lehane (2004) found that the reduction in the ’hs
values were directly linked to the number of load cycles experienced by the pile rather than the absolute distance from the pile tip (h). Despite these findings, recent reviews of design methods (Jardine et al. 2005, Lehane et al. 2005) have found that the design approaches incorporating h/D rather than the number of load cycles (N) provide better estimates of the shaft resistance for large databases of field tests.
The development of high-capacity pile jacking equipment (White et al. 2003) suggests that piles may be installed with very few load cycles and may, therefore, benefit from high shaft resistance. In an attempt to investigate the friction fatigue phenomenon on such piles, a series of field-tests on jacked-in-place instrumented, open and closed-ended, model piles was performed at a test bed site. Insights into friction fatigue on piles with low levels of installation load cycling are discussed based on the results of a closed-ended pile test.
Experimental Program
An instrumented pile was jacked at 2cm/sec from the base of a 1m deep starter borehole to a depth of 3.5m bgl using a 200kN capacity CPT truck. The instrumented pile, designed and built at University College Dublin, was 73mm diameter, closed-ended with a flat base. The instrumentation on the pile consisted of three levels of sensors identified in terms of the distance from the pile base (h), normalized by the pile diameter (D). The instrumentation comprised a radial total stress sensor and a pore water pressure sensor at h/D ratios of 1.5, 5.5 and 10.5. Two pressure sensors were also embedded in the base plate to directly measure the total base pressure and pore water pressure for soft soils. A blank end was used in the dense Blessington sand tested in this study. The base resistance was measured using strain gauges located placed near the pile base. Further strain gauge arrays at the pile head and at h = 1.7, 2.7 and 3.7m allowed the load distribution in the pile to be determined.
Soil Conditions
The pile tests were performed in sand that had been deposited at the bed of a glacial lake. Melting of the ice sheet coupled with varying water table levels in the lake during sand deposition, and quarrying of the upper 15m of sand and gravel, resulted in over-consolidation of the deposit, with best estimates for the pre-consolidation stress of approximately 1MPa. The in-situ sand had a relative density of almost 100%, a bulk unit weight of 20.3kN/m3, and a
degree of saturation of 71%.
Eight Cone Penetration Tests (CPT) were performed in the area of the pile installations, although two tests stopped prematurely on a gravel layer at about 1m bgl. The CPT end resistance (qc) profiles revealed a variable
deposit above 1m bgl. Below this depth, the CPT qc profiles were reasonably consistent. Profiles of minimum,
maximum and mean qc values are shown in Figure 2a. qc values of about 15MPa were measured from 1 to 2.5m bgl,
increasing to 18MPa at 2.5m bgl. Sleeve friction (fs) was measured using a friction sleeve located at h/D=3 from the
3 0 0.5 1 1.5 2 2.5 3 3.5 4
0 10 20 30
CPT qc (MPa)
z (m ) 0 0.5 1 1.5 2 2.5 3 3.5 4
0 100 200 300 400
fsav (kPa)
z
(m
)
[image:4.612.93.502.84.330.2](a) (b)
Figure 2. Cone Penetration Test qc and fs data.
Pile Installation
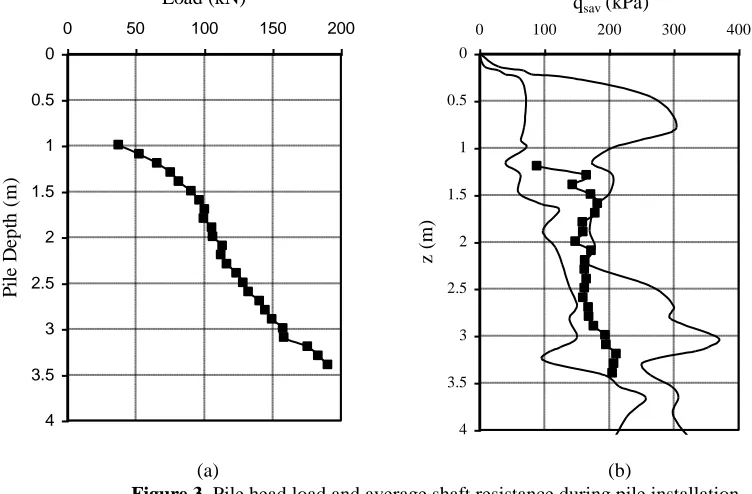
The pile installation resistance is shown in Figure 3a. Installation was halted when the resistance reached 191kN at 3.5m bgl (the available reaction being 200kN). The mean values of shaft resistance qsav, defined as the shaft load/shaft area, measured during the installation of the instrumented pile (solid symbols) broadly locate
0 0.5 1 1.5 2 2.5 3 3.5 4
0 50 100 150 200
Load (kN) P il e D e p th ( m ) 0 0.5 1 1.5 2 2.5 3 3.5 4
0 100 200 300 400
qsav (kPa)
z
(m
)
(a) (b)
Figure 3. Pile head load and average shaft resistance during pile installation.
[image:4.612.87.463.423.670.2]developing correlations based on cone friction measurements is highlighted by the inherent variability in these measurements. In addition, it is widely recognized that the sleeve friction measurements are affected by the proximity of the sleeve to the cone tip and by scale effects due to small diameter (typically 36mm) of commercial cones.
Static Load Test
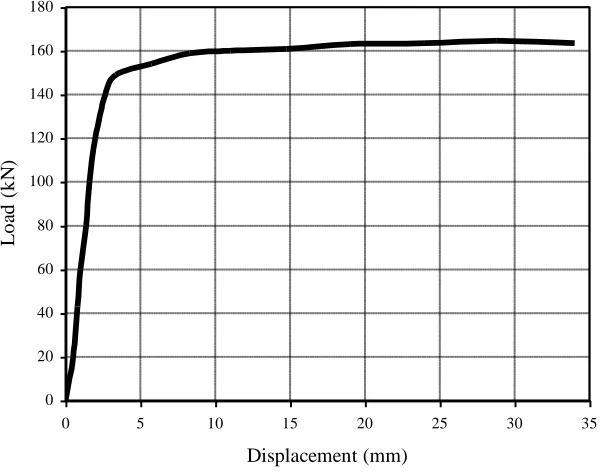
Approximately one hour after the installation of the pile, a static compression, maintained-load test was performed. The load-displacement response of the pile is shown in Figure 4. The stiff response observed is typical of small diameter, jacked piles (Gavin and Lehane 2003). The axial resistance measured for a pile head displacement of 10% of the pile diameter (about 7mm) was 157kN. This increased only slightly to 165kN for larger displacements of up to 50% of the pile diameter. The latter load can be considered as the plunging failure load of the pile and is only 85% of the installation resistance measured at 3.5m bgl. The ultimate base resistance mobilized during both the installation of the pile and the static load test do not differ significantly and are approximately equal to the CPT qc end resistance value. The difference between the installation and the static load resistances arises from differences in the shaft resistance.
0 20 40 60 80 100 120 140 160 180
0 5 10 15 20 25 30 35
Displacement (mm)
L
o
ad
(
k
N
[image:5.612.121.422.263.499.2])
Figure 3. Load-displacement response during maintained-load test.
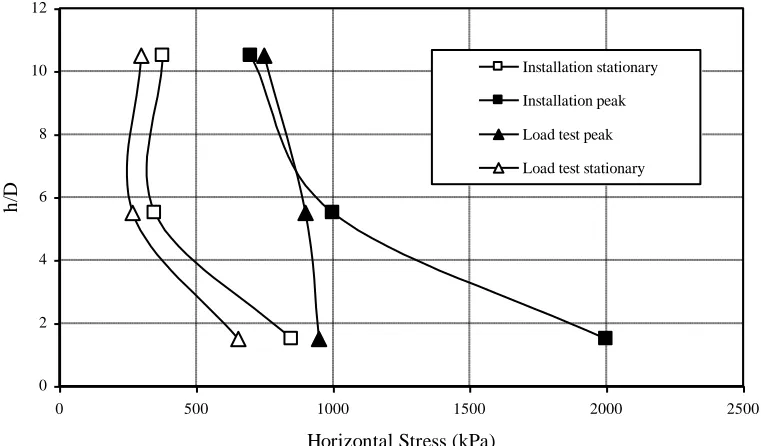
In order to fully understand the shaft behavior, it is necessary to consider both the stationary and peak horizontal effective stresses at the pile–soil interface. During continuous pile jacking, the stationary horizontal stresses could only be measured when the pile-head load was fully removed. The measurements made during the final jacking stage (including unloading) and during the static load test are shown in Figure 5.
The peak installation values (solid symbols) were measured as the pile reached its final penetration depth. hf near the pile tip (h/D = 1.5) approached 2000kPa, i.e. approximately 10% of the pile base resistance. hf reduced with increasing distance from the pile tip, to 1000kPa at h/D = 5.5 and 750kPa at h/D = 10.5. The stationary installation stresses represent the values due to one unload cycle only. These are seen to be approximately 50% of the
hf values and exhibit a clear h/D trend with values remote from the pile tip being approximately 40% of those measured at h/D = 1.5. This suggests the presence of a zone of highly stressed sand near the pile tip after unloading. This is corroborated by the large residual stresses recorded for this and similarly installed piles with residual base stress of up to 0.5qc.
5
the load test. Unloading after the load test resulted in hs (stationary load test) reducing at all levels. Reductions were similar at all h/D levels (approximately 25%) with the result that hs values measured near the pile tip remained approximately double those measured at h/D = 5.5 and 10.5
0 2 4 6 8 10 12
0 500 1000 1500 2000 2500
Horizontal Stress (kPa)
h
/D
Installation stationary
Installation peak
Load test peak
[image:6.612.93.474.134.357.2]Load test stationary
Figure 4. Horizontal stress mobilized at different h/D ratios.
Discussion
The field measurements of horizontal stress in dense sand suggest that friction fatigue depends on both the
number of load cycles and h/D ratio. Large reductions in the horizontal effective stress at a given soil horizon occur
as the highly stressed zone of soil surrounding the pile base moves away from the zone under consideration. Additional reductions can also occur due to load cycling. Evidence from multiple pile installations by Chatta (2005) suggest that the largest reductions occur during the first load cycle and hs tends to stabilize after a relatively small
number of load cycles have occurred. A tendency for the dilational contribution to be greatest when relaxation has been largest was noted in both direct shear tests and centrifuge pile tests by Lehane and White (2005) and is also evident in the hp profiles measured during the static load test, where hp is similar at all levels despite the h/D trend
evident in the hs values measured both before and after the load test. Whilst hf, and therefore the shaft resistance,
measured at multiple points on small diameter piles subjected to low levels of load cycling may indicate insignificant reductions in the horizontal stress as h/D increases, nevertheless the hs values that control the shaft resistance of full
scale piles appear to reduce due to stress relaxation effects.
Conclusions
Acknowledgements
The authors wish to thank the following people who made a significant contribution to the work described. David Gallagher and Frank Dillon who designed and built the instrumented pile. George Cosgrave, David McCauley, Martin Carney and George Jones who assisted in the fieldwork and Roadstone Limited for permission to use the quarry at Blessington.
References
Chatta I. (2005), “The effect of cyclic loading on the shaft capacity of displacement piles,” MEngSc thesis (in preparation).
Chow F. (1997), “Investigations into the behaviour of displacement piles for offshore structures,” PhD thesis, Univ. of London (Imperial College).
Gavin K.G. and Lehane B.M. (2003), “End bearing resistance of small diameter pipe piles in dense sand,” Proceedings of the International Conference on Foundation Behaviour, September, Dundee, pp. 321–330. DeJong J.T., Randolph M.F. and White D.J. (2003), “Interface load transfer degradation during cyclic load: a
microscale investigation,” Soil and Foundations, No. 43, pp. 81–93.
Jardine R.J, Chow F.C., Overy R. and Standing J. (2005), “ICP design methods for driven piles in sands and clays,” Thomas Telford.
White D.J. and Lehane B.M. (2004), “Friction fatigue on displacement piles in sand,” Geotechnique, 54, No.10, pp. 645–658.
Lehane B.M. (1992), “Experimental investigations of pile behaviour using instrumented field piles,” PhD thesis, Univ. of London (Imperial College).
Lehane B.M. and Jardine R.J. (1994), “Shaft capacity of driven piles in sand: a new design approach,” Proceedings of Conference on the Behaviour of Offshore Structures, Boston, 1, pp. 23–36.
Lehane B.M. and White D.J. (2005), “Lateral stress changes and shaft friction for model displacement piles in sand,” Canadian Geotechnical Journal, 42, No. 4, pp. 1039-1052.
Lehane B.M., Scheider J.A. and Xu X. (2005), “CPT based design of driven piles in sand for offshore structures,” Internal report No. GEO: 05345, University of Western Australia.
Randolph M.F. (2003) “Science and empiricism in pile foundation design,” Rankine Lecture, Geotechnique, 53, No.10, pp. 847–875.